Do you know that you can trade more confidently once you understand the ABCD pattern? This method enables beginner traders to understand movements in crypto charts when making a day trading decision.
The ABCD pattern trading enables you to buy and sell cryptos effectively since patterns serve as a good indicator of price moves. Once you identify the patterns, you can place big or small trades without a doubt.
So, if you’re ready to maximize profits with the ABDC chart pattern, keep reading for more details.
Every ABCD pattern trading comes in both bearish and bullish versions. The bearish versions come in an ascending pattern, indicating the opportunity to sell or short trades. On the other hand, when the ABCD pattern descends, it represents the bullish version, which signifies opportunities to go long or buy.
Each ABCD pattern turning point indicates a high or low of a trend on a price chart. The points come in three legs and show consecutive trends or price swings that can be analyzed using the Fibonacci retracement. The pattern legs are AB, CD, and BC (the correction or retracement).
In the bearish ABCD chart pattern, when there is an uptrend, it signals a bearish market reversal to the lower points. If you’re an aggressive trader, you will consider initiating a short trade near point D and placing a stop-loss order above point D. For conservative traders; it is safer to confirm a trend change when the price falls below point C before making the short trade.
Bullish ABCD Pattern
| Feature | Bullish ABCD | Bearish ABCD |
|---|---|---|
| Starting Point | High (A) | Low (A) |
| Direction | Down → Up | Up → Down |
| Entry Signal | Buy at D | Sell at D |
| Stop Loss | Below D | Above D |
| Take Profit | Up to C or A | Down to C or A |
A bullish ABCD pattern on a trading chart starts from point A, the beginning of a high point, and ends at point D, the lowest point.
In the bullish ABCD Pattern, as shown above, point A will be the starting point of the price movement, which is usually a high swing. Then point B represents the intraday low while point C represents an upward price correction. Finally, the swing arrives at point D, the lower point than B, indicating a buying point.
Note: when the ABCD chart pattern is bullish, a trader can place the stop-loss order below point D and stay on the trade until the crypto price reaches point C.
Identifying A Bullish Trend With The ABCD Pattern
A bullish ABCD pattern starts from a high A point. Then the trend comes low to point B, indicating the first low price. From point B, the pattern climbs to C, a high price but not as high as A, reflecting the highs and lows of the market. Then, the pattern will end at D being the lowest low point where a trader is expected to buy.
A simple indicator is that when the pattern is bullish, Point C is lower than point A and point D must also be lower than point B.
ABCD Pattern Trading Rules For Bullish Trend
- To find AB, point A on the pattern is usually high while point B is always low. Then when the pattern moves from point A to Point B, there won’t be a high price trend above A. Also, there will be no low trend below point B.
- You must follow the pattern to find BC if the leg is on AB. Note, point C must be slightly more than A to improve your trading strategy. When the pattern moves from point B to C, there won’t be a low price below B, and there won’t be a high price above C. Usually, point C is 61.8% of point AB or 78.6%. If the market is strongly trending, leg BC might be 38 or 50% of leg AB.
- If the movement is at BC retracement, draw leg CD. Note that point D on the pattern will be at a lower point than B. When the pattern moves downwards from point C to point D, there will be no high price at C and no low price below D.
To determine the price at point D, the price at CD might equal the price at AB. The time for CD and AB may be equal to identify the time when D will complete.
| Leg | Typical Retracement (%) |
|---|---|
| BC | 61.8% or 78.6% |
| CD | Equal to AB in size |
| Time Symmetry (AB ≈ CD) | Yes (used to project D) |
- Always look out for Fibonacci sequence, trend convergence, and the ABCD pattern in trading.
- Also, watch out for wide-ranging bars, price gaps, or candles in leg CD when the market movement is approaching point D.
Bearish ABCD Pattern
| Leg | Rule |
|---|---|
| AB | No higher high above A or lower low below B |
| BC | C retraces AB, often 61.8% – 78.6% |
| CD | Length and time similar to AB |
On the graph above, the bearish ABCD pattern starts moving upward from point A and reaches a high intraday price at point B, indicating potential highs and lows. Then the second leg moves downside from point B to C, representing a low swing higher than point A. Then the final price movement starts from point C to D, a higher swing above B where you must sell.
If the ABCD pattern is bearish, a trader should short the crypto pair. The stop-loss must be above point D, and he must remain there until the crypto price reaches point C.
Identifying A Bearish ABCD Pattern?

To identify the bearish ABCD pattern trading, check the starting point. It moves from point A, which is usually at the lowest position. Then it rises a bit to point B marking the first high point on the graph. From that point, it comes down to point C, the low level, and finally rises to point D, the highest point where traders must sell.
Bearish ABCD Pattern Rules
- To find leg AB, look for where Point A is low, and point B is high. Check the movement from A to a climb up the B point, there won’t be low prices below A, and there won’t be high prices above the B point.
- To find the BC point after identifying AB, point C will be significantly higher than A, and when the trend is moving from B to low C, there won’t be high prices above B and low prices below the C point.
- After identifying BC, you can draw a CD. But note that point D must be above the B point, and when the trend moves from C to the highest point D, you won’t find low prices below C or high prices above D.
To identify where the D price will be, both CD and AB prices must be equal, adhering to the principles of the ABCD pattern in trading. Also, to identify the time when the D point will be complete, CD time and AB time will be equal.
ABCD Pattern Example In Crypto Trading
In the below example, the Bitcoin price formed an ABCD pattern at the beginning of 2022. The pattern took a full four months to develop, beginning at the AB wave. Price then retraced via the BC leg, eventually rising to complete the pattern at the conclusion of the CD leg. After the pattern was completed and the Fibonacci ratios satisfied, Bitcoin price plummeted and broke down through the previous trading range.

A Step-By-Step Guide To Using The ABCD Trading Pattern on Margex
| Step | Action |
|---|---|
| 1 | Draw ABCD pattern using Margex tools & confirm with Fibonacci |
| 2 | Enter short at D (after 1.272 extension in bearish pattern) |
| 3 | Place stop-loss above point D |
| 4 | Take profit at C or extend beyond A |
Margex is a beginner-friendly derivatives trading hub for digital assets. Margex offers access to built-in technical analysis tools to allow traders to easily chart the ABCD pattern and potentially take action based on its signals in the forex market.
Here is how to trade the ABCD pattern with Margex:

Step 1 – Use the built-in ABCD pattern drawing tool to find ABCD patterns in crypto. Ensure that the Fibonacci ratios properly fit the harmonic trading pattern.

Step 2 – With the bearish ABCD pattern properly identified, a trader can choose to take a position. A sell order should be placed after reaching the 1.272 Fibonacci extension at the D point of the pattern.
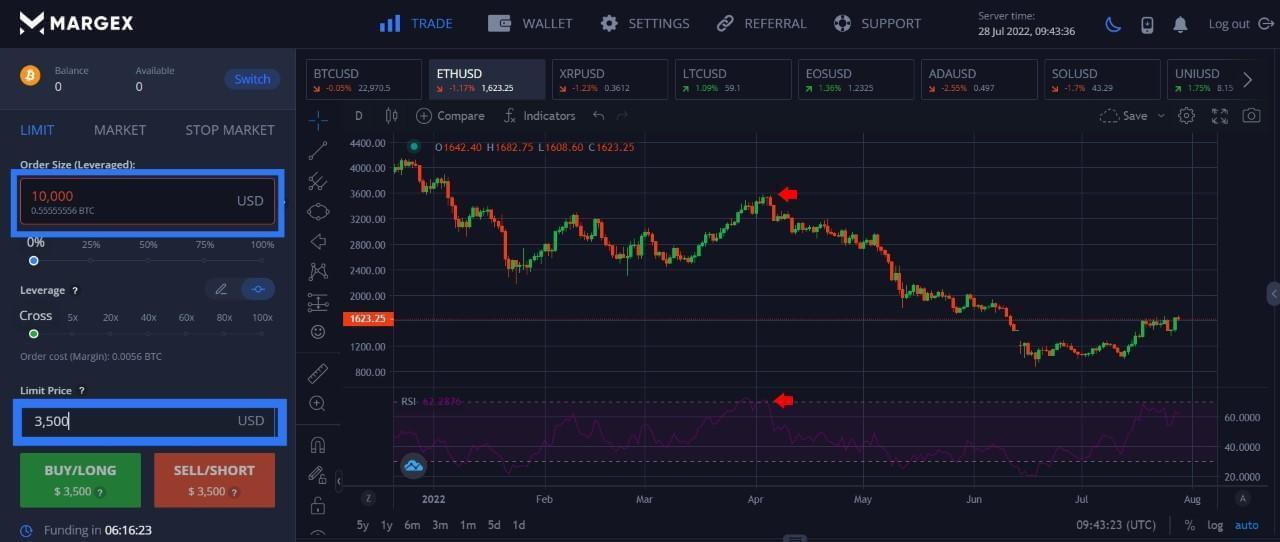
Step 3 – Traders should place a stop loss order above the high of the D-point to protect against unwanted drawdowns in case the market continues to move up and the pattern is invalidated. A stop loss order is a critical piece of any risk management and trading strategy.

Step 4 – Profit can be taken at predetermined levels for the highest probability of success. The first target of the pattern would be to retrace back to the C-point of the pattern. A more aggressive price target would be beyond the origin of the pattern’s A-point.
FAQ
What is an ABCD pattern?
The ABCD pattern is a type of harmonic pattern used in both stock trading and forex trading to identify potential trading opportunities. It consists of three consecutive price swings, forming two legs: AB and CD. Traders utilize the Fibonacci retracement tool to pinpoint ideal entry points and exit points for their trades.
How accurate is the ABCD pattern?
Common mistakes in ABCD pattern trading include failing to consider the overall market trend and analyzing the pattern in isolation. To improve success, traders should not only rely on the ABCD pattern but also incorporate additional tools into their trading arsenal.
What is the success rate of the ABCD pattern?
Knowing when to look for buy or sell signals when trading is crucial, as is understanding that the ABCD pattern requires careful analysis of each leg of the pattern. Overall, while the ABCD stock pattern can be effective, it should be used in conjunction with other key chart patterns for optimal results.
What is the ABC pattern strategy?
The ABCD strategy can indicate both bullish and bearish trends, depending on the direction of the pattern. However, the accuracy of the ABCD pattern may vary, with success rates often dependent on market conditions and the trader’s experience.