Technical analysis for traders is a must-learn skill to have an edge and outplay major players such as institutions and whales in the financial market. Gaining all the required skills in trading coupled with the right psychology, traders will be presented with numerous opportunities to profit.
One of the major challenges traders face, both advanced and beginner traders, is the need to find the best entry, exits, bottom, top, trend reversals, and different market cycles to profit and, simultaneously, preserve capital from excessive risk exposure.
Traders go to great lengths to combine candlestick patterns, chart patterns, strategies, and even indicators to outsmart the market due to its high volatility and price actions.
This guide focuses on the bullish harami pattern as one of the many technical analysis candlestick patterns for determining trend reversal. A bullish harami is a candlestick pattern that can be useful in a trading strategy to find trend reversals in the financial markets.
What Is The Bullish Harami Candlestick Pattern?
The bullish harami candlestick pattern is a trend reversal pattern formed at the end of a downtrend or bearish trend, signaling a trend reversal is imminent. This is a Japanese candlestick pattern made up of two candlesticks; the first candle stick is a bearish candle with a large body with short upper and lowers wicks or shadows, and the second bullish candle has a short body.
The name “Harami” has a Japanese origin meaning pregnant woman because the downtrend is about to give birth to an uptrend from forming the candlestick pattern.
There are two types of harami candlestick patterns, namely, the bullish harami pattern and the bearish harami pattern. This article will focus more on the bullish harami candle pattern.
How To Identify The Bullish Harami Candlestick Pattern In Margex
Margex is a bitcoin-based derivatives platform that enables traders to trade up to 100x in leverage size. At the same time, you can stake your tradeable crypto assets with the help of their unique staking feature to earn up to 13% APY returns. There are no lockup periods as staking rewards are sent to your staking balance instantly daily with the help of their automated system. You don’t need to be an advanced trader to enjoy the benefit of using the Margex platform’s unique staking feature.
All you need to do is to create a Margex account, and if you are an existing user, you can log in to access all the features of Margex, including free trading tools, for your convenience.
Margex unique UI helps even beginner traders to trade easily and utilize the technical analysis tools available to spot great bullish reversal trends like the bullish harami candle pattern.
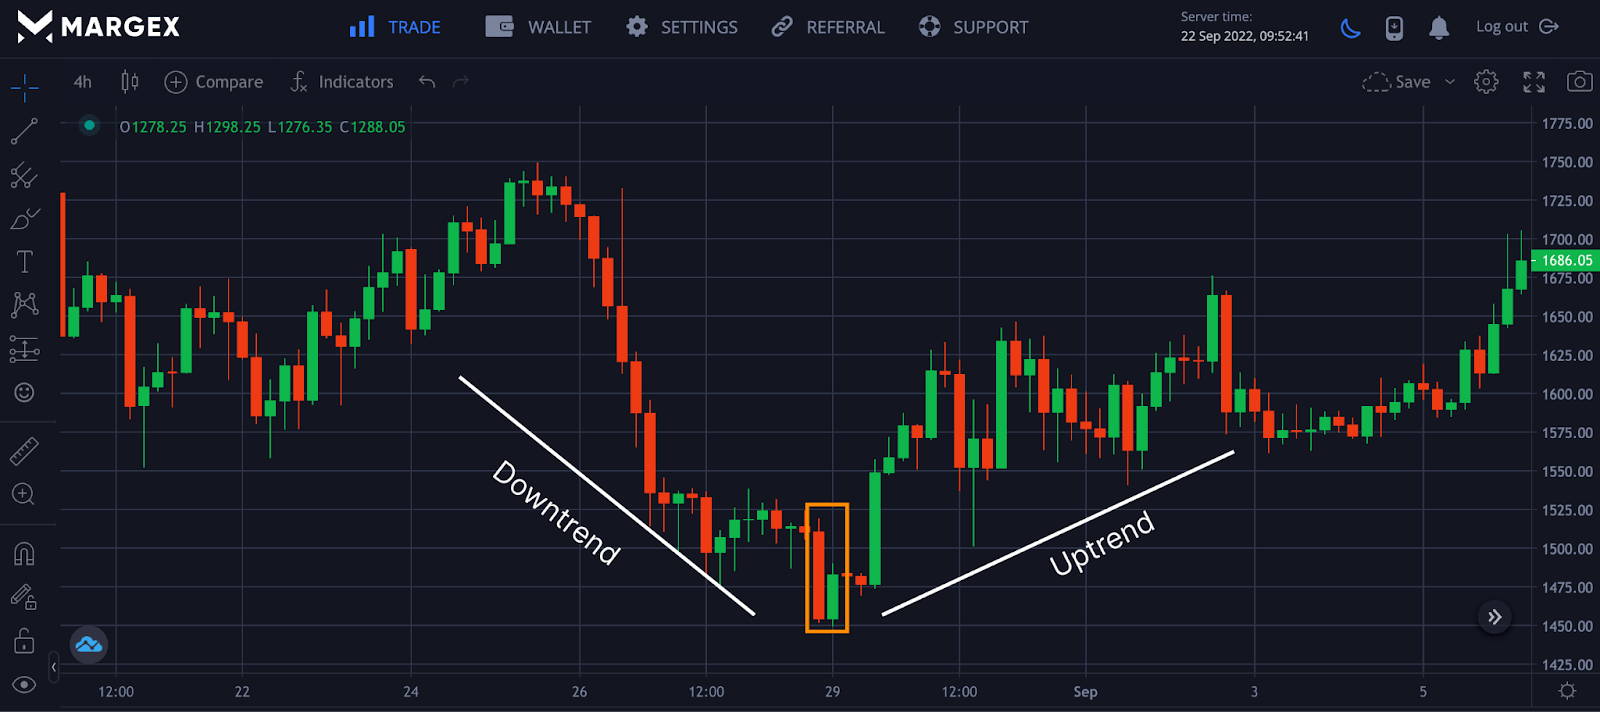
From the chart above, the bullish harami candlesticks signal the end of a downtrend with a new uptrend for ETHUSD pairs. These candle patterns, as the name implies, bullish harami are found at the end of a downtrend with a series of swing lows or bearish candles.
As the downtrend by sellers gets weakened, a sharp rally begins when the buyers step in, but the volume is not as strong as those of the sellers; hence the small body bullish candle before the buyers forces the trend to reverse completely.
How To Trade Margex Using The Bullish Harami Candlestick Pattern – Strategies And Examples
The bullish harami candle pattern is a simple and frequently used pattern by traders to spot reversal and ride early uptrend for higher and quick profit gains. Let us see how we can trade the bullish harami pattern with other trading strategies and indicators.
Trading Strategies:
A trading strategy is a set of methods or plans considered before buying or selling a particular crypto asset while considering the risk to reward attached to the investment a trader is about to take. In this case, we will see how to combine the bullish harami candle pattern with other trading strategies like price actions and indicators.
Trading Harami with Price Action:
Trading the bullish harami with other price action gives you an edge and more accuracy regarding riding trend reversals that would be highly profitable while setting up your stop-loss.
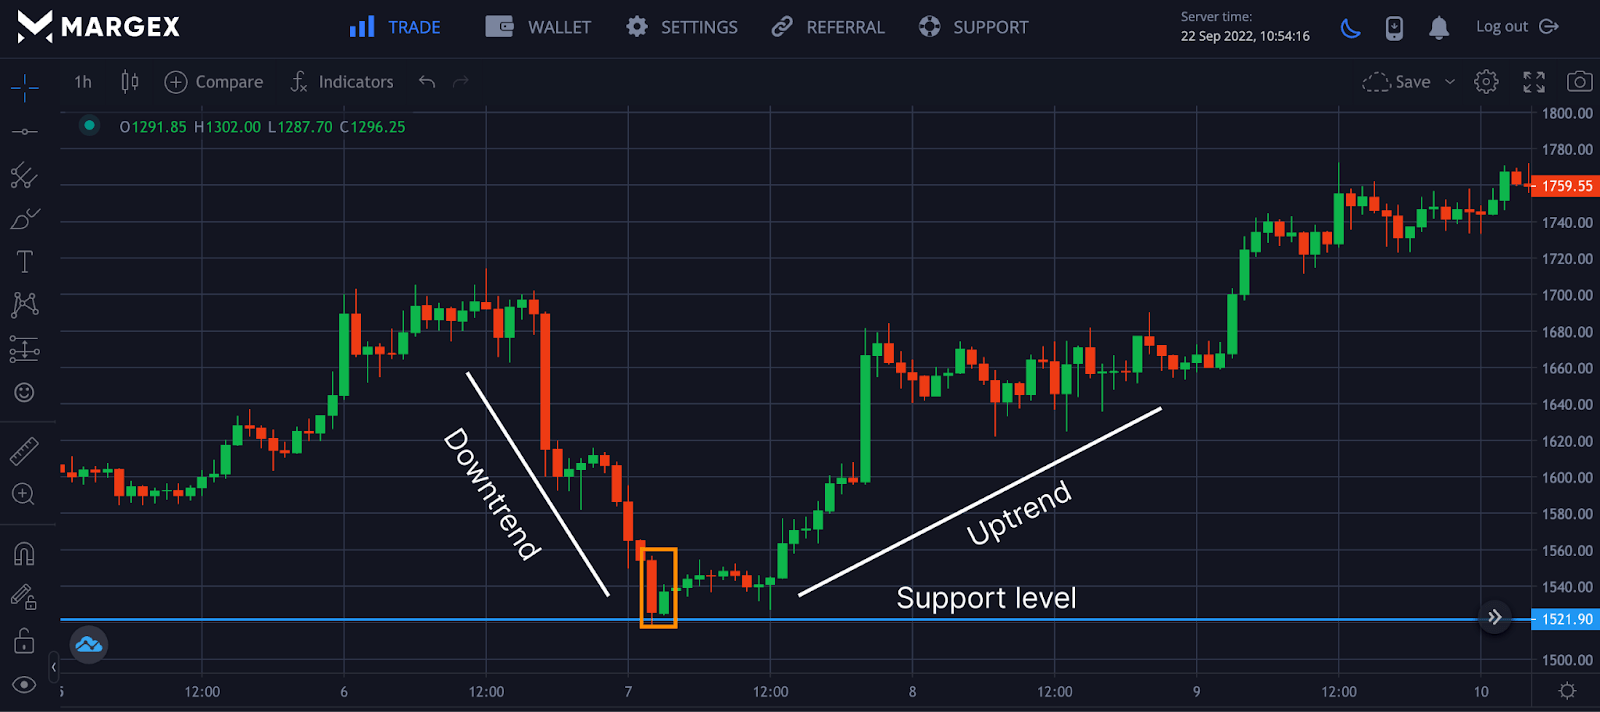
The chart above shows the combination of bullish harami formed in support of previous price actions. The formation of the harami candle pattern at the support gives more accuracy to price reversal for the ETHUSD pair on the one-hourly timeframe.
Trading Harami with Indicators
Another way to use the harami candle pattern is to trade with trading indicators or oscillators for a reliable trading strategy. Let’s consider the use of MACD, RSI, and Fibonacci retracement.
The Bullish Harami Chart Pattern With MACD And RSI
Trading the bullish harami pattern with other trading indicators and oscillators gives you more edge in the market.
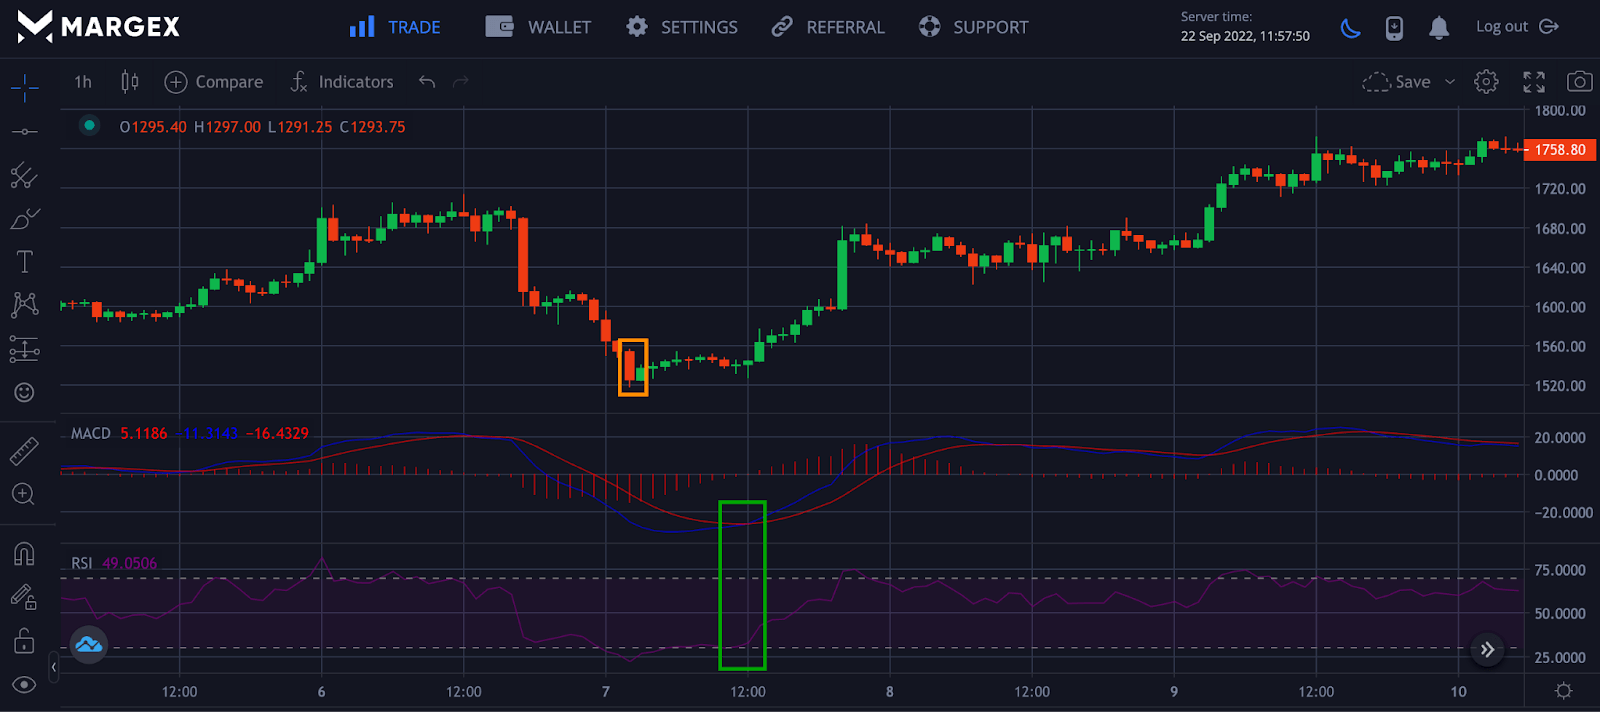
The chart above shows a bullish harami signaling a change in trend from a bearish trend to a bullish one. This was confirmed by Moving Average Converge Divergence (MACD), with a crossover indicating a change in momentum followed by a rise from oversold region by Relative Strength Index (RSI).
The confirmation of these indicators with the bullish harami led to the uptrend in price as buyers pushed the price in their favor.
The Bullish Harami Chart Pattern With Fibonacci Retracements
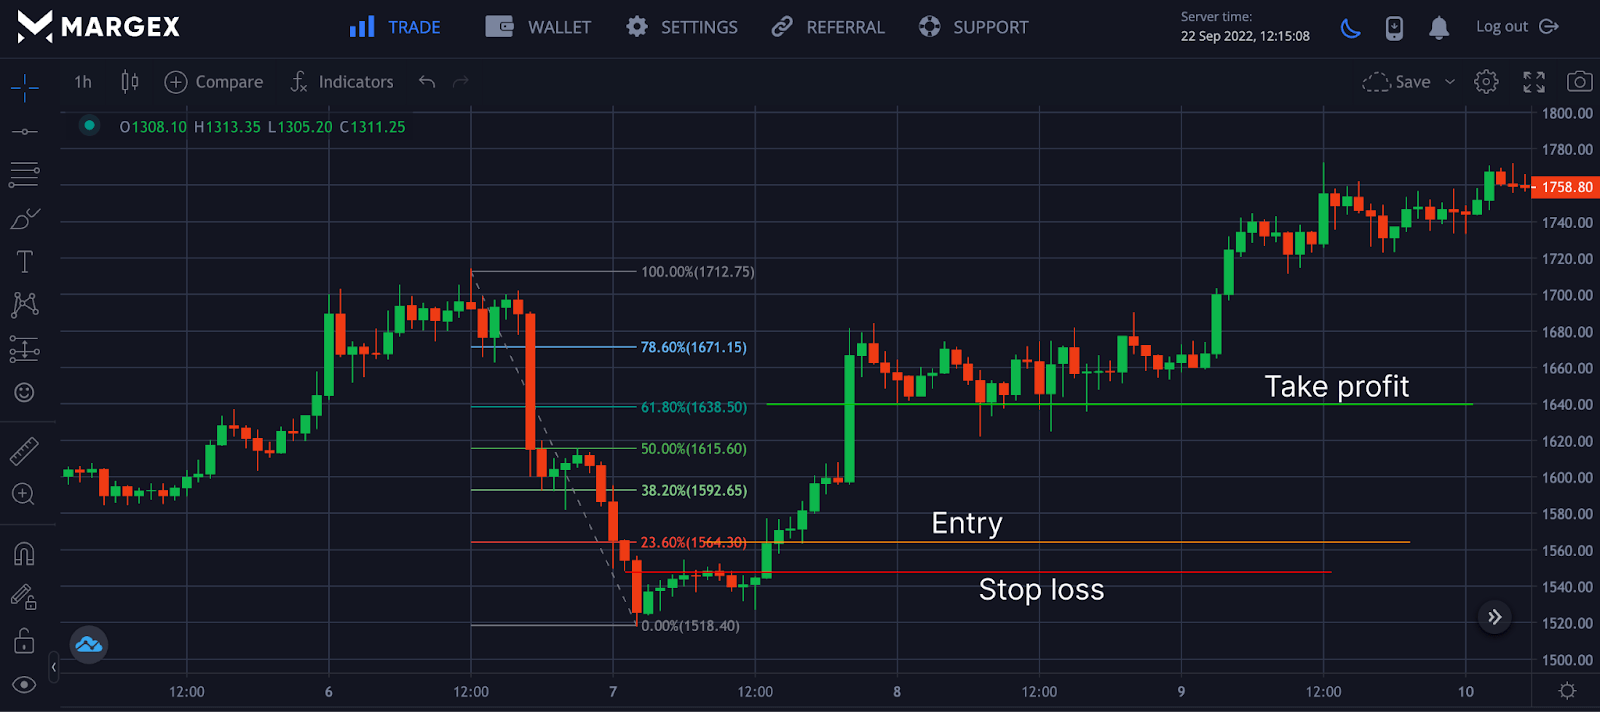
Another strategy combined with the bullish harami pattern is the Fibonacci retracement strategy for entry and exit. From the chart above, a 23.6% Fib value break triggers an entry while setting a stop loss at the previous swing low. The take profit for this trade is set at the 61.8% Fib value, indicating the trend looks weakened.
The Bullish Harami Candlestick Pattern – Pros And Cons
Like other candle stick patterns, the bullish harami candlestick pattern has limitations due to market volatility and price actions. Let us consider the pros and cons of the bullish harami pattern.
The pros of the bullish harami pattern include ease of identification. Patterns are easily combined with other indicators and strategies like MACD, RSI, and Fibonacci retracement for quick and higher profitability.
The cons of bullish harami include the pattern not occurring frequently and needing more confirmation from other technical indicators.
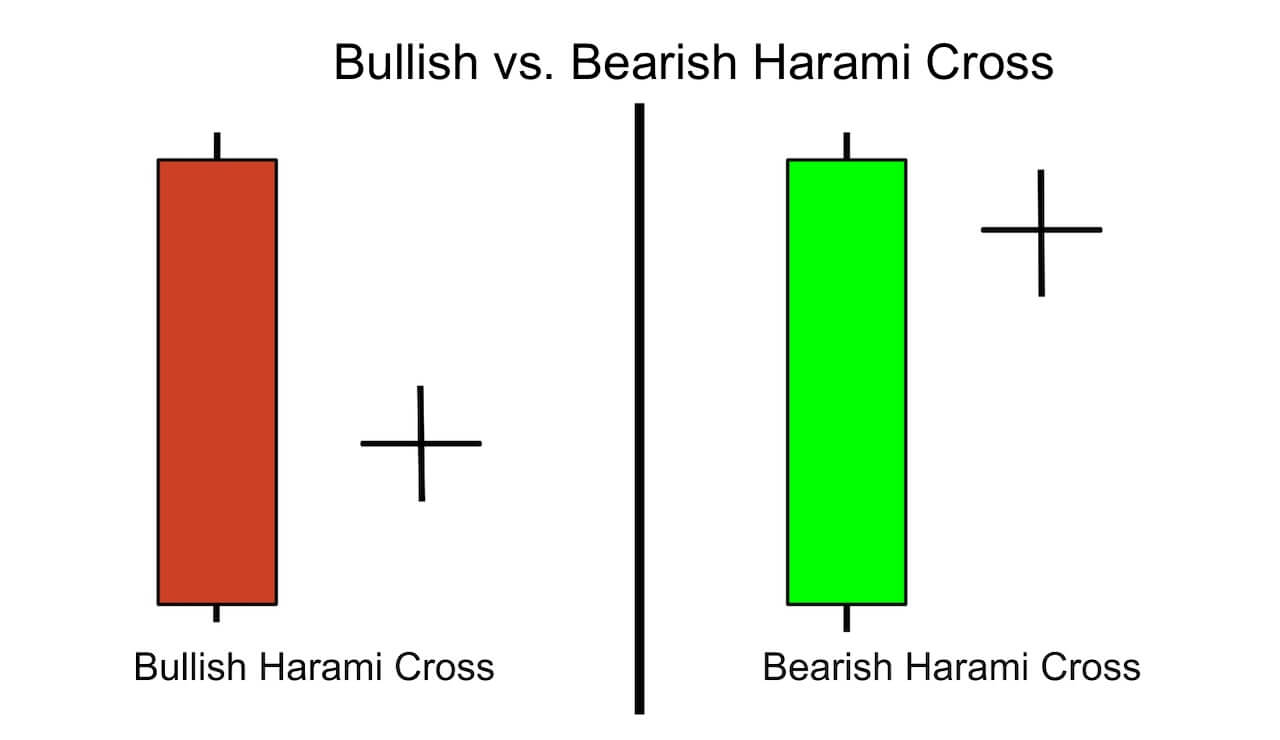
Harami Cross VS Doji Candle
Mastering Japanese candlestick patterns can be challenging, especially when they are similar. For instance, the Harami cross is a type of harami pattern that looks like the Doji pattern.
The Harami cross pattern combines the Harami pattern and a star Doji that looks like a plus sign. The star Doji or plus sign must be engulfed by the full-bodied candle for a bullish or bearish harami cross pattern.
The star Doji that looks like a plus sign is trendless and signifies indecision for buyers and sellers.
Frequently Asked Questions On Bullish Harami Patterns
Here are frequently asked questions about bullish harami patterns and how to trade them.
What Is A bullish Harami Pattern?
A bullish harami pattern is a type of two candlestick formation and reversal indicator that may alert traders to a possible bullish reversal from downtrends on a price chart.
The bullish harami unique candlestick formation may indicate to traders that a downtrend or bearish cycle has weakened or coming to a close.
Traders usually spot bullish harami candlestick patterns during bear cycles or major downtrends.
Bullish harami candlesticks pattern formation may present opportunities and serve as an area of interest for position traders with multiple confirmations of a bullish price reversal.
How Do You Play Bullish Harami?
Traders may look to spotting and identifying bullish harami candlestick setups resting on a price support zone or moving averages acting as support.
On spotting a bullish harami candlestick support, investors and traders may utilize technical indicators such as price and volume indicators to aid confirmations of a trend reversal.
Trading decisions based on standalone bullish harami candlesticks setup may not be advisable due to false reversals and breakouts.
Traders may want to utilize stop orders on trading platforms such as the Margex trading platform to manage risks.
How Accurate Is Bullish Harami?
The accuracy of a bullish harami candlestick pattern formation leading to price reversals may vary from trader to trader.
Advanced traders leverage the bullish harami candlestick pattern by combining it with other trading tools and technical indicators to solidify a full-price reversal.
A bullish harami candlestick formation is only as accurate if other indicators, such as the relative strength index and volume indicators, also indicate the likelihood of a strong bullish price reversal.
Traders and investors utilize a combination of technical indicators available at trading platforms such as the Margex exchange for higher reversal accuracy using the bullish harami candlestick indicator.
Is Harami Bullish Or Bearish?
The harami candlestick pattern formation can appear on a price chart as either a bullish harami candlestick formation or a bearish harami candlestick formation.
In each case, traders may look for harami candlestick formation on a price chart as indicators for a possible bullish or bearish price reversal.
Traders may also do well to employ other technical indicators to validate and make further confirmations on price reversals, be it bullish or bearish.
Smart traders also leverage stop orders such as stop loss and take profit entries to mitigate risks of a false reversal and secure profits.
How Do I Trade In Harami?
The harami candlestick pattern formation, which can occur on a price chart as bullish or bearish, can be traded by investors and traders irrespective of its type of occurrence.
First, a trader must pay keen attention to uptrends and downtrends to identify and spot harami candlesticks formation on a price chart.
Upon spotting the harami candlesticks pattern formation, traders may have to further validate price reversals by utilizing other technical indicators and tools on a price chart.
Leveraging renowned trading platforms such as the Margex platform grants access to traders looking to employ trading tools and technical indicators to validate the harami price reversal signals.
What Does A Harami Look Like?
The harami is made up of two distinct candlestick pattern formations, with the size of the first candlestick notably long and the size of the second candlestick noticeably smaller.
The first candlestick’s body must engulf or overshadow the second candle’s body. The second candle should ideally be less than half the size of the first.
The harami candlestick pattern is usually likened to a pregnant mother and the unborn child, notably smaller than the mother’s stature.
The pregnant mother would be the first (long) candlestick, and her unborn child would be the short candlestick engulfed by the long candlestick.
What Is The Bullish Harami Cross Chart Pattern?
A bullish harami cross-chart pattern is visible on a price chart as a very long bearish candle followed by a Doji. It appears mostly in bearish cycles or downtrends.
If a Doji candle forms after a long bearish candle close, a bullish price reversal will likely occur and continue to the upside.
Traders pay close attention to bullish harami cross formations on a price chart as it may present opportunities to enter long positions and buy entries.
Traders may also get further confirmations on a price reversal by utilizing other technical indicators and tools and waiting to see bullish price action following the formation of the harami cross pattern.
How Reliable Is The Bullish Harami Candlestick Pattern?
Bullish harami candlestick patterns are undoubtedly helpful for spotting and identifying price trend reversals.
In most scenarios where a bullish harami appears on a price chart, a price reversal occurs when the pattern appears in its ideal configuration, making it precise and trustworthy.
However, traders may be advised not to solely make trade decisions based on the formation of the bullish harami candlestick pattern.
To fully confirm price reversals, traders may pay attention to price action and use other technical indicators and tools.