Cryptocurrency traders commonly discuss a variety of technical analysis patterns and shapes. Many of these patterns resemble a letter from the alphabet, such as V-, U-, or W-shaped bottoms, and M-shaped tops.
However, a less common pattern found throughout cryptocurrencies, is the H trading pattern. The H pattern is a powerful continuation pattern that forms at a support level that is quickly taken out in subsequent trading sessions.
The following H pattern trading guide will teach you how to effectively identify the pattern in crypto price charts and trade the pattern profitably.
What Is The H Pattern In Crypto? H Pattern Trading Explained
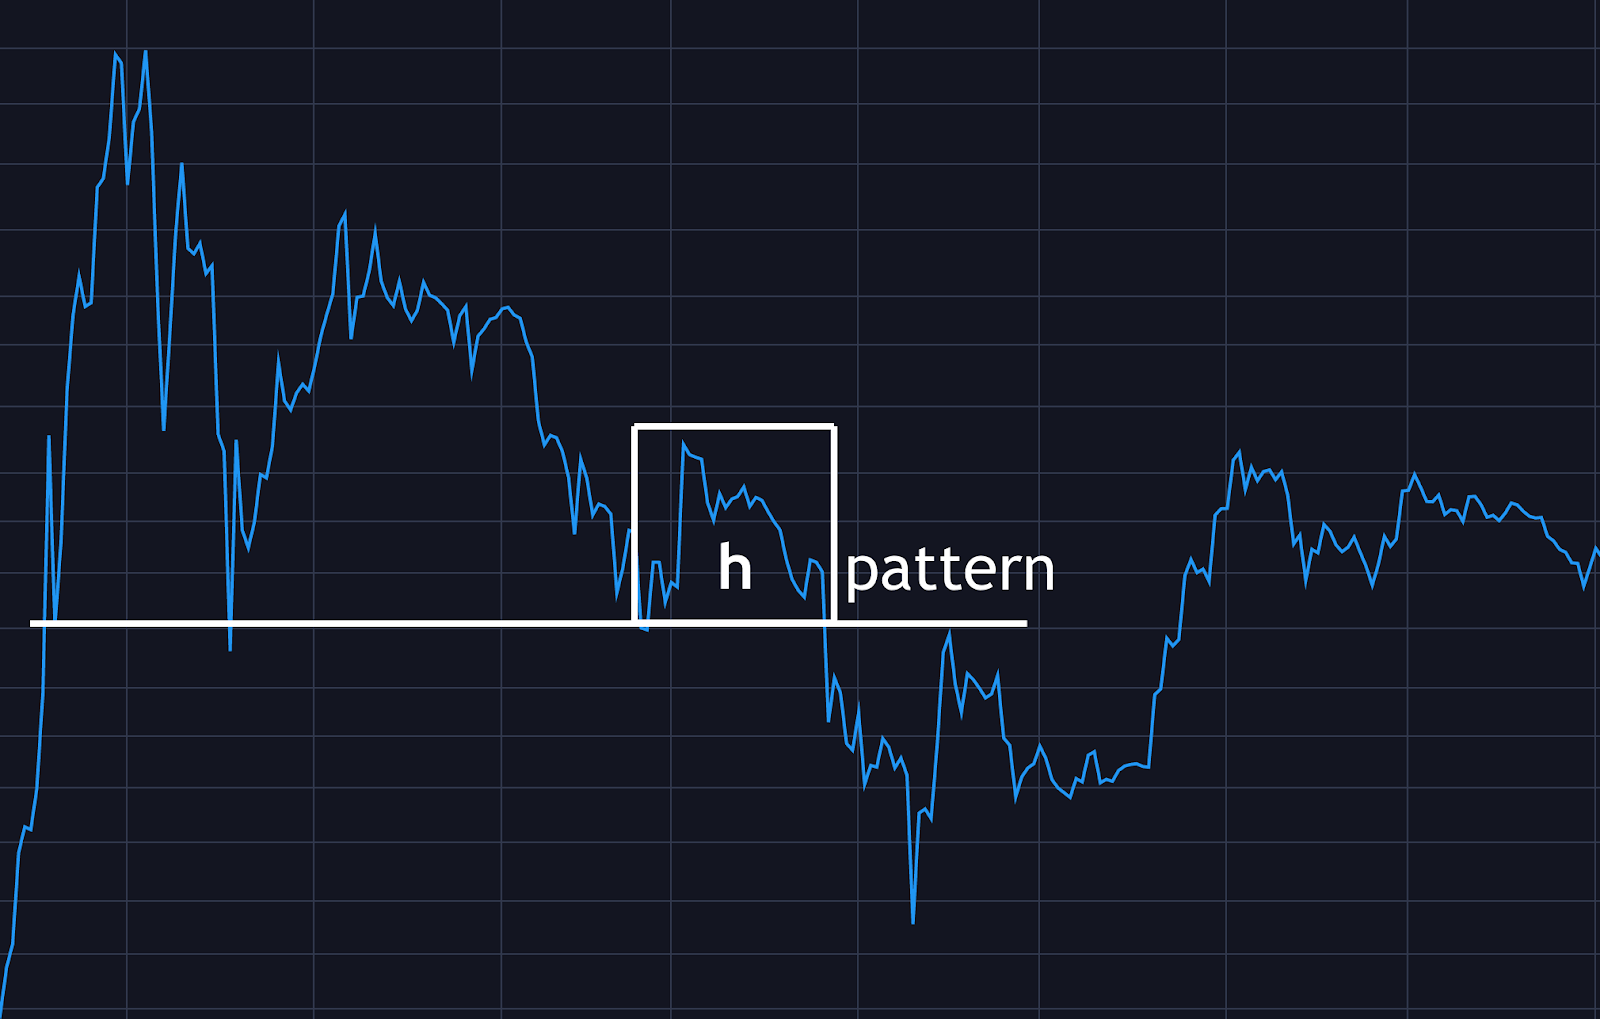
The H pattern is a lower case h-shaped chart pattern that forms after a cryptocurrency has retested the low point of a support level marked by a recent decline, and continues downward through support making fresh lows.
H pattern traders can use the shorting signal and sell setup and look for a profitable entry point following a breakdown from the bottom of the H pattern. An H pattern is only confirmed after price action breaks through the first support level and results in continuation of the downtrend.
The H pattern can also contribute to continuation and breakdown of other patterns. For example, the H pattern can form at the breakdown and confirmation point of larger, high time frame chart patterns.
How To Identify The H Trading Pattern? All About The H Sell Setup
The H pattern essentially starts off with a sharply falling price movement that creates the first vertical line of the letter h. Next, there is a large dead cat bounce with a rounded price action that fails to make it through resistance.
The initial bounce highlights a mad dash from crypto traders stepping in to buy a support level. However, when market participants realize the price is not reacting with a reversal, the combination of continued selling and exits from support buyers results in a much deeper decline and continuation of the first large price movement.
The H pattern is often referred to as “hell for shorts” as it can lead to frustration when the pattern doesn’t perform and breaks down as expected. This is why proper stop loss placement and risk management is necessary for a volatile market.
Example Of H Pattern Trading In Crypto Markets
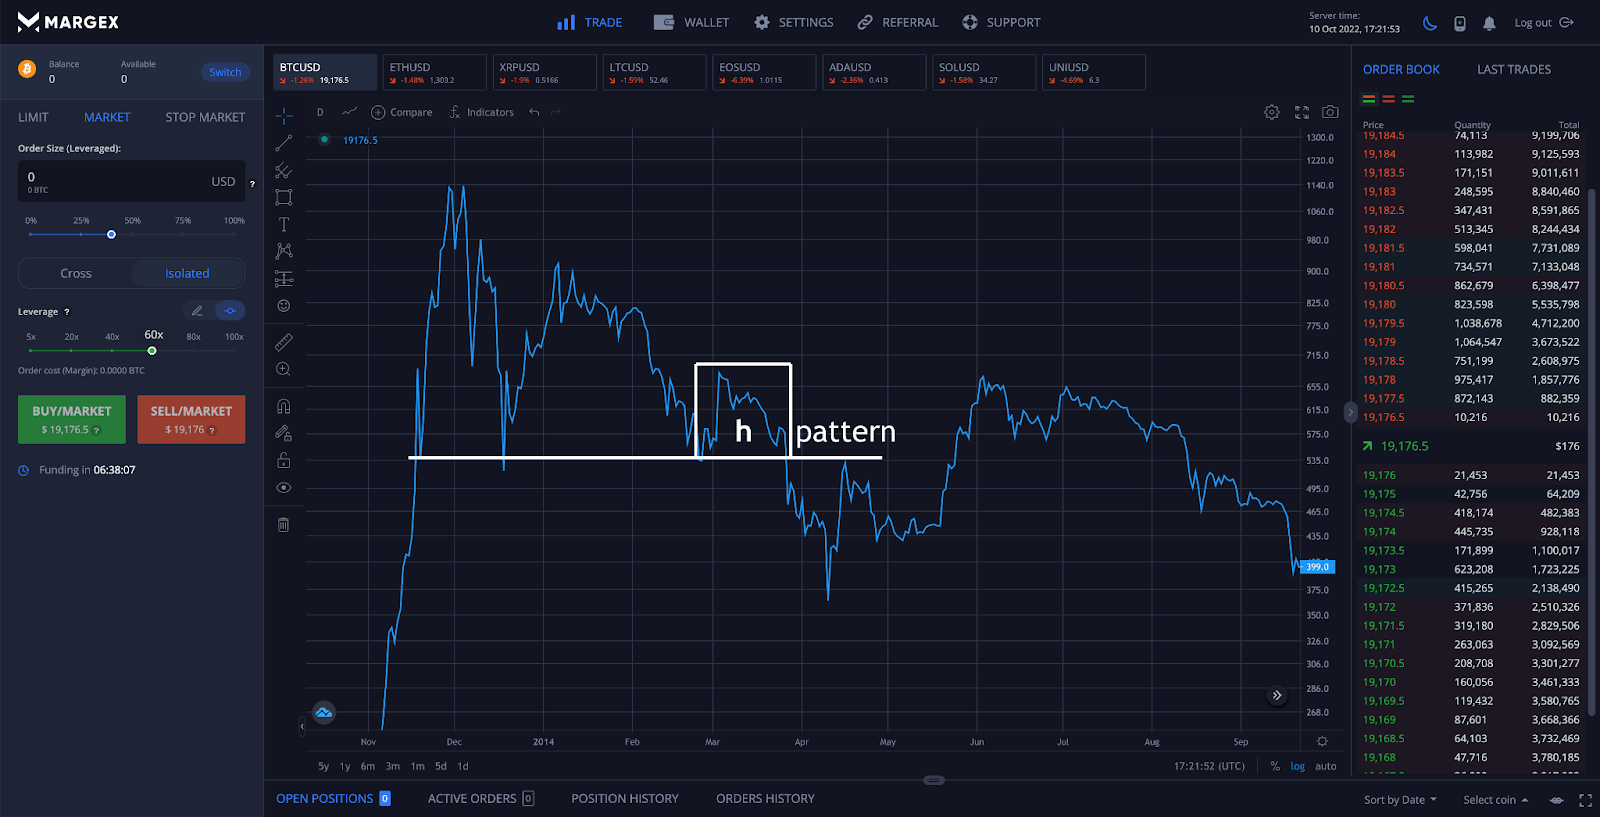
In the daily chart below, Bitcoin price can be seen retesting support that’s been tested a number of times previously and ultimately breaks down with the h pattern to put the final nail in the coffin of that particular bull market.
After Bitcoin finally pushed below that support level. Although price action did rebound, Bitcoin formed a lower high and ultimately fell by another more than 50% to the eventual bottom, proving the setup to be a very profitable trade entry.
Price action never went high enough to stop out traders who placed a stop loss above the top of the h pattern. In the section below, we will walk you through how to make this exact trade.
Inverted H Pattern: The Bullish Counterpart To The Standard H Pattern
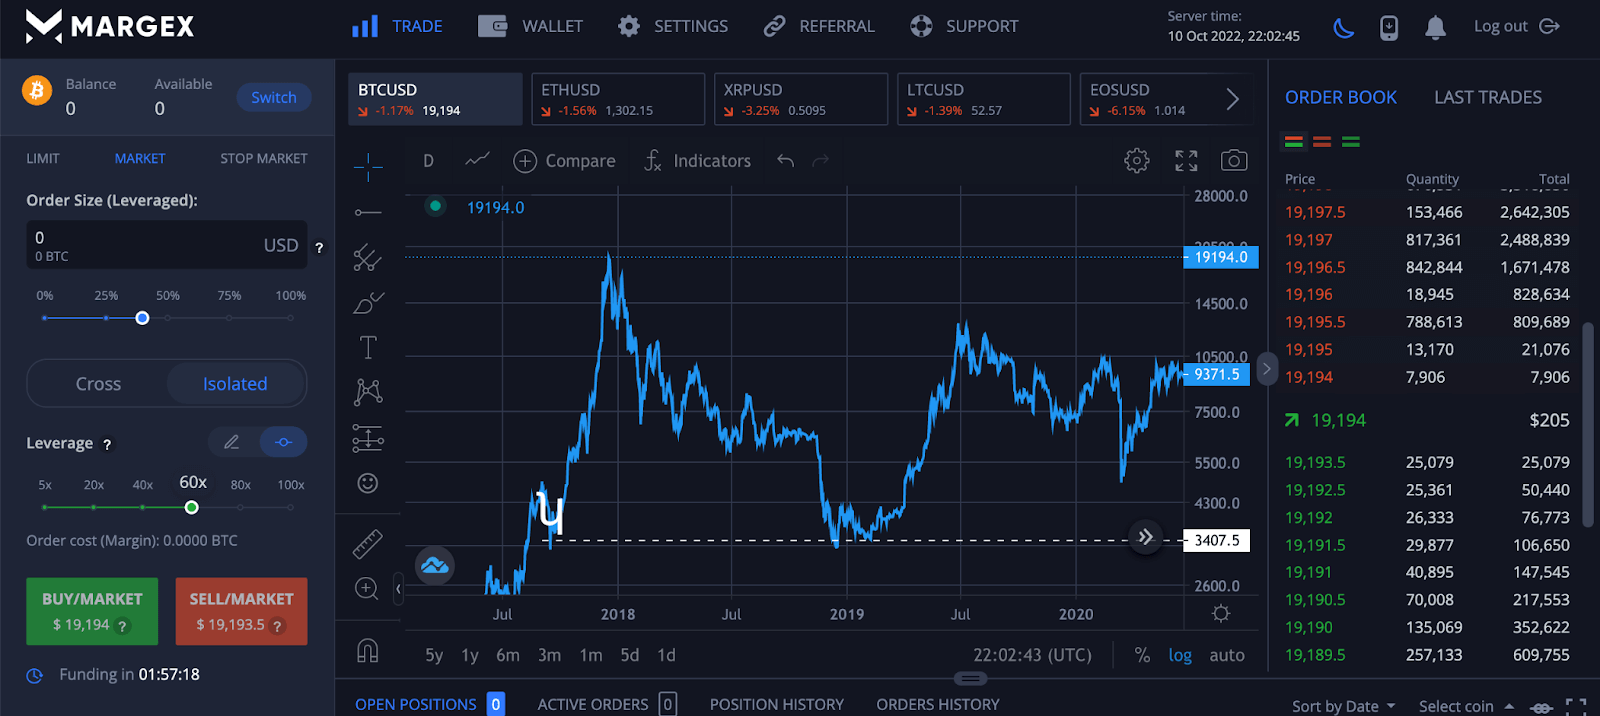
Inverted H patterns can also form, in which the chart pattern appears to resemble an upside-down lowercase H. In this scenario, the pattern starts with a sharp rise to create the first resistance level, which is later broken after meeting a rounded support level.
Example Of The Inverted H Pattern Trading In Crypto Markets
The daily chart of Bitcoin once again is used as an example, this time to show the inverted h pattern that can appear during an uptrend before strong continuation. The support level that caused the rounded part of the h pattern ultimately held as support once again when it was retested during the 2018 bear market bottom.
How To Trade The H Pattern With Margex Margin Trading Tools
The powerful and easy-to-use Margex digital asset margin trading platform offers long and short positions with up to 100x leverage along with built-in charting tools. The platform also includes access to powerful technical indicators like the Relative Strength Index, Bollinger Bands, Ichimoku Cloud, and the Stochastic RSI.
Using the built-in technical analysis tools provided by Margex, the following steps will walk you through trading the h pattern in crypto like a pro:
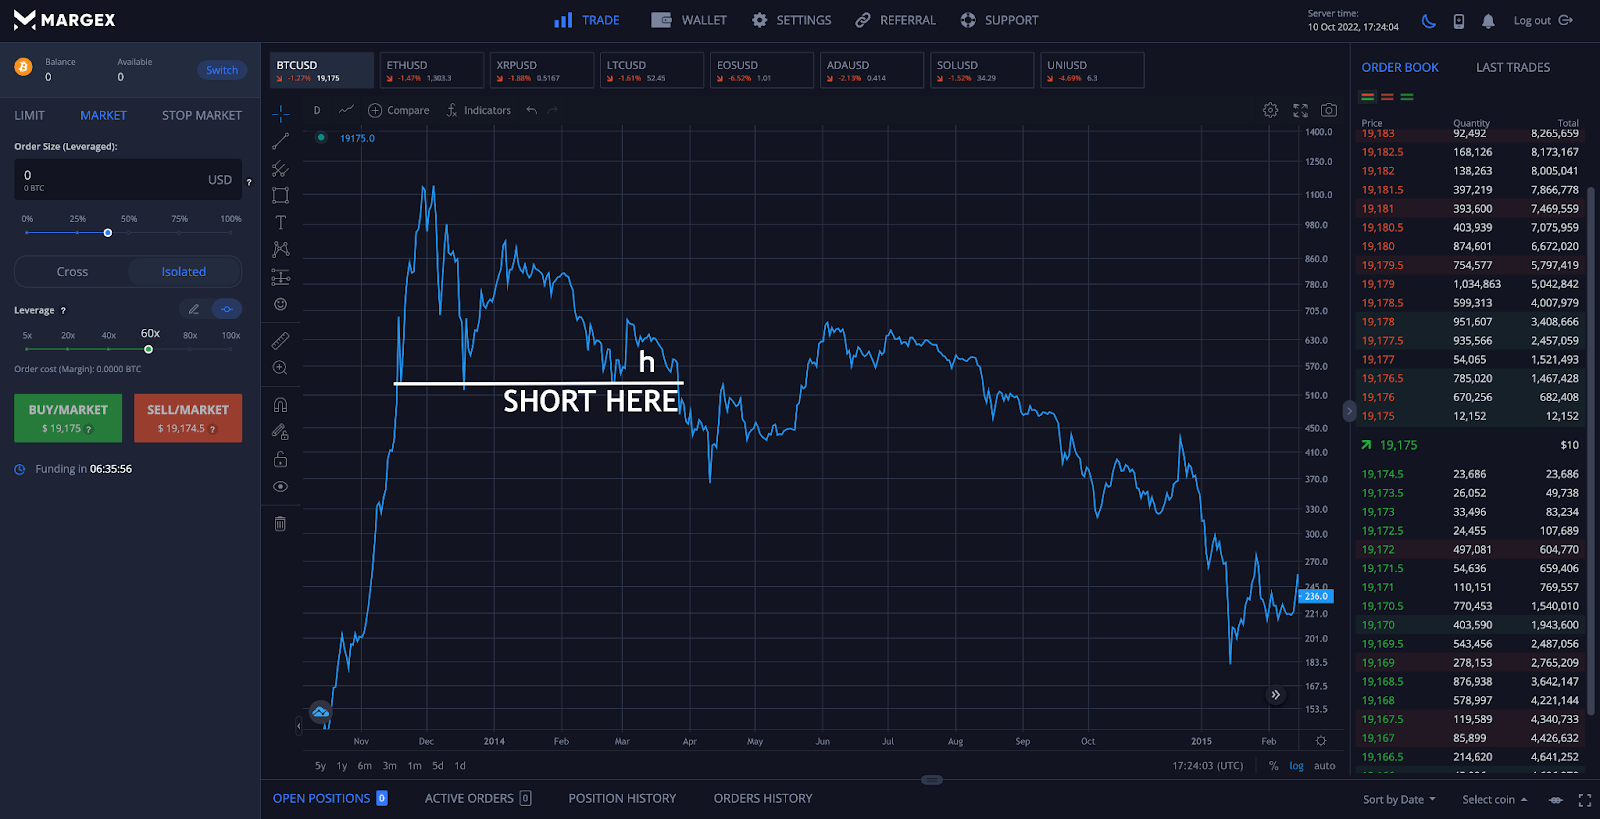
Step 1 – Open up the Bitcoin (BTC) daily chart or another cryptocurrency and scan the market for any h patterns. Use built-in Margex drawing tools to highlight the support level to watch for a breakdown.
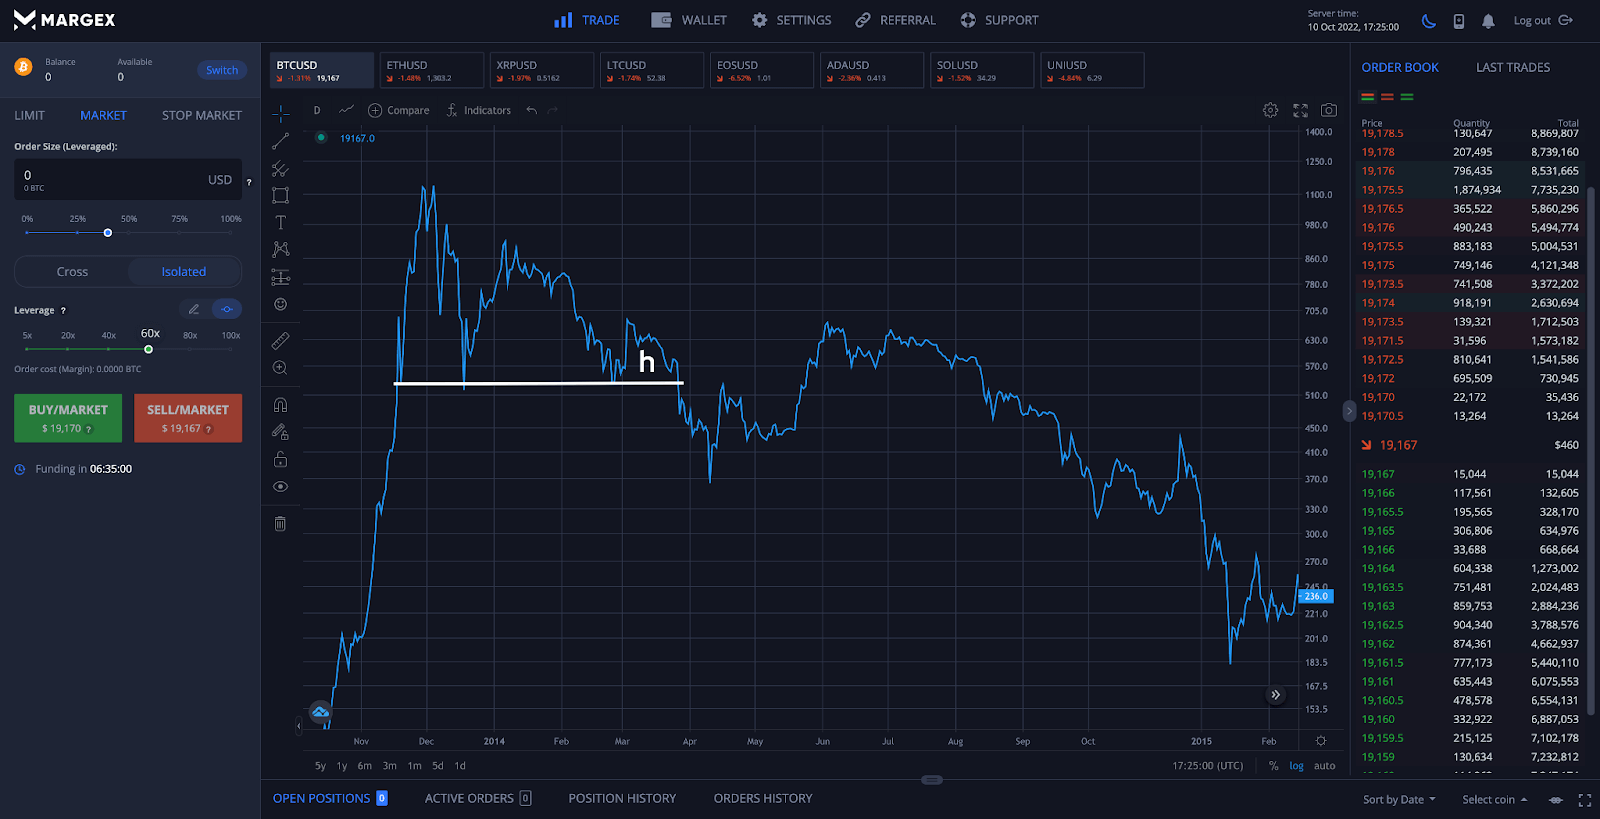
Step 2 – An ideal shorting strategy involves waiting for a breakdown of the support level where the first decline stops at. A riskier trading strategy involves going short at the resistance level where the pattern first begins to round downward/
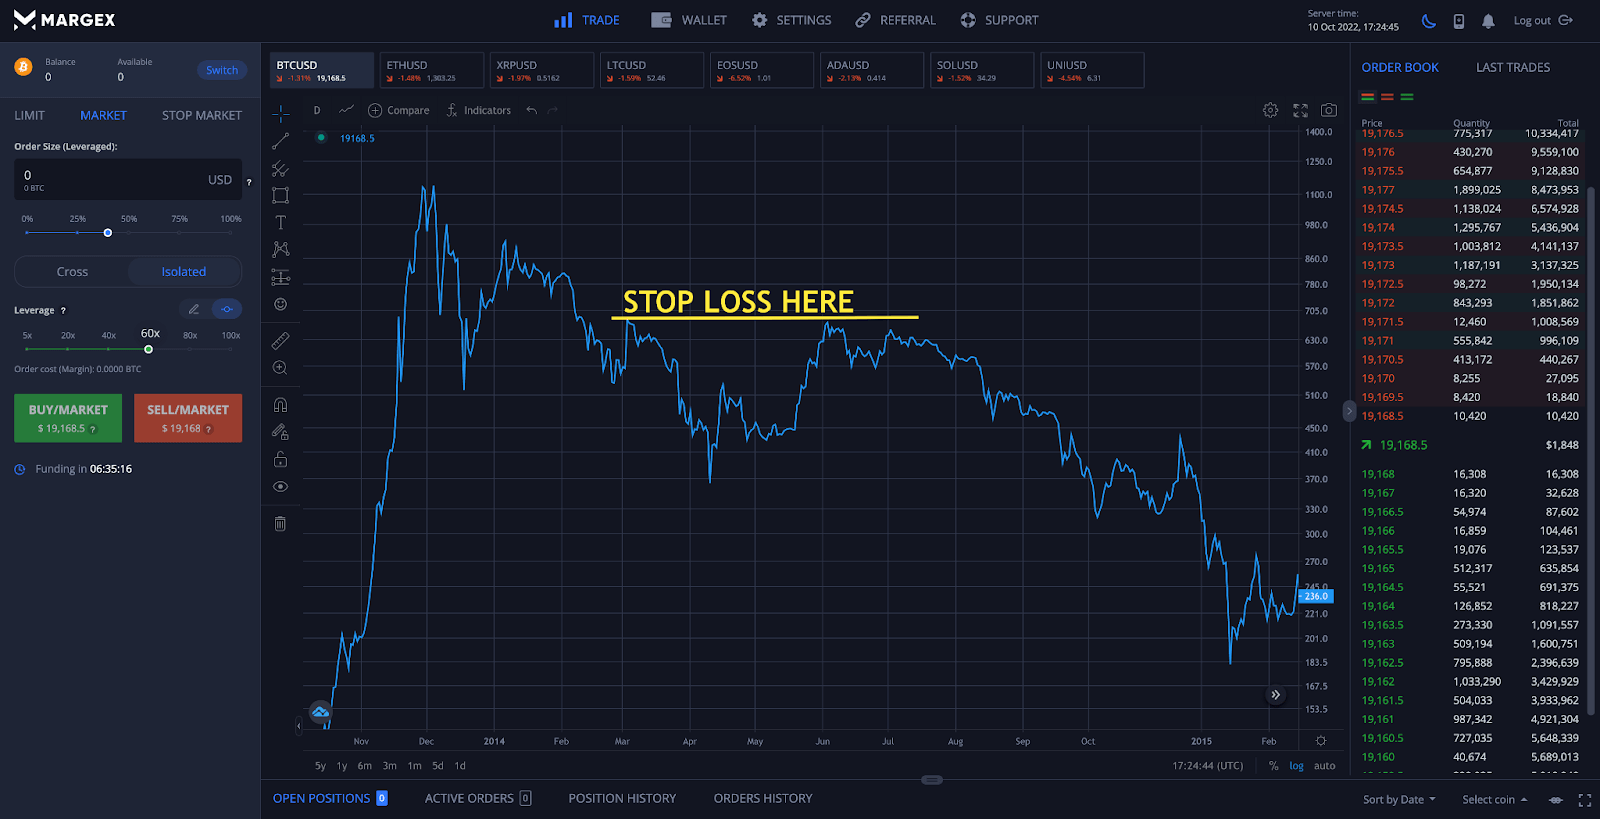
Step 3 – Place a stop loss order above the resistance level formed by the rounding top following the first decline. If price rises beyond this level after returning to retest support, it is likely that support has held and the pattern is not a confirmed h pattern.
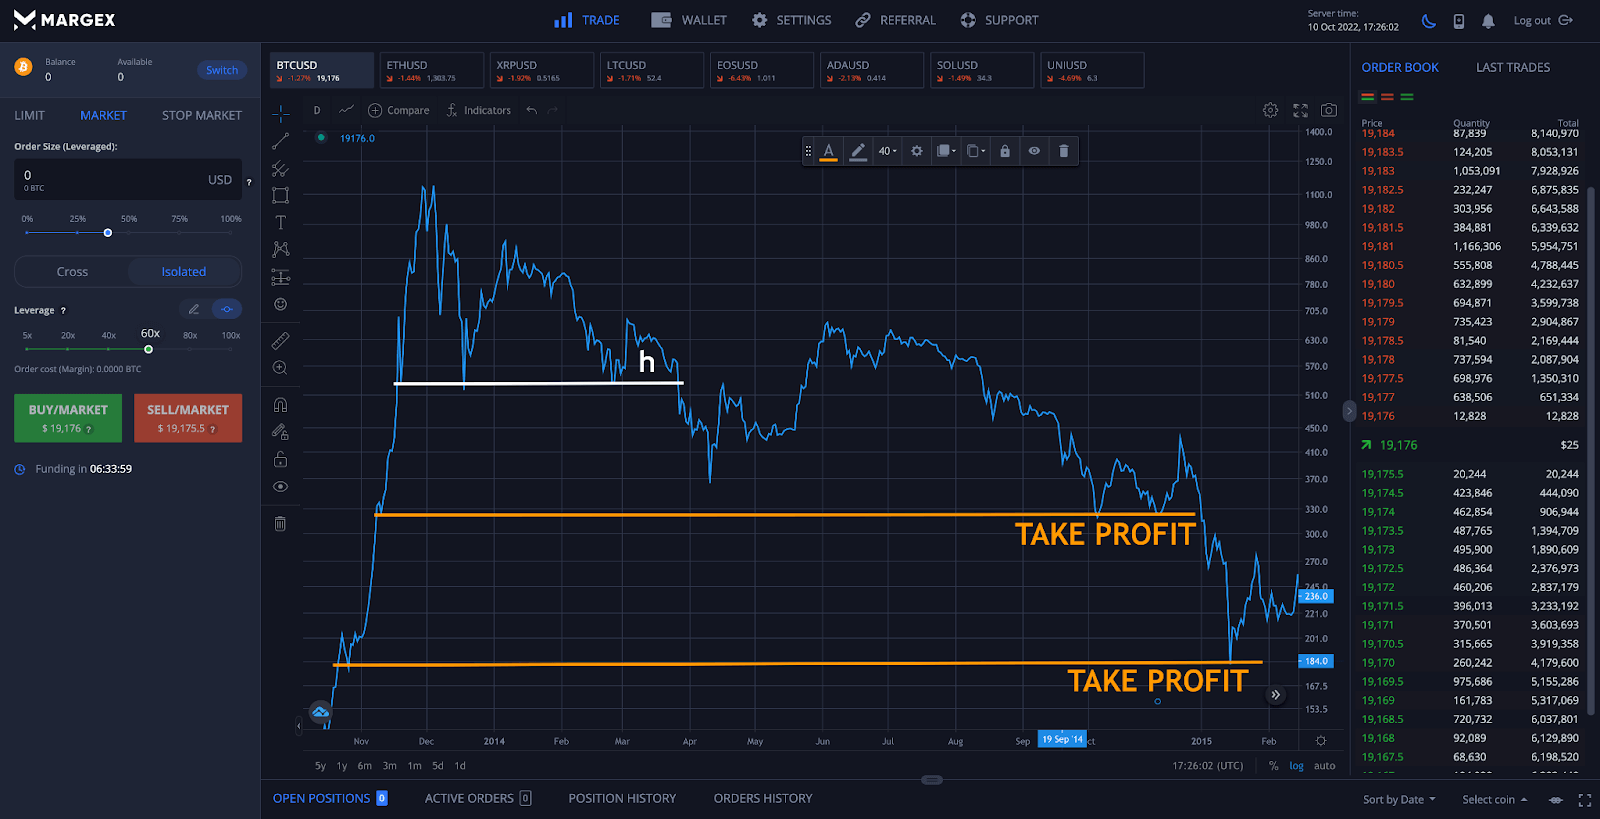
Step 4 – Set profit targets well ahead of the breakdown to ensure you stick to your plan. Take profit at lower support levels or as soon as the trend shows signs of reversing. Congrats, you have effectively traded the h pattern.
Comparing The H Pattern With Other Alphabet Shaped Patterns
The H pattern is from the alphabet-shaped chart patterns, which include W-bottoms, U-bottoms, V-bottoms, M-tops, and more. However, the bulk of these patterns are tops and bottoms, as the names imply. The primary difference between the H pattern and these other shapes, is the fact that the H pattern is a continuation pattern and not a top or bottom like other alphabet shapes.
FAQ
What is an H pattern in crypto trading?
Not to be confused with the H and S pattern, which stands for head and shoulders, the H pattern forms after a dead cat bounce and before strong continuation. It is essentially a short, lowercase h-shaped pit stop in price action before the trend resumes. It can be used as a sell signal or a sign to go short ahead of further downside.
Is an h pattern bullish or bearish?
An h pattern in cryptocurrencies and other markets is typically a bearish chart pattern. However, much like other chart patterns, an inverted h pattern can form which will look like an upside down lowercase H.
How do you find the H pattern on price charts?
The benefit of the H pattern and other alphabet shaped patterns is that they are extremely easy to spot on a price chart. Although these patterns can be simple to find, they don’t always respond the way traders expect. Combining the pattern with a variety of technical indicators can help to confirm the sell signal.