Crypto trading has gained massive popularity in recent years. However, becoming a successful crypto trader largely depends on understanding technical and fundamental analysis. Crypto resistance and support levels are essential tools in every trader’s handbook, so what are they?
Crypto resistance and support levels are levels on a trading chart (price points) that record great buying and selling activity. At support levels, the price of a crypto asset stops falling before a possible rally. At the resistance level, the price of an asset stops rising and hits a “price ceiling," which might signal a downtrend.
In order to identify these price points or levels with ease, technical indicators are used to study and predict these price points. You will understand this concept more below.
Understanding Support And Resistance In Crypto?
Crypto resistance and support levels are important price points for a crypto asset. Support is a price level for crypto trading at which a downtrend stops. This action is due to increased demand from buyers in the market. A drop in the price of a crypto asset will drive the demand up and create a support zone.
Resistance, on the other hand, is a price level where the further rise of a crypto asset's price is restricted. This level is formed due to increased sellers’ interest in the market during an upward trend.
Traders take short positions in the resistance zone and long positions in the support price zone. Sometimes this would require adopting other trading strategies to help confirm if a trader would open a long or short position at support and resistance levels.
For a resistance level to be classified as a resistance zone, more than two points must be touched by a support or resistance line when drawn or there would be more interest at this region with price of an asset making a trend reversal. Support and resistance levels rely on past price history. Traders automatically assume that the price of an asset will either stop rising or falling at these particular levels.
When a resistance or price level is broken, they assume a new role – resistance becomes support and vice versa. This is referred to as polarity in technical language.
What Makes Support and Resistance Occur?
Support and resistance occur mainly due to price action or traders' sentiment regarding the past price movement of an asset.
In every given market structure, three types of traders exist, Those in long positions that want the price to rise, those in short positions hoping for a downtrend, and undecided traders that remain neutral.
Human emotions play a major part in traders’ decisions, with herd instinct, fear, and greed as major determinants. As a result, a given price chart largely reflects the optimism and passim of traders in the market. This influences their decisions to buy or sell, creating crypto resistance and support levels.
Also, traders attach sentimental value to round figures. For instance, if Bitcoin rises to the $20,000 level, many traders will launch a selling frenzy that will create resistance. These round figures are also referred to as emotional price levels.
Most traders go with the trend and general market excitement. This is the reason resistance and support levels repeatedly emerge, too.
Support levels occur when the demand for an asset is higher than the supply, this prevents the price from falling. It implies that there are more buyers than sellers in the market at that particular point in time.
On the other hand, resistance is a product of supply being greater than demand, with more sellers than buyers in the market. Resistance stops the price of an asset from rising.
Support Vs. Resistance: What Differentiates Them?
Price movement
Crypto resistance and support levels differ in price movement. Support hinders the downward movement of an asset's price, while resistance restricts its upward movement.
Demand and supply
Also, supply and demand for support and resistance vary. For support, demand is higher than supply driving the price up, while for resistance, supply is higher than demand. These two levels are significant price points where the price trend might change.
It is key to understand that the demand zone is an area on the chart where the price to buy an asset increases, and more buyers are willing to open a position in this region, driving the price of an asset upwards. In contrast, supply is an area or region where the selling pressure is highest, and traders are willing to sell or let go of an asset. A demand zone can be a support level, while a supply zone can be a resistance level, but this analogy can not be reversed.
Using these parameters to identify support and resistance is key to successful trading. Whenever crypto resistance and support levels are broken, the polarity reverses.
Resistance and support levels are also classified as strong or weak, depending on the frequency of occurrence.
Identifying Support And Resistance Levels In Crypto Prices
Traders can identify crypto support and resistance levels using technical indicators. They include the Moving Average Indicator, Highs and Lows, and Trendline indicator. It is important for traders to use these indicators to prevent significant loss and aim for accuracy.
Moving Average Indicator Technique

Resistance in crypto trading, just like support, can be identified with indicators. Moving average indicators help traders identify long-term and short-term crypto resistance and support levels. In this case we would be using the 8-day and 21-day Exponential Moving Average (EMA) to identify dynamic support and resistance levels that would build your strategies as a better trader. The fast moving average is the 8-day while 21-day EMA is the slow moving average with the fast moving average responding faster to price volatility before the fast moving average. When prices close below the moving averages after a crossover, this signifies a potential change in trend from bullish trend to a bearish trend with the moving averages acting as dynamic resistance for prices.
When prices close above the moving averages this indicate a potential uptrend coils be initiated with the moving averages acting as a dynamic support.
To confirm an uptrend, it would be more profitable to use other technical indicators like the Relative Strength Index (RSI) for better confirmation and confluence before opening a long or short entry position.
Most traders have different strategies and use of moving average values, with others preferring short or longer time frames such as the 10-day, 20-day, 50-day, 100-day, and 200-day ranges. The shorter moving averages are ideal (10-50 days range), while the longer time frames are best for long-term traders.
Always ensure you have good knowledge of trading with these indicators, as they could produce false signals in a highly volatile market or during breaking news.
Using Highs And Lows

Another proven method of identifying support and resistance is using highs and lows on your price chart. Highs are the maximum price an asset attains during an upward trend. Lows are the minimum price an asset reaches in a downtrend.
If the price of the particular asset has recurring lows and highs, those levels are marked as strong support and resistance levels. Highs are lows are marked at specific prize zones in the crypto market.
For instance, this chart shows the highs and lows of a BTCUSD pair forming a channel with prices touching two or more points on the support and resistance line. The price is unable to break past his region forcing the price to form a range-bound price movement. Identifying your highs and lows on a chart is vital to know the right entry and exit points in trades.
The crypto market and other assets like stocks and commodities exhibit similarities in price movement from highs and lows. These price levels on a chart serve as resistance and support zone indicators, especially for new traders.
They help traders understand how to identify support and resistance crypto levels.
Trendline Indicator Technique

Trendlines are key fundamentals of technical analysis in determining the direction of an asset. Some advanced traders and investors trade assets in the financial market with the help of trendlines as they revolve around support and resistance with a high probable result. Trendlines are formed as a result of swing highs and lows of an asset forming higher highs and lower lows.
Understanding the concepts of support and resistance will build your strategies for drawing better trendlines that work. There are basically different trends - uptrend, downtrend, and a rectangle channel.
This indicator bear similarities to the movement on normal price charts. However, trendlines are represented on charts as sloping lines. A trendline will either be drawn to show the support or resistance level on a chart.
To draw a proper trend line, you must focus on two or more significant price points in a particular timeframe. Drawing on the high price points, the trendline will act as a resistance and support line when drawn at the low price points.
Trend lines also help traders identify chart patterns showing price movements, like the ascending triangle formation.
Applying Support And Resistance Levels To Crypto Trading?
There are different methods to trade support and resistance levels for crypto trading. They include range trading and trend line trading, among other strategies. You can apply these strategies on Margex to make profitable trades.
Here is a step-by-step guide on how to trade successfully with resistance and support levels.
Step1: Open The Trade Page On Margex
Go to the Margex home page and click on trade. Sign up if you do not have an account.

Step 2: Select the tool
Next, you click on tools and select the trend line tool to draw your trend lines on your chart.

Step3: Draw the trend line
Draw your trend line and mark your resistance and support levels.

Step 4: Trade
Pay close attention to the prevailing market trend to make a profit. Before entering a long or short position, either at support or resistance, you must confirm your strategies with other technical indicators like RSI and moving averages, as these levels could be broken in an extremely volatile market. If your strategies are confirmed, you can open a long or short position around these levels with your stop loss in place.

The chart above shows that after an uptrend, the price formed a resistance and could not trend higher as the price started a downtrend movement confirmed by RSI, indicating the price entered an oversold region with a potential downtrend imminent.
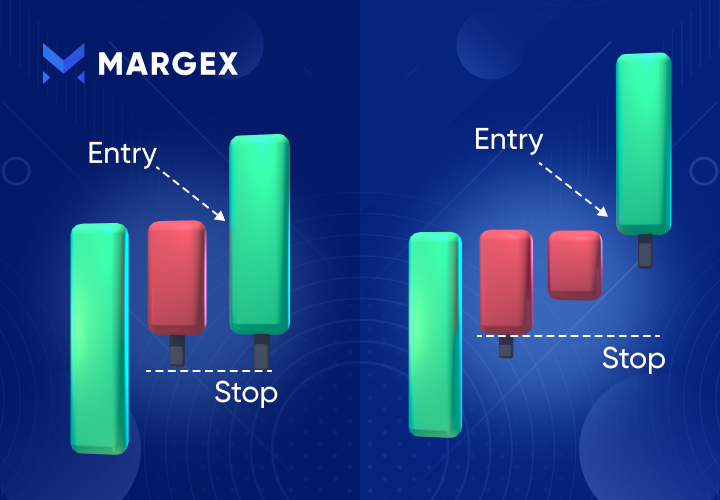
Step 5: Apply the stop loss
When buying near support levels, place the stop loss below the support in the trading range. For the resistance level, place your stop loss above the resistance line.

Step 6: Take Profit
Take profit before the trade hits the opposite direction. If you are trading resistance, take profit before your trade hits support and vice-versa.

Congratulations, you have successfully tried the resistance and support strategy. Always take note of fake-outs, which are false price reversals. Don't get greedy and only risk what you can afford to lose.
FAQ – Common Question Asked About Support And Resistance In Crypto.
The answers below will answer some questions on support and resistance levels in crypto price movements.
What Are Crypto Resistance And Support Levels?
Support is the price level of an asset where it experiences high demand that prevents it from declining. Resistance is the asset’s price level, which restricts further upward movement. Resistance is often accompanied by higher asset supply and lower demand.
Why Do Support And Resistance Occur?
Support occurs due to the high ratio of demand over supply of an asset. At this point, the asset is already scarce in the market, with many buyers pursuing few tokens.
However, resistance happens when there is more supply of an asset than buyers. At the resistance level, the market is flooded with a more circulating asset supply than the number of buyers available.
How Can I Identify Support And Resistance Crypto Levels?
One way to identify support and resistance is by analyzing the highs and lows within a specific period in a price chart. The highs indicate the maximum price point during rallies, while the lows indicate the lowest prices when there is a downward trend. When an asset exhibits the same highs and lows, it indicates a strong support and resistance level.
Another way to identify support and resistance level is through the moving average (MA) indicator. Traders use the moving average indicators to identify long and short-term supports and resistance levels. Short-moving averages like 10, 20, and 50 are suitable for short-term profits, while longer MAs are for long-term investors.
Trend line indicators can also be used to identify resistance and support levels.
Why Does Resistance Occur In Crypto?
Resistance gets formed when there is more supply than demand in the market. The resistance forces the price of the asset down and might likely change the price direction.
Which Is The Best Indicator For Support And Resistance?
The best indicator for support and resistance is down to the personal choice of the trader. Trend line indicators and moving averages are great indicators. They help traders understand how to identify support and resistance crypto levels.
Can A Trader Rely On Support And Resistance For Decisions?
Support and resistance trading strategies are largely successful depending on the trader's skill level. However, every trading strategy is flawed. Therefore, traders should monitor their trades and always apply stop losses.
What Do Traders Call Strong Support And Resistance?
A strong support or resistance level must come in contact with at least two price movements on the chart. A crypto asset's return to that particular level solidifies the resistance or support level.
What Will Happen If Support Lines And Resistance Meet?
When support lines meet with resistance, they associate with the prevailing market trend and can cause a break in the opposite direction. Traders refer to these meeting points as confluence lines.