As a retail trader and investor, you are competing against institutions, whales, and big players in the crypto industry, which can be difficult because these players can easily push you out of the market, especially if you are new to this. It takes more than hodling, buying, and selling crypto assets to become a successful investor and trader in this industry, offering many opportunities to those willing to take a risk.
To stay ahead of the game, trading in financial markets such as cryptocurrency, stocks, indices, and futures requires skills, patience, and psychology. Investors and traders are constantly looking for ways to profit in cryptocurrency by employing various trading strategies and technical analysis tools such as indicators, oscillators, and chart patterns to gain an advantage and remain profitable in bullish and bearish markets.
The crypto market has seen some great evolution over the years, right from the early days of Bitcoin and Ethereum, with traders adapting to the everchanging trends of the industry in other to remain profitable; studies have shown that the crypto market ranges by over 70% of the time while the remaining percentage allows traders to spot trending opportunities.
In this guide, we'll go over one of the harmonic chart patterns traders and investors use to identify trend reversals and position themselves for high rewards when the market turns in its favor. We'd go over how traders use the shark chart pattern in detail, with examples, so you could learn more, make more money in the market, and manage your risk accordingly.
What Are Harmonic Patterns
Harmonic patterns are chart patterns represented by geometry with the help of Fibonacci values to accurately determine pivot points to be traded by technical analysis traders. Gartley laid out the foundations of trading this five-point pattern, Larry established the basic rules of the Fibonacci values, and Carney expanded on the harmonic patterns by adding others like the Crab, Shark, and the Bat pattern.
Harmonic patterns combine graphical and mathematical components to provide traders with more accurate technical analysis tools to predict and forecast price movement, trend reversals, and potential profit targets.
There are different harmonic patterns to be traded as a technical analyst ranging from - Gartley, Shark, Crab, and Butterfly, with all of the harmonic patterns looking almost the same. Let us focus more on the shark harmonic pattern and how to trade them both for a bullish and bearish condition.
What Is The Shark pattern?
The shark pattern is a five-leg trend reversal pattern used by technical analysis traders to spot or identify potential trend reversal from a bearish trend to a bullish trend or from a bullish trend to a bearish trend, as this pattern is validated from the Fibonacci retracement values. This shark pattern sometimes is referred to as the shark harmonic pattern.
The complex nature of the shark pattern makes it stand out from other harmonic chart patterns because it does not mature to the final stage compared to the other harmonic patterns.
In the case of other harmonic chart patterns, the completion point is easily seen as termination at the CD swing leg, but in the case of the shark pattern, the endpoint is found at the BC swing leg. Other harmonic patterns have five points X, A, B, C, and D, while that of the shark pattern is identified as O, X, A, B, and C as this point clearly show the difference in shark pattern when compared with other chart patterns.
Other characteristics you should look out for include shark pattern forming double tops at the B point during an uptrend and double bottoms at the B point during a downtrend. This visual feature can also be used to identify the shark harmonic pattern.
While in an up-trend, the shark pattern will form double tops at the B point, while in a downtrend, it will form a double bottom also at the B point. This is also a visual characteristic that you could use to identify the shark harmonic pattern.
Harmonic Shark Pattern
Thus was first discovered by Scott Carney in 2011; the harmonic shark pattern is a five-leg trend reversal pattern that depends on about 88% of the Fibonacci retracement and 113% reciprocal value. It has an extreme harmonic impulse wave as a result of its chart formation that looks like the letter M for a bullish shark pattern formation and the letter W for a bearish shark pattern formation.
For the harmonic shark pattern formation to be valid, the formation of the harmonic candlestick must meet several Fibonacci ratios to be valid. As a result, aims to predict the price movement of future price swings and price swings with what looks like geometric shapes. The five-swing shark pattern is made up of price points O, X, A, B, and C.
The points on the Shark pattern are five in number (O, X, A, B, and C) and have a strong correlation to Fibonacci ratios and price movement, with the market expected to reverse from point C during its swing wave movement. Let us look at the detailed leg movement of the bullish shark pattern movement below.
OX price leg - the first leg of the structure, the price travels higher from point O to point X with an impulsive move in nature.
XA price leg - this is the second leg within the structure of the movement. After reaching a peak of point X, XA leg retraces to help the price of the initial price movement. This retracement level of XA must be less than 100% of the OX leg.
AB price leg - the AB price leg is the third leg of the structure after price A completes its movement as the price moves higher, forming the AB leg. The price movement of point AB swings higher to a level of point X, thereby moving in an extension of 113% to 161% of the XA swing.
BC price leg - this is the last leg structure that completes the shark pattern starting from point B the price action begins to move slowly and travels to a range low of 161% to 224% of the length of the XA leg with the pattern terminating at point C where an impulsive bullish move is made to the upside of the chart. The inverted form of this structure forms the bearish shark pattern.
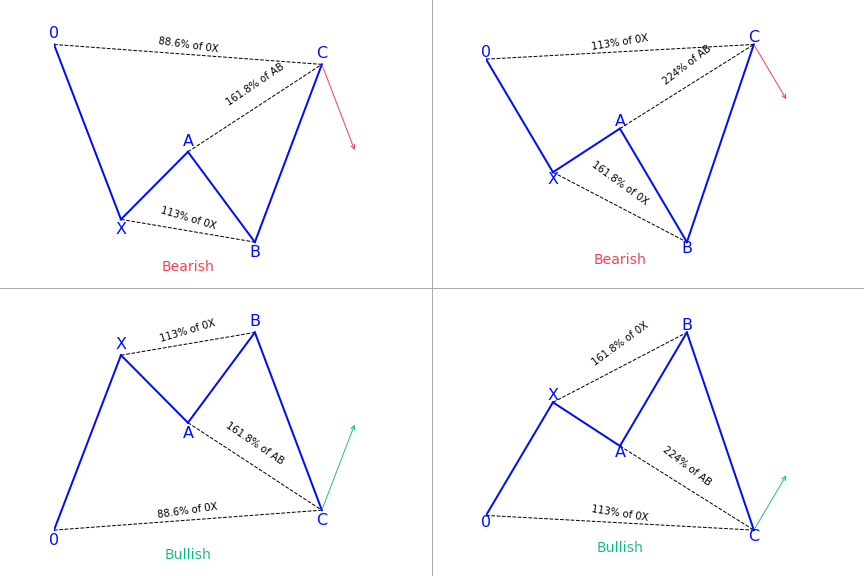
The image above shows a bullish Shark pattern made up of five point structure represented by OXABC with four individual legs that make a pattern, as shown in the image above. The first leg is the OX leg, followed by the XA leg, the AB leg, and the BC leg. According to the image, the OX leg has a higher low, the AB leg has a higher high, and the entire structure has a zigzag structural pattern. The shark pattern formation for a bullish shark pattern forms a letter M structure.
For a bearish Shark pattern, the formation is made up of five point structure represented by OXABC with four individual legs that make a pattern, as shown in the image above. The first leg is the OX leg, followed by the XA leg, the AB leg, and the BC leg. According to the image, the OX leg has a lower high, the AB leg has a lower low, and the entire structure has a zigzag structural pattern. The shark pattern formation for a bearish shark pattern forms a letter W structure.
Bullish Shark Pattern
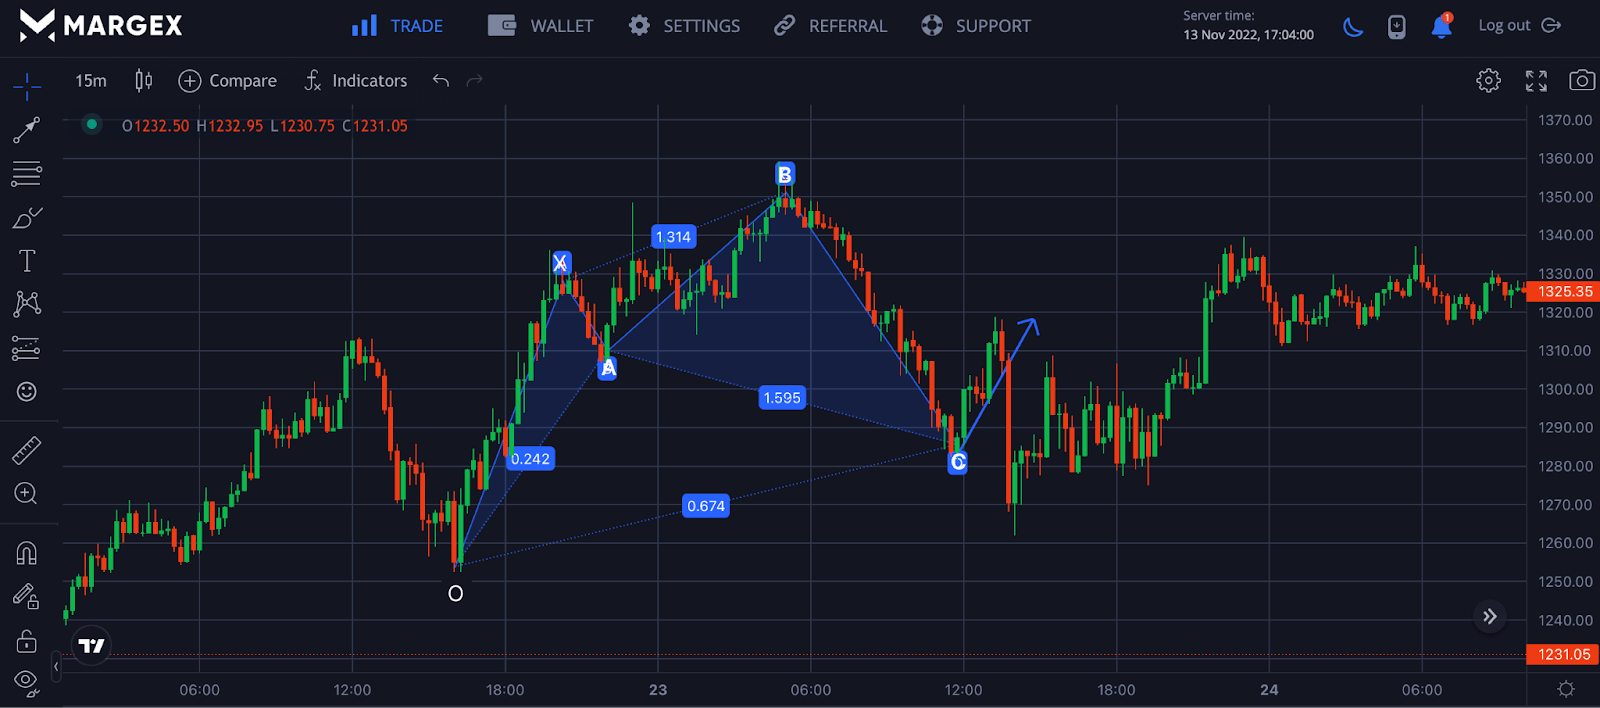
Let us consider the bullish shark pattern price movement with the ETHUSD pair as an example.
OX price leg produces an initial price movement to the upside, making a swing high.
XA price leg is the second leg of the bullish shark pattern structure, which retraces to the initial OX leg but not 100% of the retracement.
AB price leg - this is the third leg that extends beyond the initial price movement of point X. Point B terminates or ends this price movement in the region of 113% to 161%.
BC price leg moves lower to point C, where the structure ends at 161% to 224%.
A trader could look to open a long entry position around this region with stop loss and take profit set to maximize profit while reducing explosion to risk. Different traders have different ways of trading the shark pattern, as there is no universal way of trading this pattern.
Bearish Shark Pattern
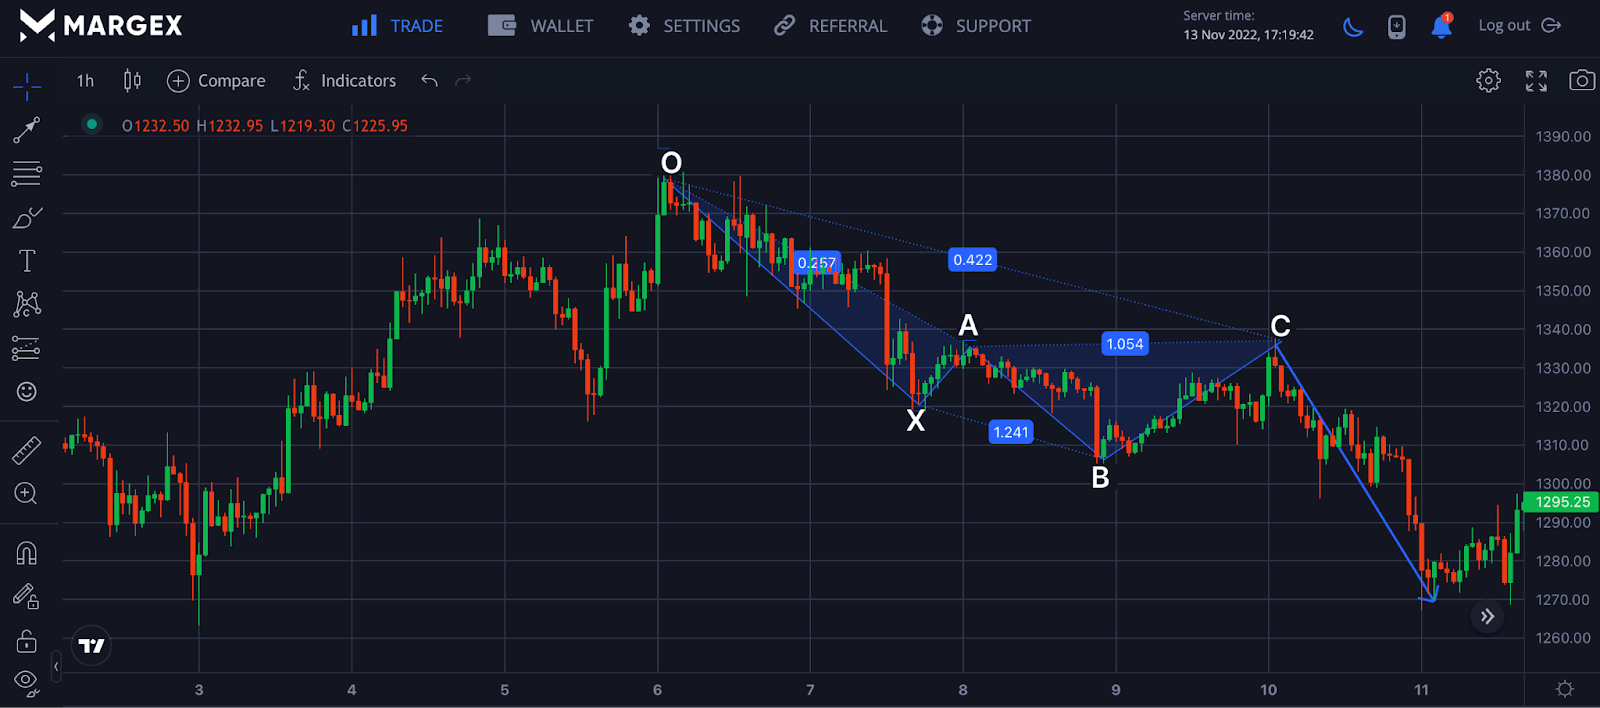
Let us discuss the case of a bearish shark pattern with impulsive movement.
OX price leg produces an initial price movement to the downside, making a swing low to the chart.
XA price leg is the second leg of the bearish shark pattern structure, which retraces to the initial OX leg but not 100% of the retracement.
AB price leg - this is the third leg that extends beyond the initial price movement of point X. Point B terminates or ends this price movement in the region of 113% to 161%.
BC price leg moves higher to point C, where the structure ends at 161% to 224%.
With Fibonacci retracement values correctly mapped out, a trader could speculate the entry point to open a short position for the ETHUSD trade with stop loss and take profit properly defined.
Shark Pattern VS Cypher
The shark pattern and the Cypher pattern look very similar in structure and movement; however, there are slight differences between the two chart patterns. The difference is to help you as a trader have a better probability output when using the chart patterns.
The first difference between the shark pattern and the cypher pattern is the labeling; for the shark pattern, the labeling is OXABC, while for the cypher pattern, the labeling is XABCD.
The second leg of the cypher pattern is within the Fibonacci retracement value of 38 to 61% of its previous leg. In contrast, the shark pattern has no precise Fibonacci retracement value for the second leg point.
Another good distinction between the two patterns within the structure of the shark pattern, the extension falls within the 113% to 161% range while that of the cypher pattern, the third leg falls within 127% to 141%.
Finally, the Shark pattern's terminal point will be at point C, between the 88 and 113% retracement of the initial OX leg, whereas the Cypher pattern's terminal point will be at point D, the 78% retracement.
How To Identify The Shark Harmonic Pattern
To identify the harmonic shark pattern, we need to have a good understanding of its characteristics, as stated above, considering the five-leg swing points of O, X, A, B, and C labeled with the candlestick legs of OX, XA, AB, and BC where point C terminates the structure of the shark pattern.
- The AB leg retraces between 113% and 161.8% of the XA leg's Fibonacci ratio.
- The BC leg extends beyond the O point by 113% of the OX leg's Fibonacci ratio.
- The BC price swing is a 161.8% to 224% extension of the XA wave.
- The length from O to C ranges from 88% to 113%.
- The BC leg is at 50% of the AB leg's Fibonacci retracement level.
You don't need to draw the shark pattern manually, as this would require a lot of time and effort to calculate the Fibonacci ratio and points; you can use this tool freely on the Margex platform to carry out all your technical analysis strategies.
How To Trade Margex Using the Shark Harmonic Candlestick Pattern – Strategies And Examples
Margex is a bitcoin-based derivatives exchange that allows traders to trade with a leverage size of up to 100X and simultaneously stake their tradable assets with the help of Margex's unique staking feature.
Traders can earn up to 13% APY on all staked assets with no lockup periods, as staking rewards are sent to the staking balance on a daily basis.
It is noteworthy that tradable assets on the Margex platform are not exposed to the extreme volatility of shilling crypto assets, making it safe to trade leverage tokens.
Let's focus on how we can execute the shark pattern taking into consideration entry, stop loss and take profit.
Shark Pattern – Find An Entry Point
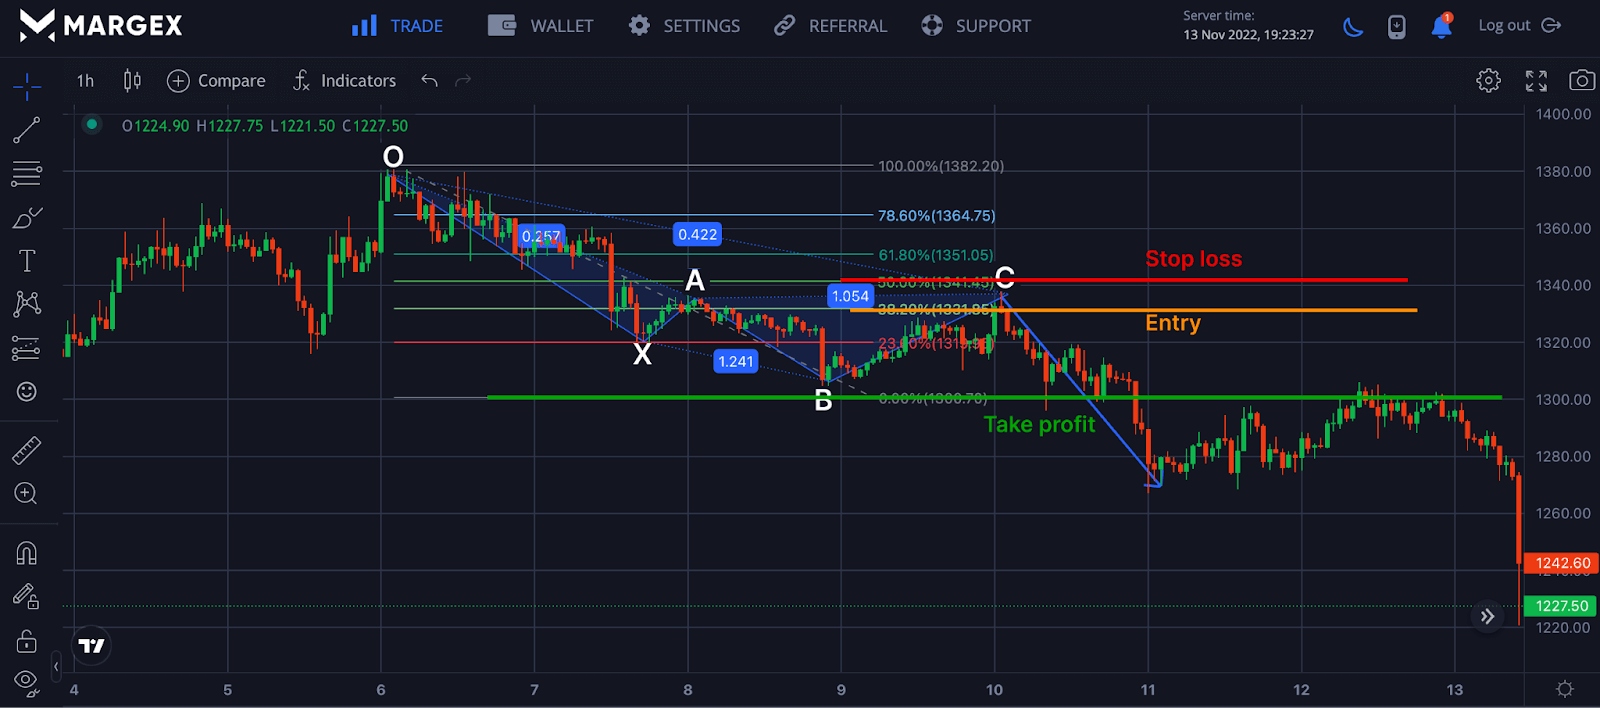
Determining an entry for a trade is the first step to giving you an edge as a trader when to enter a trade. With the help of the shark pattern, we could open a position at point C where the structure completes as soon as the condition for that trade is satisfied.
We could use technical indicators like the MACD or RSI to validate this structure, and the use of Fibonacci retracement value could also be used.
From the image above for the ETHUSD pair, the price got rejected at point C, which corresponds to the 38% of the Fibonacci retracement; a trader could look to open a short position for the breakdown in this setup, confirming a bearish shark pattern.
Shark Pattern – Set A Stop Loss
After determining the entry position of the trade, a trader needs to set a stop loss to reduce and manage risk to a reasonable degree, as using the shark pattern strategy is not 100% accurate and can be exposed to extreme price action as a result of new and other events causing volatility of price thereby producing false signals. Stop loss should be set a few distances from the entry point to manage risk.
Shark Pattern – Set A Take Profit Target
Setting a take profit for a strategy is a good way to stay committed to the trading plan and execution, after setting your entry and stop loss, set your take profit and reduce losing your profits back to the market when prices reverse.
The Shark Harmonic Pattern – Pros And Cons
For every trading strategy, its pros and cons will always be associated with it, no matter how successful the strategy has been.
The pros include a highly accurate chart pattern if the strategies are implemented properly with defined entry, stop loss and take profit targets with a reasonable risk-to-reward ratio potential.
One of the major cons of the shark pattern application is its advanced nature for beginners or novice traders. The lack of proper knowledge and skills to trade this strategy complicates it.
Frequently Asked Questions (FAQ) About How To Use And Trade With Shark Pattern
What’s The Difference Between The Cypher Pattern And The Shark Pattern?
The cypher pattern and the shark pattern are almost identical in structure, but the notable difference its the swing leg and points. The cypher pattern starts at XABCD, while the shark pattern starts at OXABC, where point C completes the structure.
How To Draw The Shark Harmonic Pattern?
It is possible to draw the harmonic shark pattern manually, but this can be tough and complicated, especially for beginners traders; it is best to use the inbuilt shark pattern found on trading exchanges like Margex to apply this tool to your trading.
Is The Shark Harmonic Pattern Bullish Or Bearish?
The shark pattern can either be a bullish or bearish pattern depending on the market trend and where it appears.
What Is Harmonic Trading?
A type of trading in which retail traders rely on market wave movements and their relationship to all Fibonacci ratios. These ratios are then used to develop technical indicators that aid in harmonic trading.
How Reliable Is Harmonic Trading?
Trading with the harmonic pattern is reliable. However, it is not advised to trade this strategy in isolation but with other technical indicators or reliable patterns to increase profitability and reduce risk exposures.
What Type Of Pattern Is The Shark Harmonic Pattern?
The harmonic shark pattern can either be a bullish shark harmonic pattern or a bearish shark harmonic pattern. The bullish shark pattern looks like the letter M while the bearish shark pattern looks like the letter W.

