The study of technical analysis involves analyzing the price charts of cryptocurrencies and other financial instruments to review past market behavior and use the information in an attempt to predict future price movements and forward-looking market behavior.
In addition to looking closely at technical indicators, trading volume, Japanese candlesticks, and more, analysts often pay close attention to the formation of chart patterns. Certain technical chart patterns appear with enough occurrence and frequency that decades of study has yielded remarkably predictable results that can be used to increase the probability of success.
The triple top pattern is an obvious, easy to identify pattern, making it a favorite among traders. The bullish counterpart is called the triple bottom pattern. In addition to teaching you how to identify and how to trade the triple top pattern, the following guide also includes tips for things like proper stop loss placement and how to measure the pattern to project potential profit targets.
What Is The Triple Top Chart Pattern? Triple Tops Explained
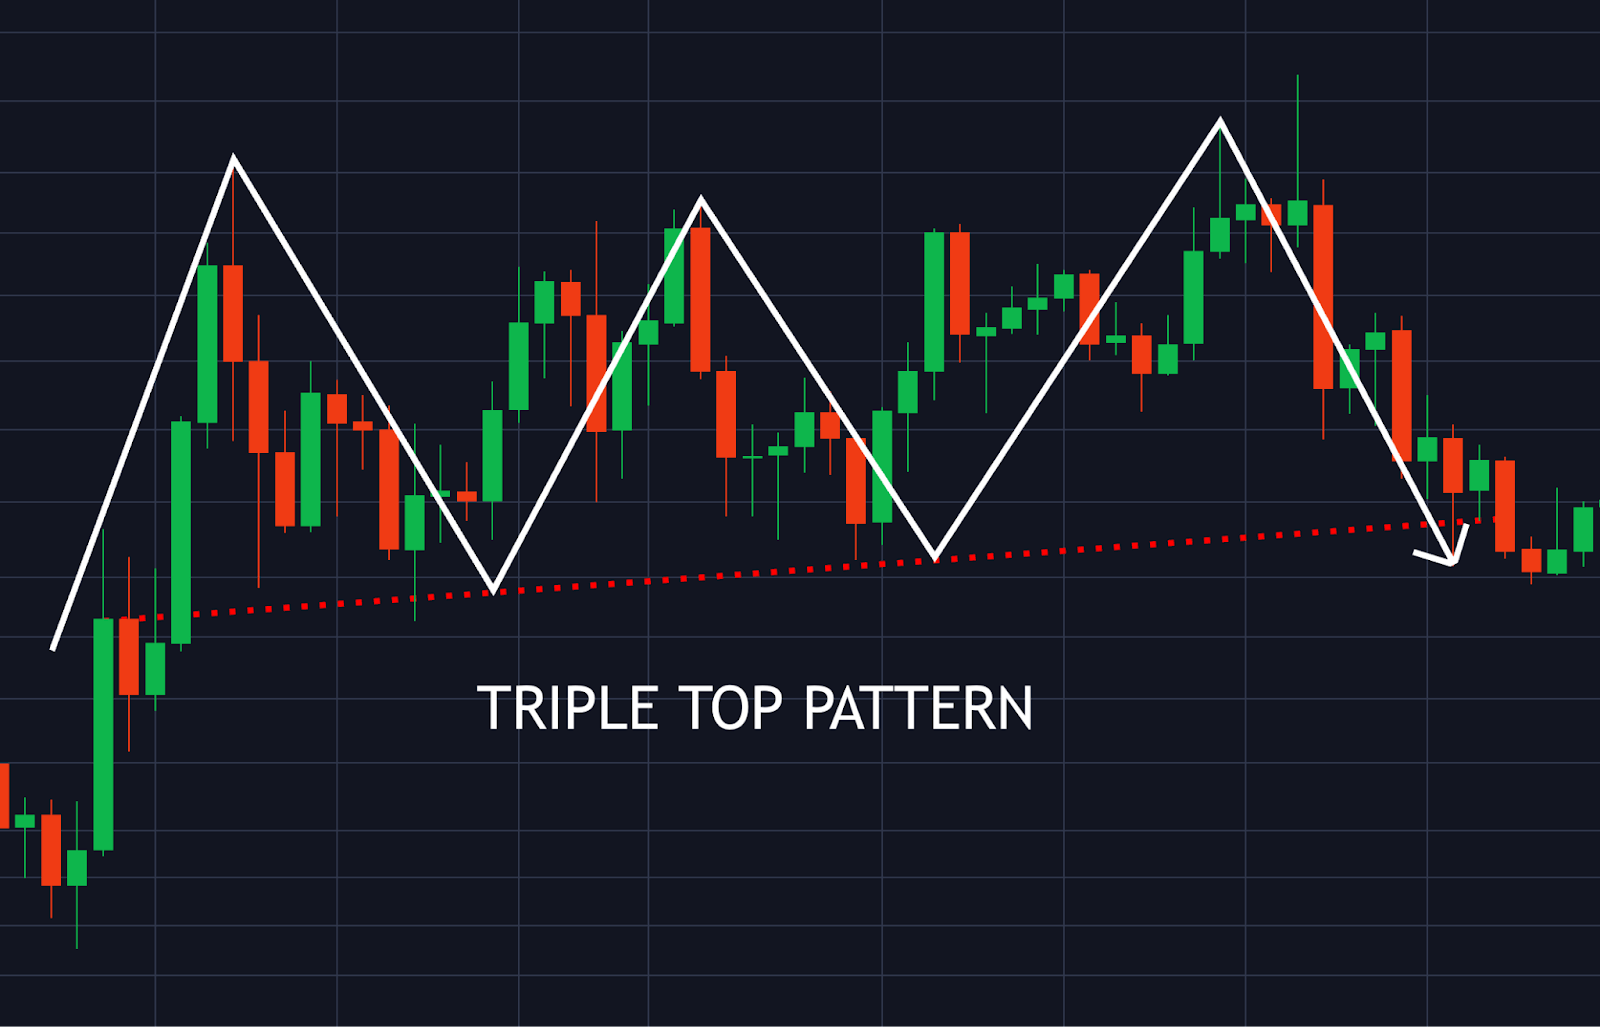
The triple top pattern is a classic charting pattern consisting of three consecutive market tops of roughly the same height. Occasionally, the second peak can be the lowest in the formation. Each subsequent peak is rejected back down to retest neckline support. The pattern represents a tug-of-war between buyers and sellers.
A trend line is drawn between each retest of the neckline with each touch to highlight support. After multiple attempts failing to break out of the same level, prices retrace back to the low of the buildup.
Once the low of the consolidation is taken out and a trend direction change confirms with a breakdown of neckline support, a large price movement follows to a target roughly the same distance as the height of the pattern’s peak to its neckline. We’ll explain how to find the profit target of a triple top later in the guide. The resulting correction in the opposite direction can erase the previous uptrend.
How To Identify A Perfect Triple Top Pattern? Triple Top Chart Pattern Guidelines
Triple tops are a straightforward pattern that can appear across any timeframe and their appearance, when valid, always causes a trend to reverse once the tug-of-war between buying pressure and selling pressure breaks. Volume trends down during the development of the pattern but increases after a break of neckline support.
The first high forms when price meets powerful horizontal resistance. The first pullback creates an area of support referred to as the neckline. The market makes another failed attempt to continue the bull rally, forming the second top and another visit to support. The second top can occasionally be the lowest of the three tops.
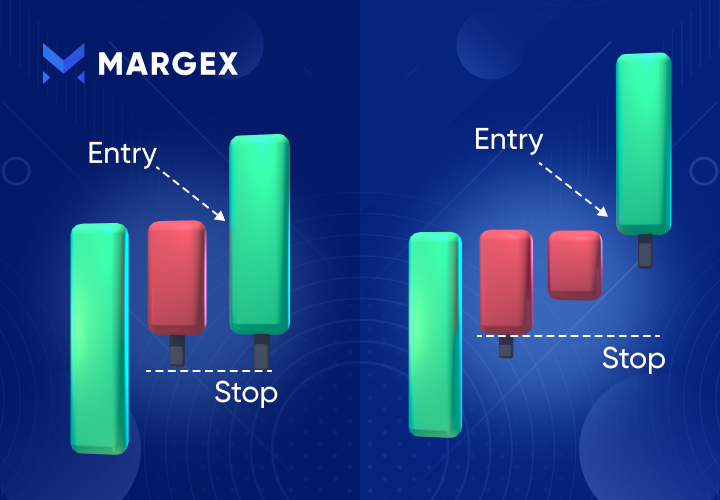
After a third top, the failure to advance becomes clear to the market. The low risk versus reward trading setup presents a higher probability of success. A logical entry technique involves shorting after the next candle close below the neckline. Alternatively, traders can activate a short trade at the breakout re-test, although a throwback to confirm support turned resistance is not guaranteed.
What Does A Triple Top Chart Pattern Tell The Crypto Market? All About The Bearish Reversal Chart Pattern
The triple top pattern warns of weakness in the prevailing trend that leads to a trend reversal. This makes the triple top pattern, much like the name implies, a topping pattern and bearish reversal pattern.
Once the pattern confirms a large price movement forms as sellers chase the move down and longs who took a position at the neckline begin to cover.
How To Find A Triple Top Chart Pattern Target? The Measure Rule Explained
Part of the reason investors, crypto traders, and market analysts look for chart patterns like the triple top pattern, is because they can produce reliable results when the pattern is confirmed. This makes it possible to find a favorable risk-reward setup that can lead to a profitable trade.
Chart pattern targets can be found using the measure rule. For the triple top pattern, finding the potential price target can be done by measuring the distance between the highest peak and the lowest valley of the neckline.
Next, take that amount and multiply it by 49% (the measured objective target) and subtract the difference from the distance between the highest top and the neckline. Project the results below the point where price breaks down from the neckline to find the possible price target.
Triple Top Trading Limitations: What You Need To Know About Pattern Failure
When a triple top pattern fails, a large move in the direction of the prevailing trend eventually continues after a third retest of support, stopping out to traders who went short throughout each of the three tops.
It is important to wait for a candle close below neckline support and confirmation with high volume to avoid a false break. Traders can improve the probability of success by looking for supporting bearish signals in trading indicators such as oversold conditions or a bearish divergence.
According to Thomas Bulkowski of ThePatternSite, the performance isn’t great and has a high rate of failure, making the pattern difficult to profit from reliably.
Triple Bottom Pattern: All About The Bullish Reversal Counterpart
Much like triple top patterns, triple bottom patterns are an easy-to-identify pattern that can appear across any timeframe.
The first low forms when price meets powerful demand and horizontal support. The first rally creates an area of resistance referred to as the neckline. The market makes another failed attempt and second trough, followed by another visit to resistance.
After a third low, the failure to advance becomes clear to the market. The low risk versus reward trading setup presents a higher probability of success.
The triple bottom pattern indicates weakness in the prevailing downtrend that leads to a trend reversal. This makes the triple bottom pattern, much like the name implies, a bottoming pattern and bullish reversal pattern.
Once the pattern confirms a large price movement forms as buyers chase the move up and shorts who took a position at the neckline begin to cover.
Triple Top Patterns Versus Head And Shoulders Patterns
The head and shoulders pattern is another common trend reversal chart pattern that traders mistake for the triple top pattern. Much like the triple top chart pattern, the head and shoulders is characterized as having three peaks, with the middle peak the largest to resemble the appearance of a head and two shoulders. The pattern is confirmed when price breaks down from the right shoulder through neckline support.
The biggest difference between the head and shoulders and the triple top pattern is that in the head and shoulders pattern each shoulder is lower than the head, while in the triple top each peak is roughly the same. The reverse is true for a triple bottom pattern versus an inverse head and shoulders pattern.
Triple Top Patterns Versus Double Top Patterns
Double tops are already deceiving patterns, tricking traders into thinking the rally will continue yet a second high forms. By comparison, a triple top is much more confusing.
Traders who expect the double top pattern to break down are taken by surprise when prices rally for a third time. A failed double top is significant, which could lure in a large number of positions.
When the third top forms, traders on both sides of the trading range are left confused. Ultimately, the triple top pattern breaks down and takes out all the positions formed at neckline support.
How To Trade The Triple Top Chart Pattern With Margex Trading Tools: A Step-By-Step Guide
Picking the right platform to trade at is necessary to success. The innovative Margex margin trading platform offers built-in technical analysis tools from TradingView to help traders scan for triple tops or other chart patterns and react accordingly. The platform also includes access to powerful technical indicators like the Relative Strength Index, Bollinger Bands, Ichimoku Cloud, and the MACD.
Follow these 4 simple steps to triple top trading using Margex trading tools.
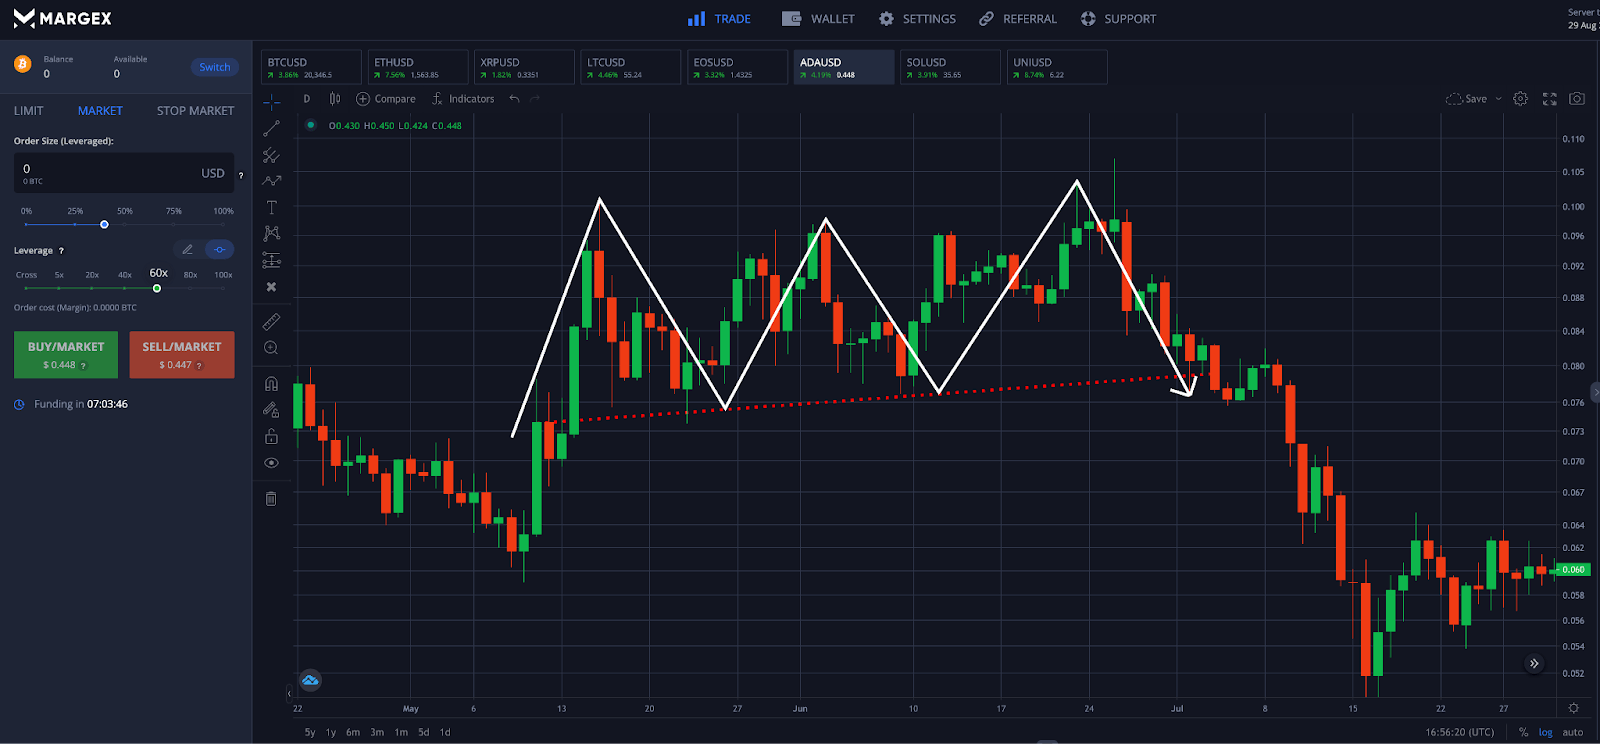
Step 1 - Open the Bitcoin (BTC) chart, and scan the price action for any triple top pattern at the peak of an uptrend. Look for supporting bearish reversal signals.
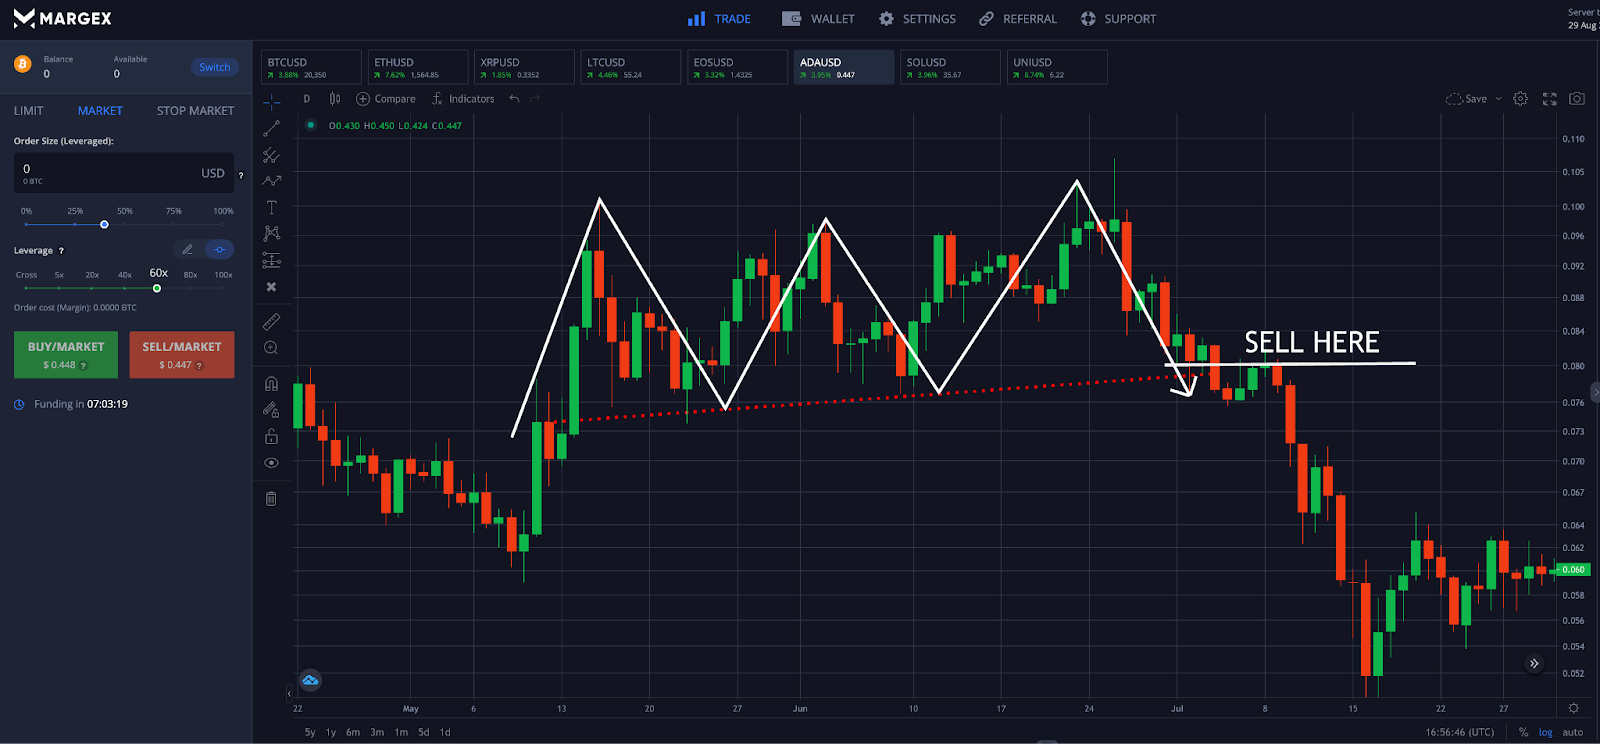
Step 2 - After finding the pattern according to the above image, patiently wait for a breakdown of support before taking a position. The pattern is valid once price moves below the neckline. At this point, place a sell order or open a short position.
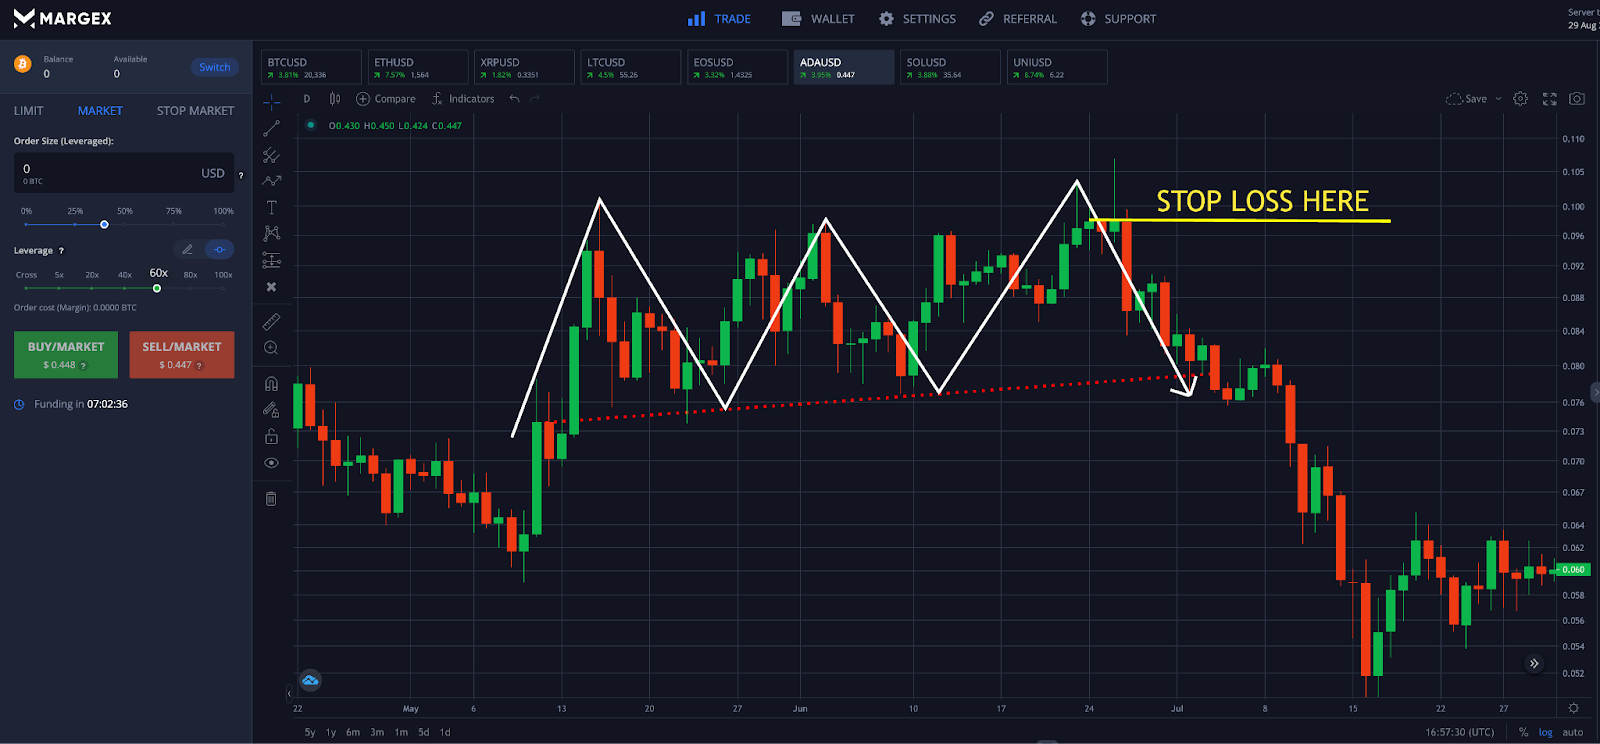
Step 3 - Place a stop loss order above the highest peak of the triple top pattern to prevent against loss in case the market moves against your position and the triple top is invalid.
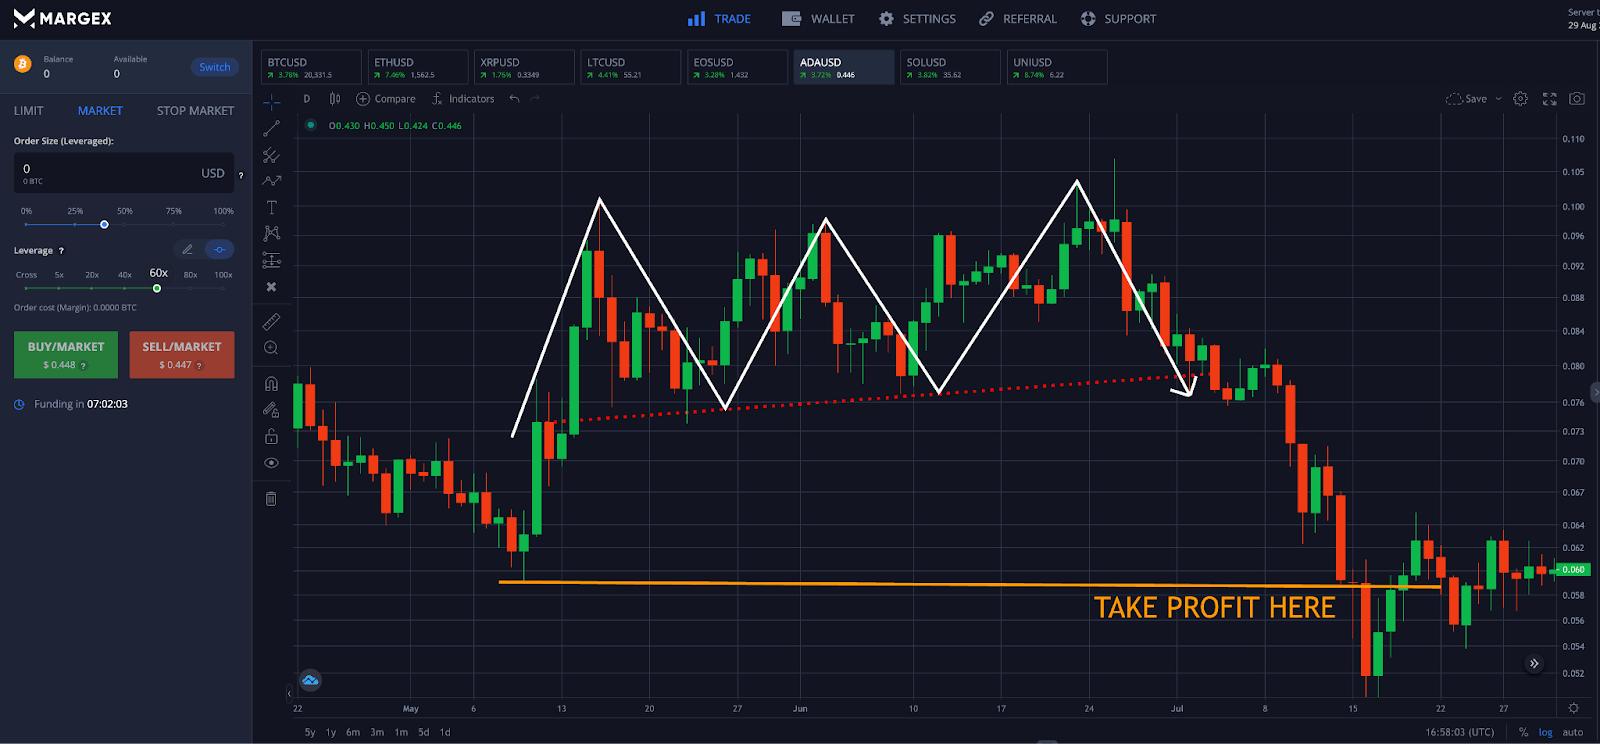
Step 4 - Plan ahead to take profit-taking at key support zones, based on previous price action or Fibonacci retracement levels. You can also project a target of the pattern using the measure rule taken from the neckline to the high of the pattern and projected from the point of breakout. Congratulations, you have traded a triple top chart pattern!
FAQ
The triple top pattern is a somewhat rare chart pattern, but because of its close resemblance to other chart patterns like the head and shoulders, there are often lingering questions that newcomers might have.
As such, we have prepared this triple top chart pattern crypto trading FAQ:
What is the triple top pattern meaning?
A triple top pattern tells the crypto market that a price could not get through resistance after multiple failed attempts, and the trend is going to reverse to the downside. This makes the triple top pattern a bearish reversal chart pattern.
Is a triple top bullish? Are triple tops bearish?
A triple top is always bearish. However, there is a bullish counterpart called the triple bottom pattern, which we’ve outlined in this guide in addition to providing a detailed breakdown of the triple top pattern.
What is a triple top breakout?
A triple top breakout is more of a breakdown from support than a breakout. Prices break down after a candlestick close below the neckline support level they held up the pattern the entire time. The breakdown is usually powerful due to how much trading activity takes place within the pattern.
What is a triple top candlestick pattern?
A triple top candlestick pattern is a bearish reversal pattern that forms at the top of an uptrend and consists of three roughly equal sized peaks. The pattern is confirmed with a breakdown of the neckline on high volume indicating strong participation, position covering, and orders being stopped out.