It has always been a challenge reading the intentions and actions of humans, but in this case, the thoughts of fellow traders and investors to stay profitable and have the edge over the market. Retailers and small traders have struggled in this industry due to a lack of knowledge and the necessary skills to compete and challenge other traders.
It takes more than hodling, buying, and selling crypto assets to become a successful investor and trader in this industry. The industry continues to provide many opportunities to those willing to take a risk and stay consistent in their strategies.
Trading in financial markets such as cryptocurrency, stocks, indices, and futures requires skills, patience, and psychology to stay ahead of the game. Investors and traders are constantly looking for new ways to profit in cryptocurrency by utilizing various trading strategies and technical analysis tools such as indicators, oscillators, and chart patterns to gain an advantage and remain profitable in both bullish and bearish markets.
The crypto market has evolved significantly over the years, beginning with the early days of Bitcoin and Ethereum, with traders adapting to the industry's ever-changing trends in order to remain profitable; studies have shown that the crypto market ranges by more than 70% of the time, with the remaining percentage allowing traders to spot trending opportunities.
In this guide, we'll go over one of the many ways most traders use to spot trend reversals and position themselves for high rewards when the market turns in its favor. We'd discuss extensively how to trade with the hanging man pattern and how we can combine it with other strategies for better confluence.
What Is A Hanging Man Candlestick Pattern?
The hanging man candle is a bearish candlestick pattern that usually appears at the end of an uptrend or bullish trend, signaling to the trader a potential end to the uptrend with a downtrend or bearish trend reversal imminent. After a good bullish trend, the appearance of this hanging man candlestick pattern tells the trader that the bullish trend is losing steam and a change in trend could be setting in.
The hanging man candlestick pattern is a warning sign to buyers who are planning to hold their positions for some time, helping them manage their risk accordingly. On the contrary, the hanging man candle appearance allows the sellers to prepare for a short position on confirmation with other strategies or technical indicators.
The hanging man candle has become a key part of a bearish trend reversal for most technical analysts who want to trade this pattern. The price action can be very effective when this candlestick pattern is identified properly.
The hanging man candlestick pattern is similar to other candlestick patterns like a hammer, Doji, and shooting star. As the name implies, the hanging man appears at the top of an uptrend, signaling a bearish price reversal.
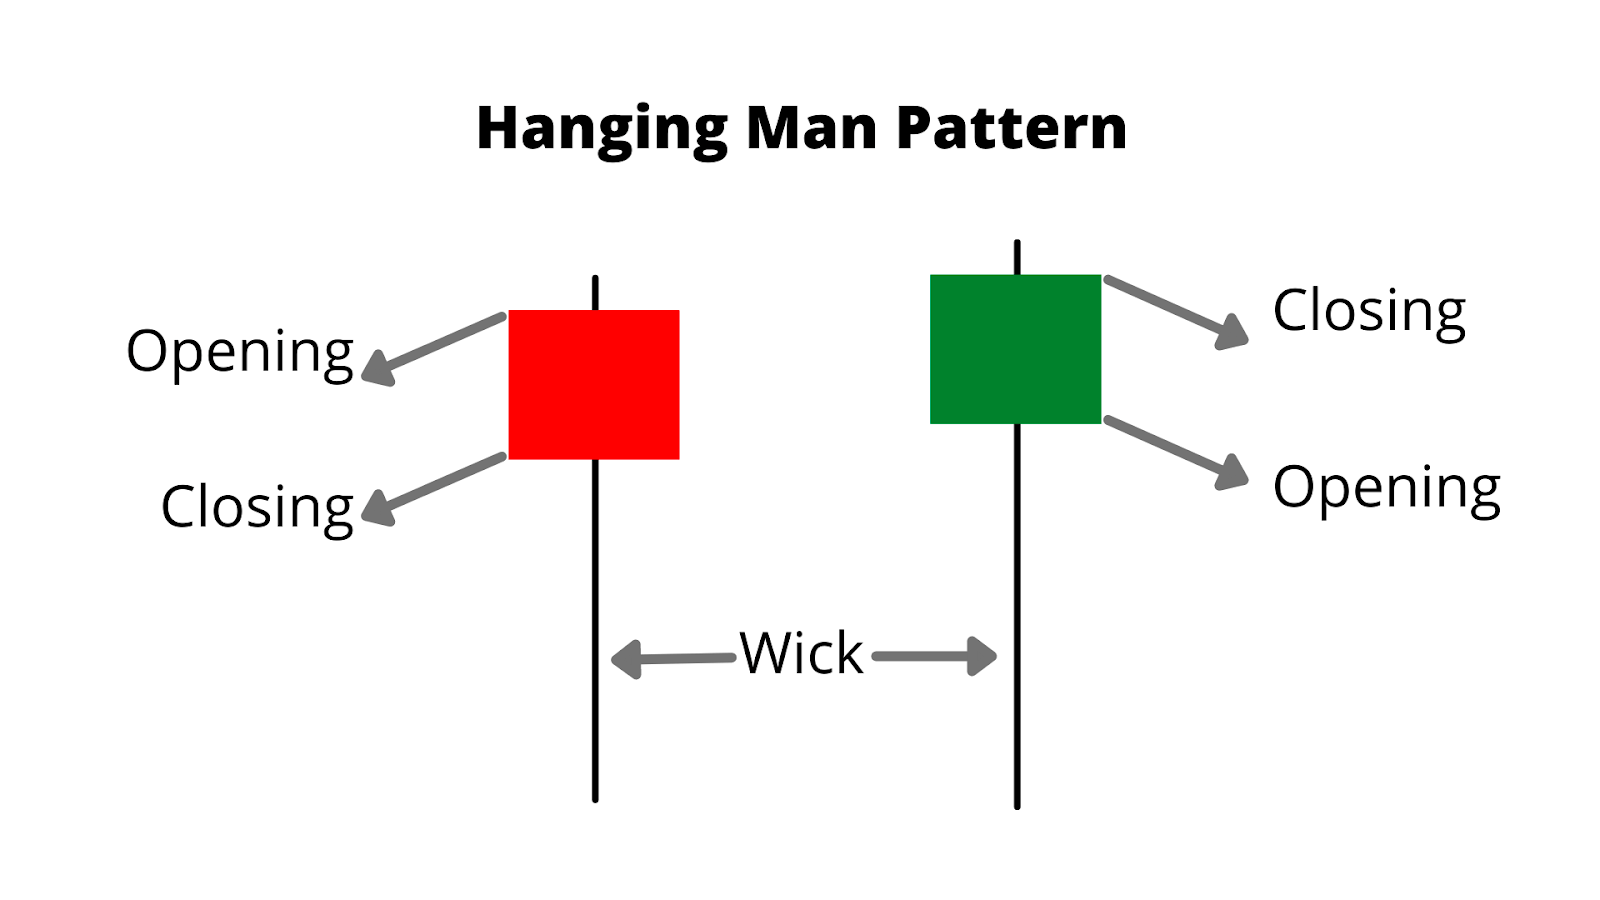
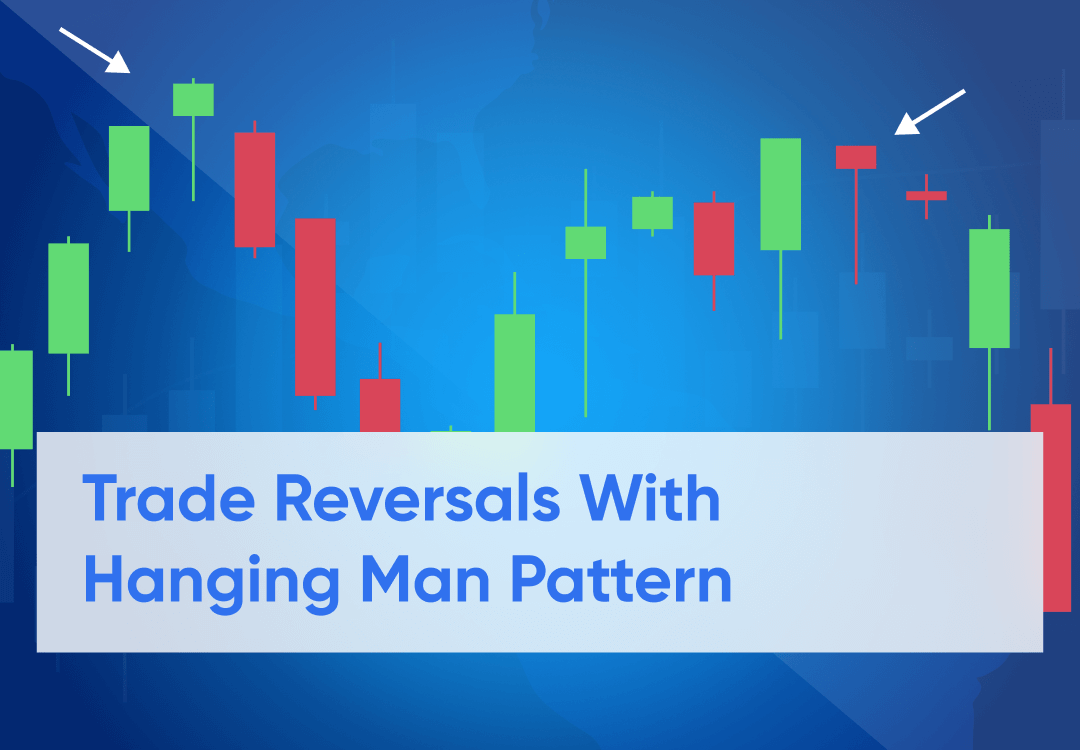
The hanging man candle is a single reversal candlestick pattern made up of candles with small real bodies and long bottom wicks or shadows, the size of the shadow size is not very important, but the body size plays a key role. The hanging man candlestick pattern is another type of spinning top candlestick pattern. The spinning top with a long bottom wick or shadows and little or no upper wick appearing at the end or top of an uptrend makes what we call the hanging man candle pattern.
The hanging man candle is similar to the hammer pattern when it comes to its opening and closing price, with a long bottom wick accompanying it with a wick or shadow as long as twice the body size.
Technical analysis traders familiar with trading price action will understand this pattern as the hanging man has a long bearish wick indicating more sell or bearish signals are being generated. The hanging man candle pattern can be a bullish or bearish candle and does not provide a sell signal; it only gives the trader an idea of sell pressure and a potential change in trend to a downtrend. For better confirmation, technical indicators such as the Relative Strength Index (RSI) are used to confirm this trend change.
How Does The Hanging Man Correlate To Trend Reversal
Trend trading is one of the most profitable techniques that technical analysts employ when trading crypto assets in the market. This gives them an edge with reduced risk as to the direction of the market. A trend is formed when institutions and big investors participate in the market, forcing the market to go in a particular direction that favors them, with prices moving in a swing high or swing low direction due to price action.
Trend reversal occurs when the price of an asset experiences more buy or sell pressure from an opposing party forcing a change in price direction. The most important part of a trend reversal is the volatility that comes from this price action leading to swing lows and swing highs for either buyers or sellers. The swing price trend is counter-traded by the appearance of the hanging man candle forcing an uptrend to reverse to a downtrend as sellers take control of the market due to high sell pressure.
How To Spot A Hanging Man Pattern (Show Examples From Margex)
Margex is a bitcoin-based derivatives exchange that allows users to trade crypto assets and stake them simultaneously, making it possible for traders to earn with its unique staking feature that allows traders to trade with staked assets simultaneously.
Margex's staking feature allows traders to earn up to 13% APY returns with no lockup periods, and staking rewards are sent to the staking balance daily with the help of an automated system employed by Margex.
Margex platform is free of high volatility coins that have been pumped, making the platform safe for trading. Let us look at how we can spot and trade the hanging man candle using the Margex platform.
It is very important to note that trading with the help of trends gives a trader more and better probability setups as the crypto market have been identified to always move in trends. Let us look at how we can identify the hanging man candlestick pattern for a bullish trend.
Step 1: Identify A Bullish Trend
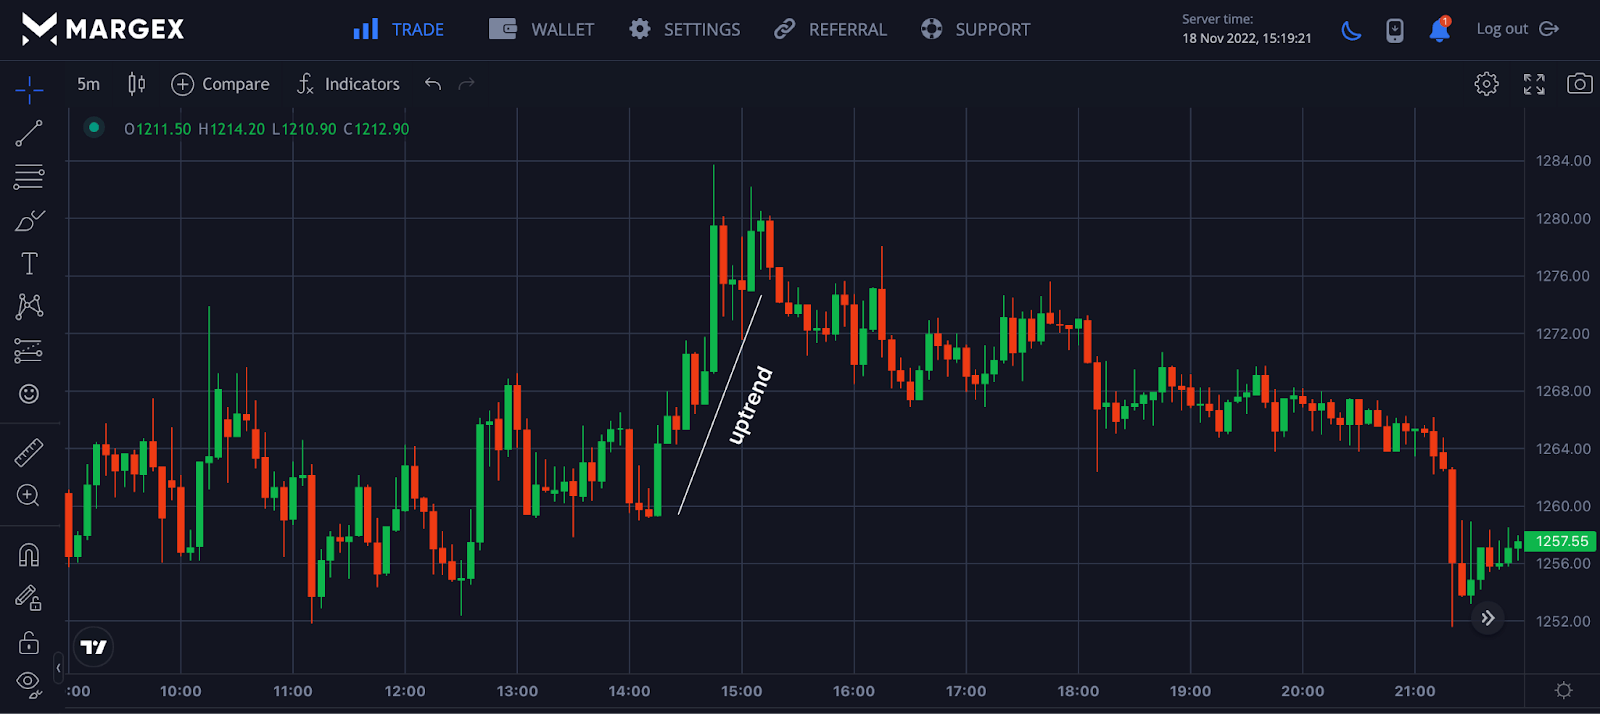
Identifying a bullish trend is a good way to find the hanging man candle pattern, as this appears at the end of an uptrend indicating a potential change in the trend from a bullish trend to a bearish trend as a result of sell pressures from sellers who have more advantage than the buyers.
The ImageImage above shows a clear uptrend formed by ETHUSD pairing with the buyers controlling the market at the initial stage.
Step 2: Identify The Hanging Man Candlestick Pattern
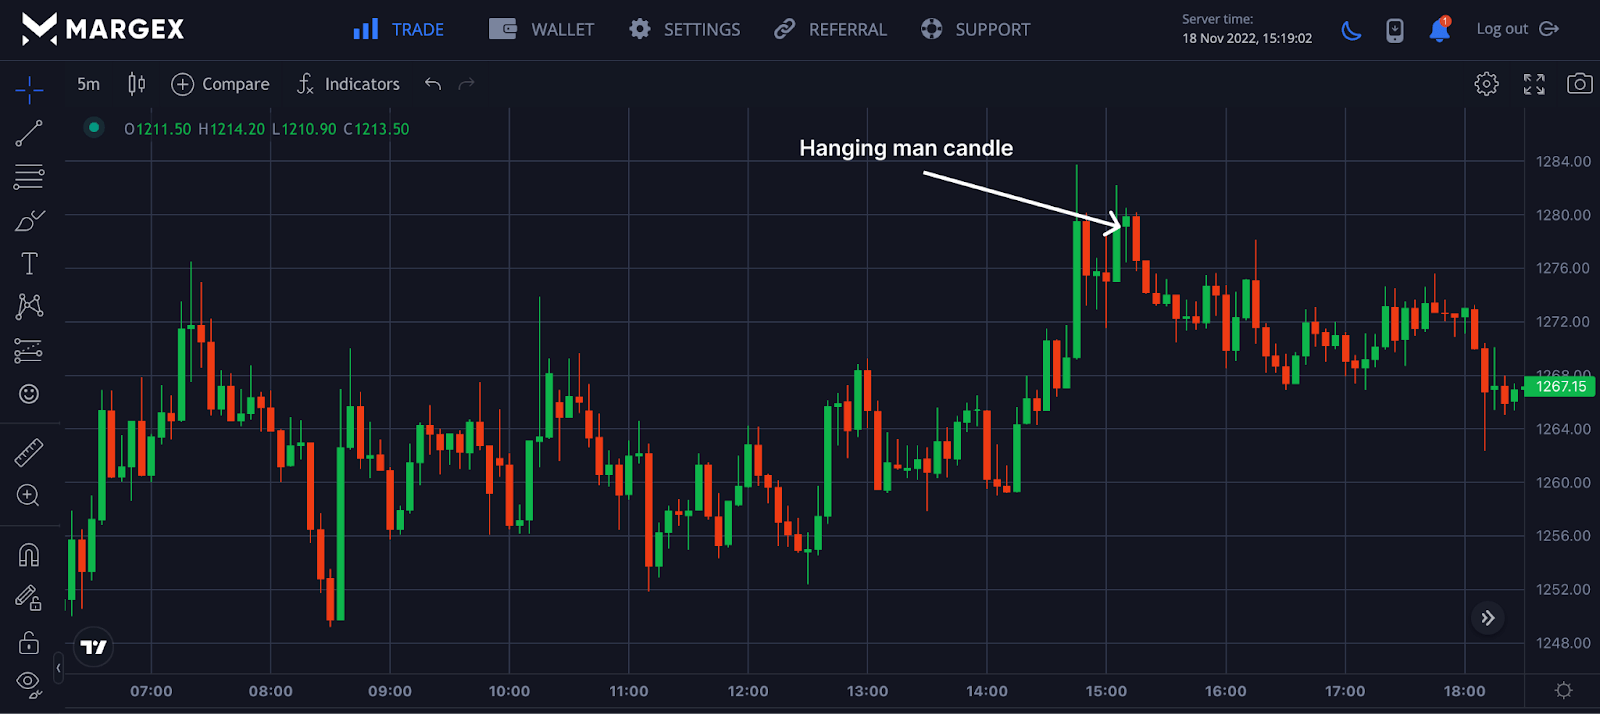
After identifying a bullish uptrend, we want to note if the trend is nearing its end by looking out for the hanging man candle pattern formation. The image shows the hanging man candlestick pattern being formed, indicating a potential bearish trend is about to be initiated.
This has been confirmed with the downtrend price movement in the direction of the bearish pattern formation.
Step 3: Identify Entry Point
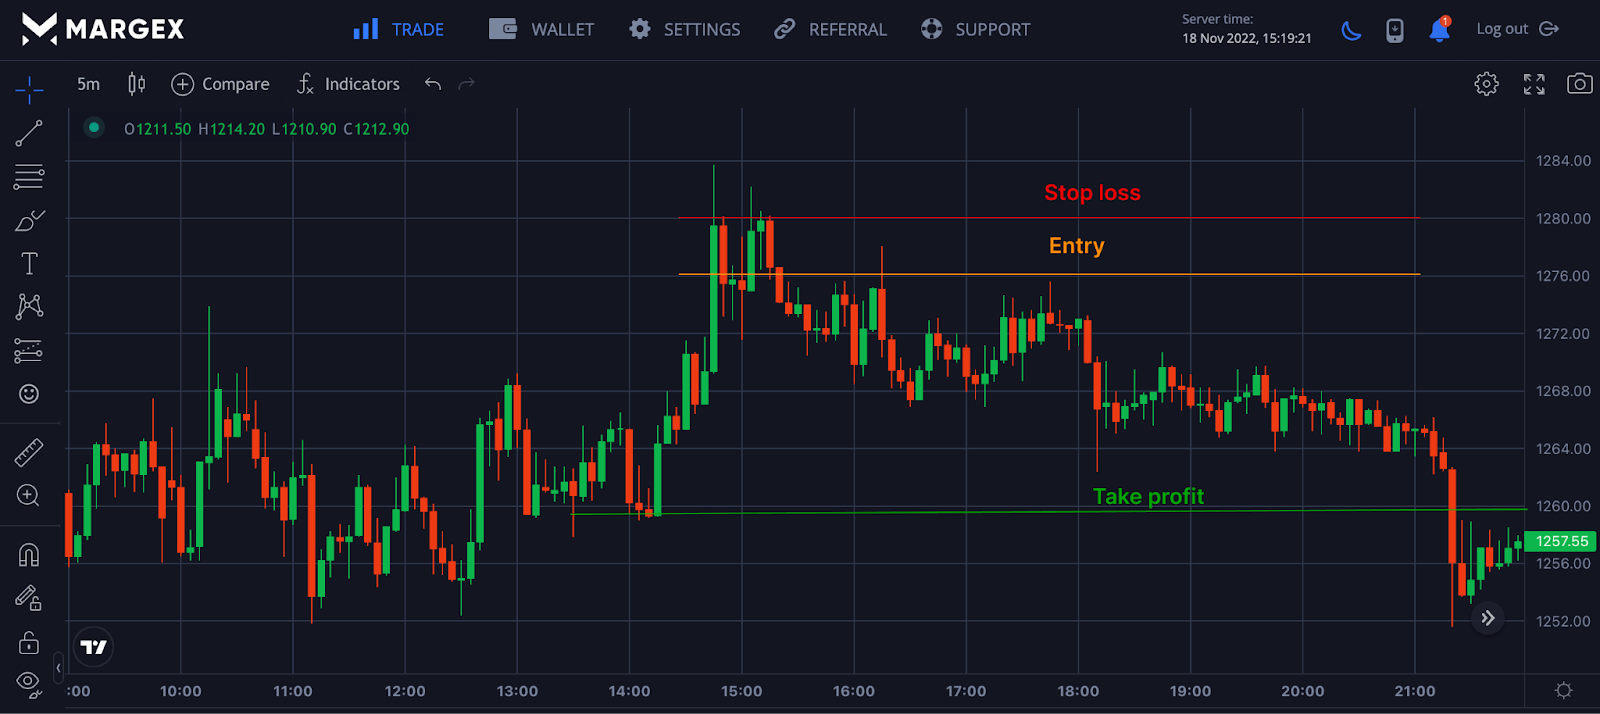
After identifying that the hanging man candle has been formed with a clear confirmation as to the market's next direction, a trader would need to identify the entry position for a potential short entry. An entry point is taken as the price direction favors the candle pattern.
Step 4: Set Stop loss And Take Profit
Setting your stop loss just above the entry is a good risk management technique for this trade and candlestick pattern. The hanging man candle is not 100% certain, as this pattern can fail during extreme market conditions that lead to high price actions and volatility. Leading to false signals and markets going the opposite direction, it would be safe to set a stop loss to avoid losing your portfolio or giving back profits to the market.
Setting a take profit is a way to reduce greed and continue building and working on the strategies that have produced consistent returns.
How Reliable Is A Hanging Man Pattern?
The hanging man candle pattern is a very profitable price reversal chart pattern when it appears at the end of a bullish trend, but this does not mean it is 100% guaranteed, as the price could continue its trend after forming this pattern. Despite how profitable it has been, traders who trade the hanging man candle pattern need to get additional confirmation or wait for the next candle formation to decide on the direction of the market trend. If a bearish candle follows the hanging man candlestick pattern, this confirms the trend change from bullish to bearish with the trader looking to open a short position.
Indicators To Confirm The Signal From A Hanging Man Candlestick Pattern
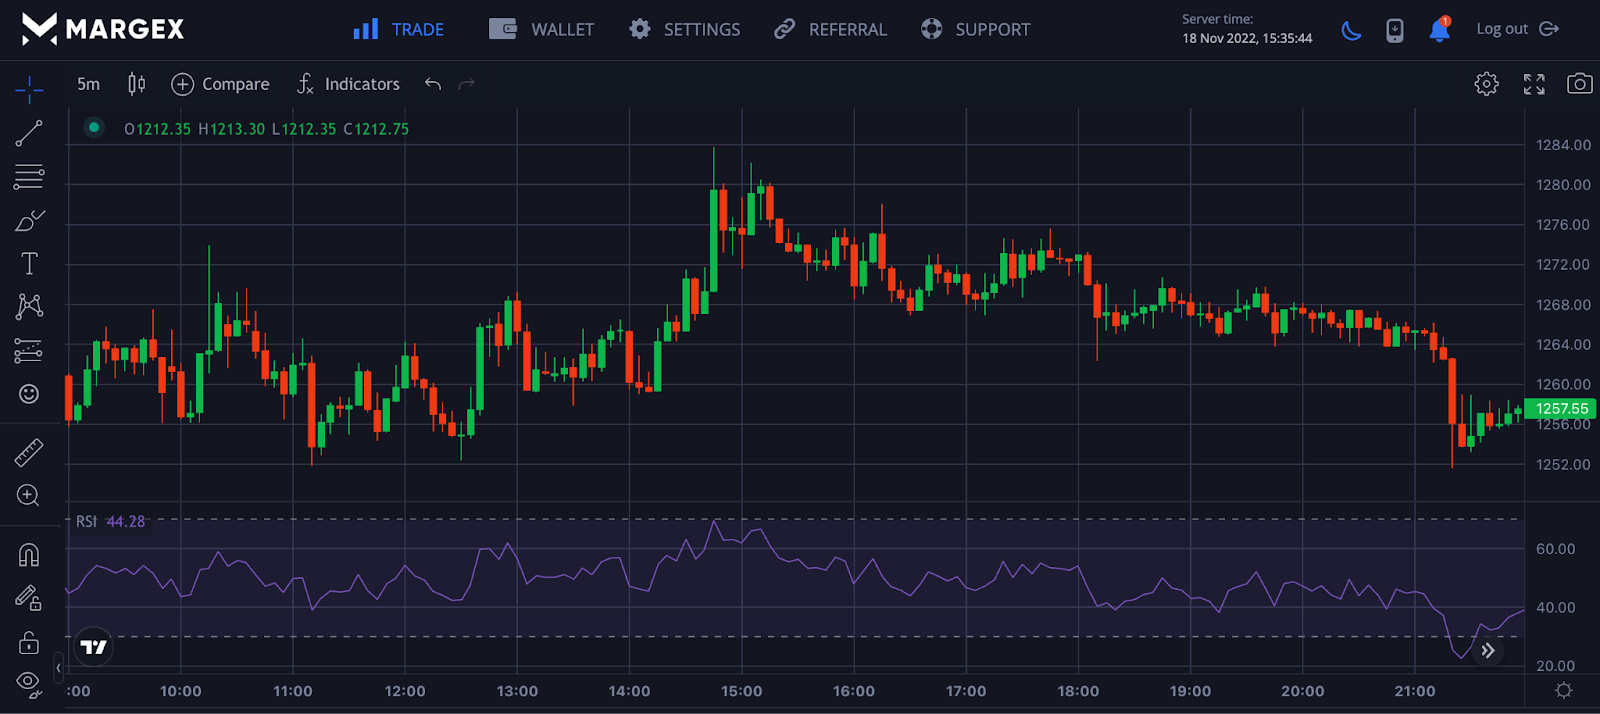
One way to confirm the hanging man candlestick pattern formation with a change in trend from a bullish to a bearish trend is using the Relative Strength Index (RSI) as a momentum indicator, as this will indicate the change in trend before the actual change in trend.
From the image above, the RSI showed a change in trend as the price moved from over 70 points downwards with a potential appearance of the hanging man candle followed by a change in trend from a bullish trend to a bearish trend.
With the help of the indicator, a trader can make better confirmation and open a short entry position with the hanging man pattern formation.
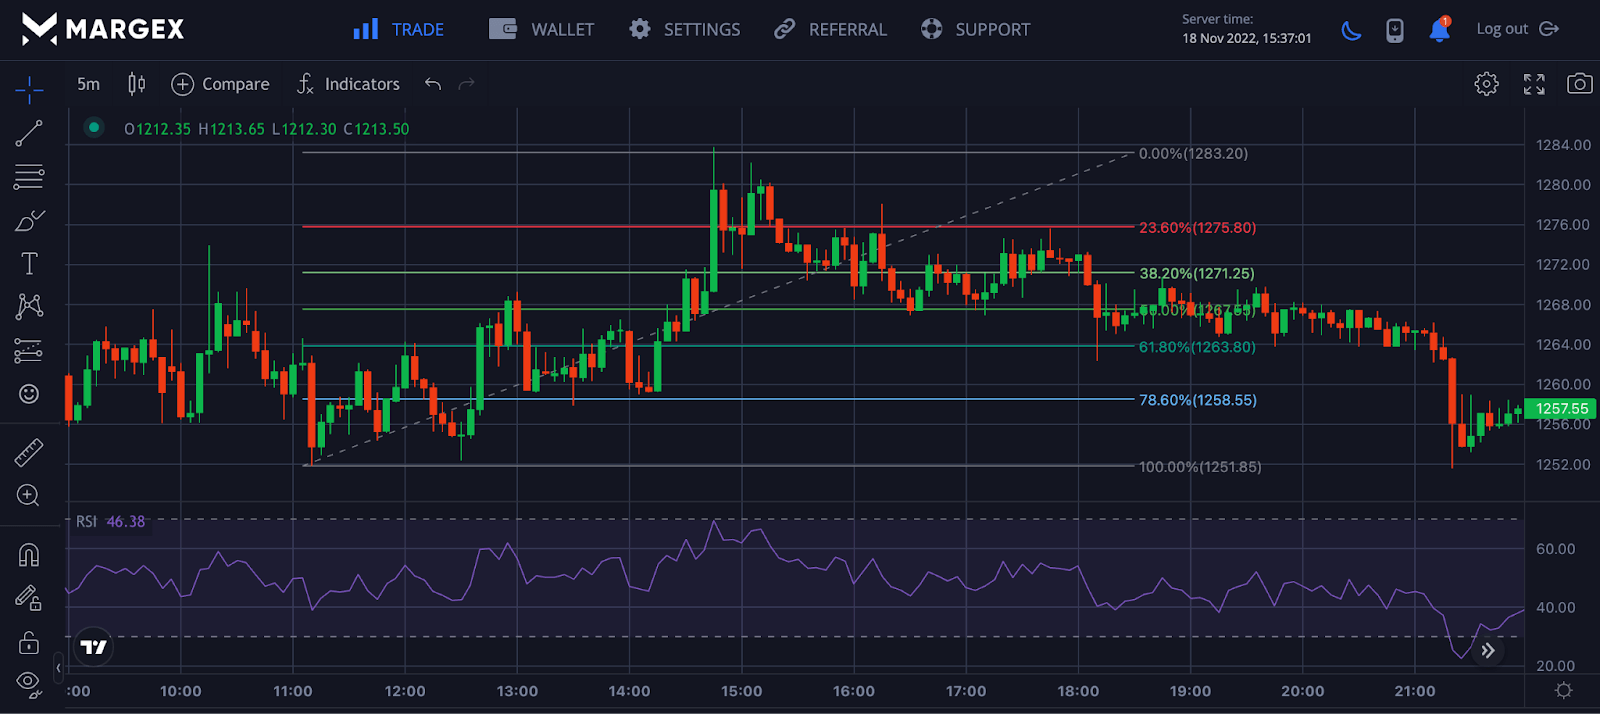
The use of the Fibonacci retracement values has been a good way to spot potential price change; the image above shows a breakdown in price after the appearance of the hanging man candle pattern with a retest of price around 23.6% Fibonacci value as the price initiated a downtrend price movement.
A trader could open a short position at this level, setting a stop loss above 23.6% and taking a profit at about 61.8% to 78.6%.
Frequently Asked Question (FAQ) About Trading The Hanging Man Candlestick Pattern
The hanging man candle pattern is a bearish trend reversal pattern employed by many traders to spot price change from a bullish trend to a bearish trend. Here are commonly asked questions about trading the hanging man candle pattern.
Which Candlestick Pattern Is Most Reliable?
Candlestick patterns are all reliable depending on the strategies a trader employs and how the trader combines this candlestick pattern with other trading techniques for better results. No candlestick pattern is 100% accurate, and as a result, it is advised to be traded with well-known indicators for better profitability.
What Does A Red Hammer Candlestick Mean?
The hammer candlestick pattern is a bullish trend reversal from a bearish trend to a bullish one. A hammer candlestick can be red or green, but a red hammer means less price action by buyers to drive the price of an asset higher when compared to a green hammer which stands for strong bullish price reversal.
Is Hanging Man Candle Still Profitable?
The hanging man pattern is still profitable when used with other technical indicators for better confirmation and to increase probabilities for the price to go toward the bearish pattern formation.
