The study of technical analysis involves analyzing the price charts of cryptocurrencies and other financial instruments like forex trading to review past market behavior and use the information in an attempt to predict future price movements and forward-looking market behavior.
In addition to looking closely at technical indicators, trading volume, Japanese candlesticks, and more, analysts often pay close attention to the formation of chart patterns. Certain technical chart patterns appear with enough occurrence and frequency that decades of study has yielded remarkably predictable results that can be used to increase the probability of success.
Even the most well-developed patterns perfectly matching the guidelines of the chart pattern can fail, ultimately adding a layer of unpredictability that only the use of proper risk management and stop loss tools can reduce the impact of. Knowing the rules and guidelines of each pattern can make identifying them properly that much more precise.
Among the more popular chart patterns that exist, is the head and shoulders. The head and shoulders pattern is particularly popular not only due to the high frequency of occurrence, but also due to how easy they are to identify and how profitable the results of a confirmed head and shoulders chart pattern can be.
In addition to teaching you how to identify and how to trade the head and shoulders pattern, the following guide also dives into the inverted head and shoulders version, otherwise known as the inverse head and shoulders. The guide also explains what to do if a head and shoulders pattern fails, along with tips for things like proper stop loss placement and how to measure the pattern to project potential profit targets.
Head And Shoulders Patterns Explained
The head and shoulders pattern is a common chart formation and reversal pattern that appears at the top of an uptrend. An upside-down version of the pattern also appears at the bottom of a downtrend.
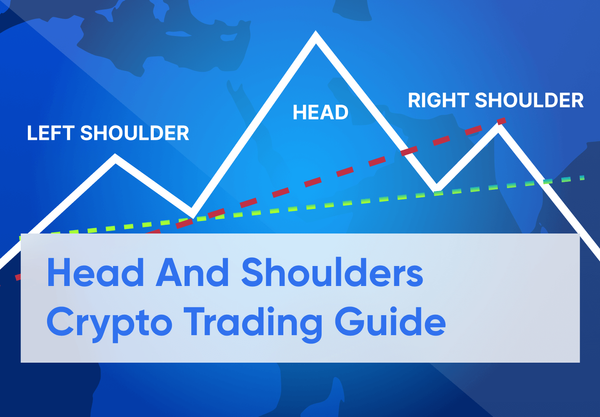
The head and shoulders pattern is a three-peak topping pattern consisting of a left shoulder, head, right shoulder, and a neckline that acts as support throughout the pattern. Each shoulder will rise roughly to the mid-point of the head. During the pattern, bulls and bears push back and forth creating the pattern. After support is tested for a third-time, the neckline breaks down from the right shoulder with high volume.
Traders are advised to take a position after a breakdown from the neckline. Alternatively, crypto traders can wait for throwback to confirm support turned resistance, which once confirmed makes for an ideal short entry with a high probability of success. Given the high rate of success, traders should focus on measuring the height of the pattern to project a minimum target.
An inverse head and shoulders pattern is essentially a flipped upside-down version of the head and shoulders pattern. Instead of three peaks, there are three troughs and it is a bottoming pattern. More information on how to identify the pattern can be found in the sections below.
Is A Head And Shoulders Pattern Bullish Or Bearish?
The head and shoulders pattern is inherently bearish due to the fact that it is a reversal pattern that appears at the peak of an uptrend. It is sometimes referred to as a head and shoulders top or a head and shoulders reversal. After a particularly strong uptrend that has reached resistance, the underlying bullish momentum causes price to try for repeated highs.
However, supply is reached and selling ensues, pushing prices back down to neckline support. Buyers continue to buy the dip at each visit to support. Eventually, bears win, and the neckline support breaks down, taking out all of the built up long positions and buy orders placed at support. Selling also increases when the pattern is confirmed, causing the right shoulder to often increase in volume.
Although the head and shoulders chart pattern is a bearish reversal pattern, the inverse head and shoulders is a bullish reversal pattern. The inverse head and shoulders pattern is also called the inverted head and shoulders or a head and shoulders bottom.
How To Identify A Head And Shoulders Pattern? Head And Shoulders Pattern Rules And Guidelines
The head and shoulders pattern is among the easiest to recognize and identify properly.
- Price must be trending upward leading to the formation of the chart pattern.
- The shape of the pattern appears similar to a head between two shoulders. The head is the largest peak in the three-peak pattern, with each shoulder being smaller than the head.
- The two shoulders should be roughly the same height and have similar structure.
- Volume trends downward during the formation of the pattern, but increases during the right shoulder.
- The neckline is a support level drawn between the “armpits” of the shoulders.
- The pattern is confirmed after price makes a decisive close below the neckline.
- Prices throwback to the neckline support to confirm it as resistance the majority of the time (up to 68%).
- Traders can also open a short position after a retest of the neckline is completed.
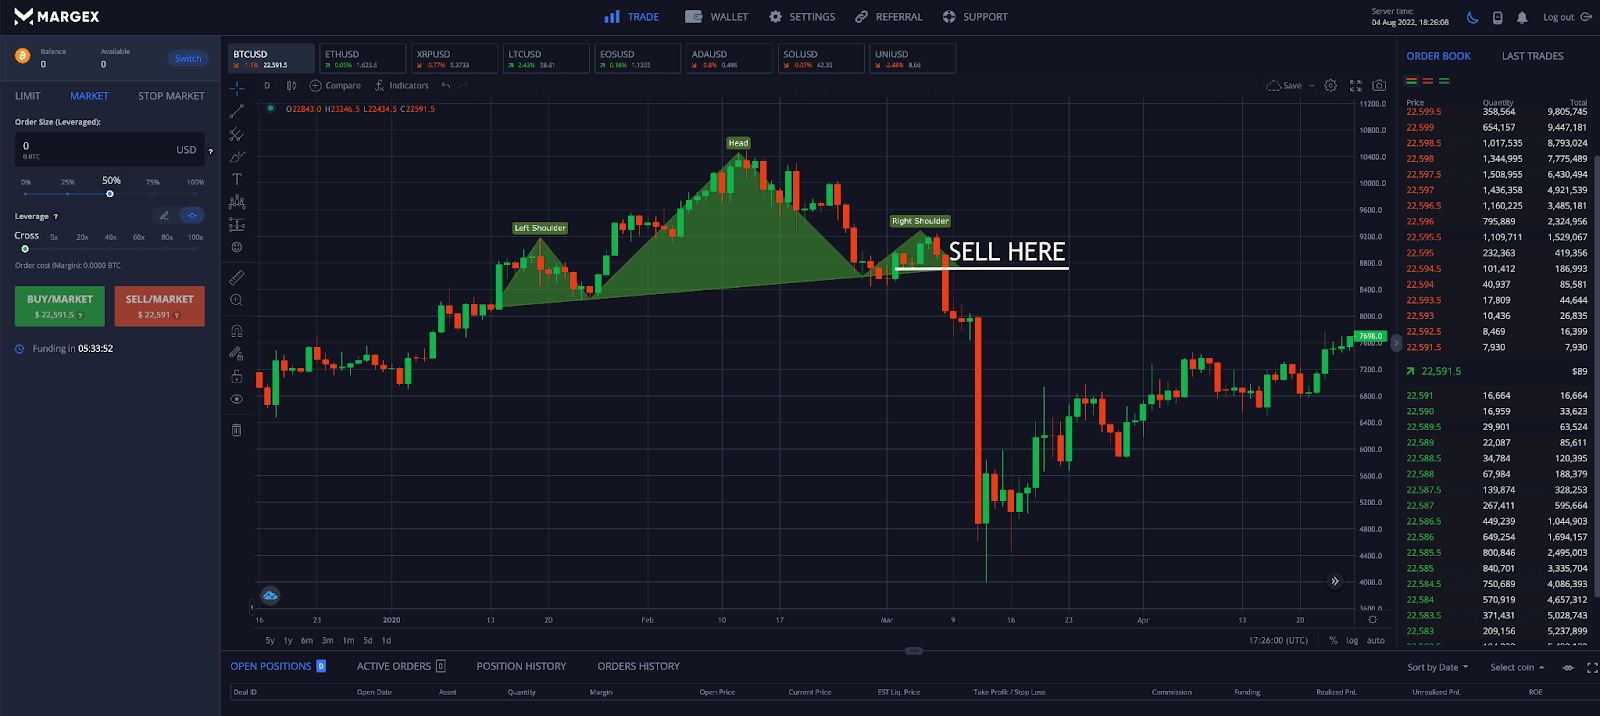
Head And Shoulders Chart Pattern Example In Crypto Trading
Here is an example of a head and shoulders chart pattern using the Margex trading platform’s built-in technical analysis tools:
How To Identify An Inverse Head And Shoulders Pattern? Inverse Head And Shoulders Pattern Rules And Guidelines
Much like the head and shoulders chart pattern, the inverse head and shoulders chart pattern is extremely easy to recognize and identify properly. The inverse head and shoulders is the bullish head and shoulders pattern and sometimes referred to as a head and shoulders bottom formation.
- Price must be trending downward leading to the formation of the chart pattern.
- The shape of the pattern appears similar to a head between two shoulders only upside-down. The head is the largest trough in the three-trough pattern, with each shoulder being smaller than the head.
- The two shoulders should be roughly the same depth and have similar structure.
- Volume trends downward during the formation of the pattern, but increases during the right shoulder.
- The neckline is a resistance level drawn between the “armpits” of the shoulders.
- The pattern is confirmed after price makes a decisive close above the neckline.
- Prices pullback to the neckline resistance to confirm it as support the majority of the time (up to 68%).
- Traders can also open a long position after a retest of the neckline is completed.
Inverse Head And Shoulders Chart Pattern Example In Crypto Trading
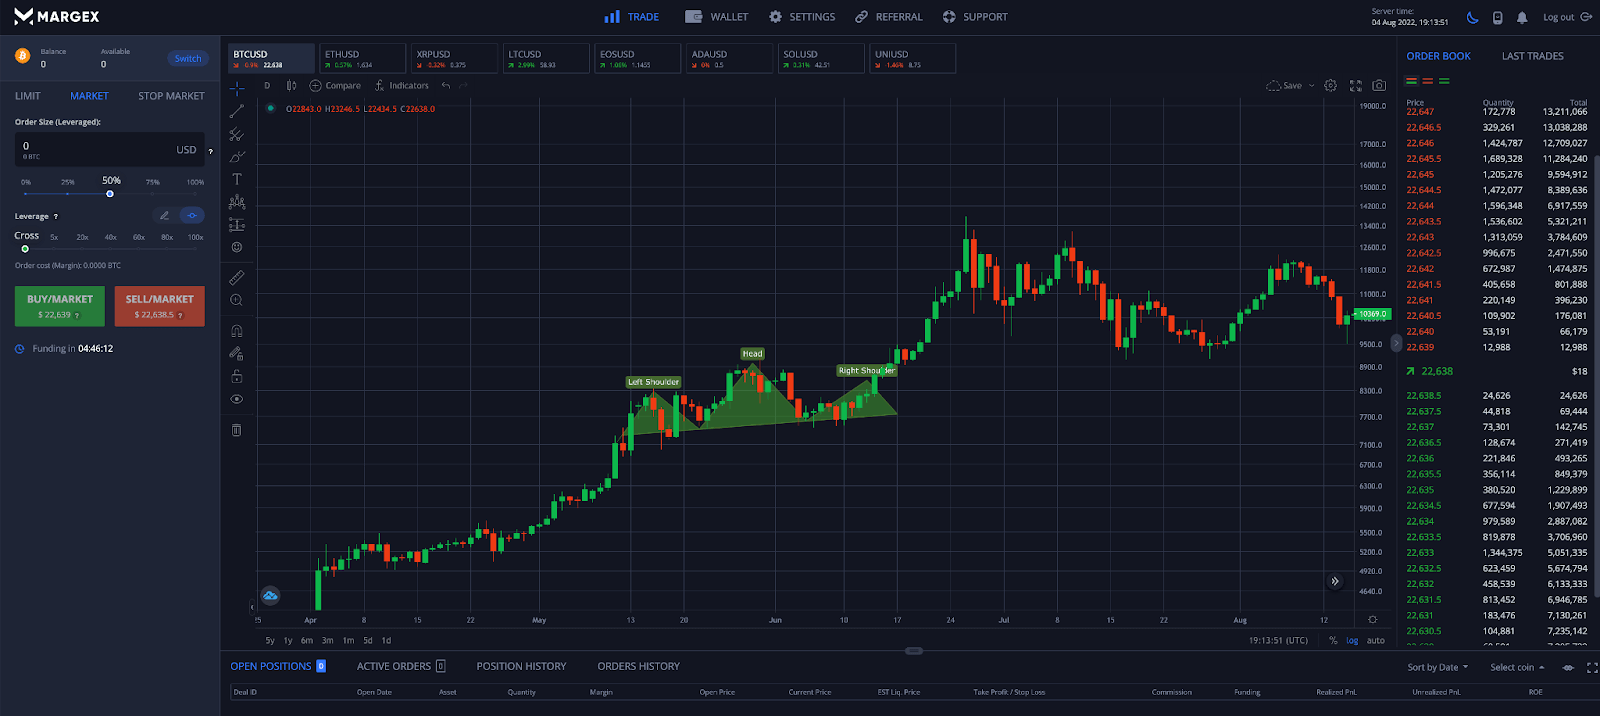
Here is an example of an inverse head and shoulders chart pattern using the Margex trading platform’s built-in technical analysis tools:
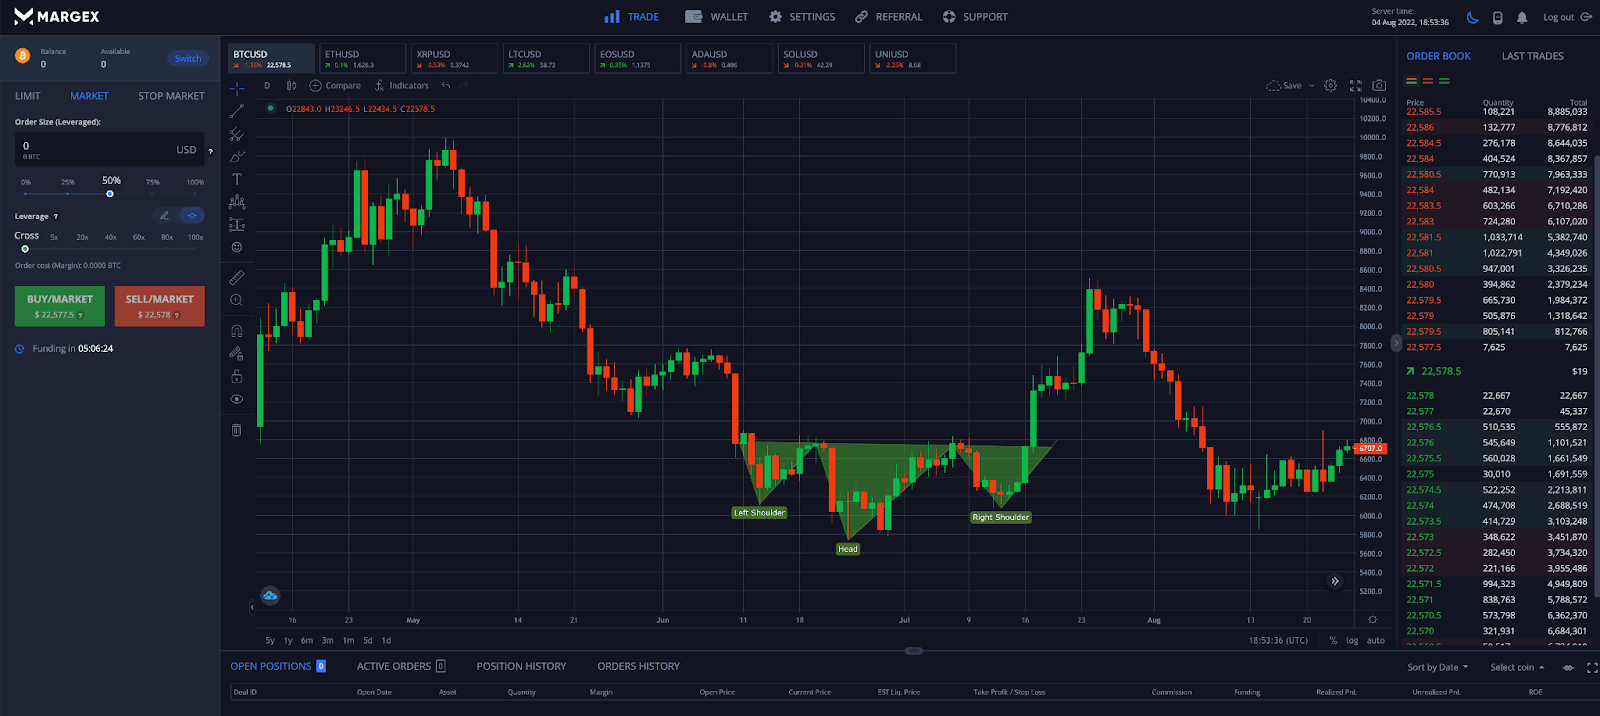
In the above example, Bitcoin found support and formed an inverse head and shoulders. After being unable to break below support, price reversed and rallied significantly higher.
What Is A Neckline In A Head And Shoulders Chart Pattern And How To Identify It?
The neckline is the most important aspect of the head and shoulders pattern or the inverted head and shoulders pattern. The neckline acts as critical horizontal support or resistance that braces the chart pattern as it develops and acts as the confirmation line to tell the market the pattern has completed.
The neckline is a trendline drawn across the two troughs in a head and shoulders pattern that acts as support. These could theoretically be defined visually as the pattern’s “armpits.”
In the inverse head and shoulders chart pattern, the neckline is instead a trendline drawn across two peaks at resistance, also in the area that would be considered the pattern’s “armpits.”
What Is A Complex Head And Shoulders Chart Pattern?
A complex head and shoulders chart pattern is similar to the normal head and shoulders chart pattern, except there is often more than one head in the pattern or a second set of shoulders.
The market mechanics in play that are creating both types of patterns are the same, with the only difference being that the pattern was more volatile, and there is an extra head or double the set of shoulders.
The complex head and shoulders pattern should be approached using the same strategy as the regular pattern, where the trade is taken when the neckline is breached with high volume. Complex head and shoulders patterns and inverse complex head and shoulders patterns are less common than the normal pattern.
Finding the potential price target of a complex head and shoulders pattern also follows the same methodology, which we’ll explain in the next section of this guide.
How To Find A Head And Shoulders Chart Pattern Target? The Measure Rule Explained
Part of the reason investors, crypto traders, and market analysts look for chart patterns like the head and shoulders pattern, is because they can produce reliable results when the pattern is confirmed. This makes it possible for even a beginner to foretell potential price action and the favorable risk-reward setup can lead to a profitable trade.
Chart pattern targets can be found using the measure rule. For the head and shoulders trading pattern, finding the potential price target can be done by measuring the distance between the head and the neckline.
Next, take that amount and multiply it by 51% (the measured objective target) and subtract the difference from the distance between the head and the neckline. Project the results below the point where price breaks down from the neckline to find the possible price target.
The same guidelines are valid for the inverse head and shoulders pattern, with the difference that the results would be projected above the neckline resistance line from the breakout point.
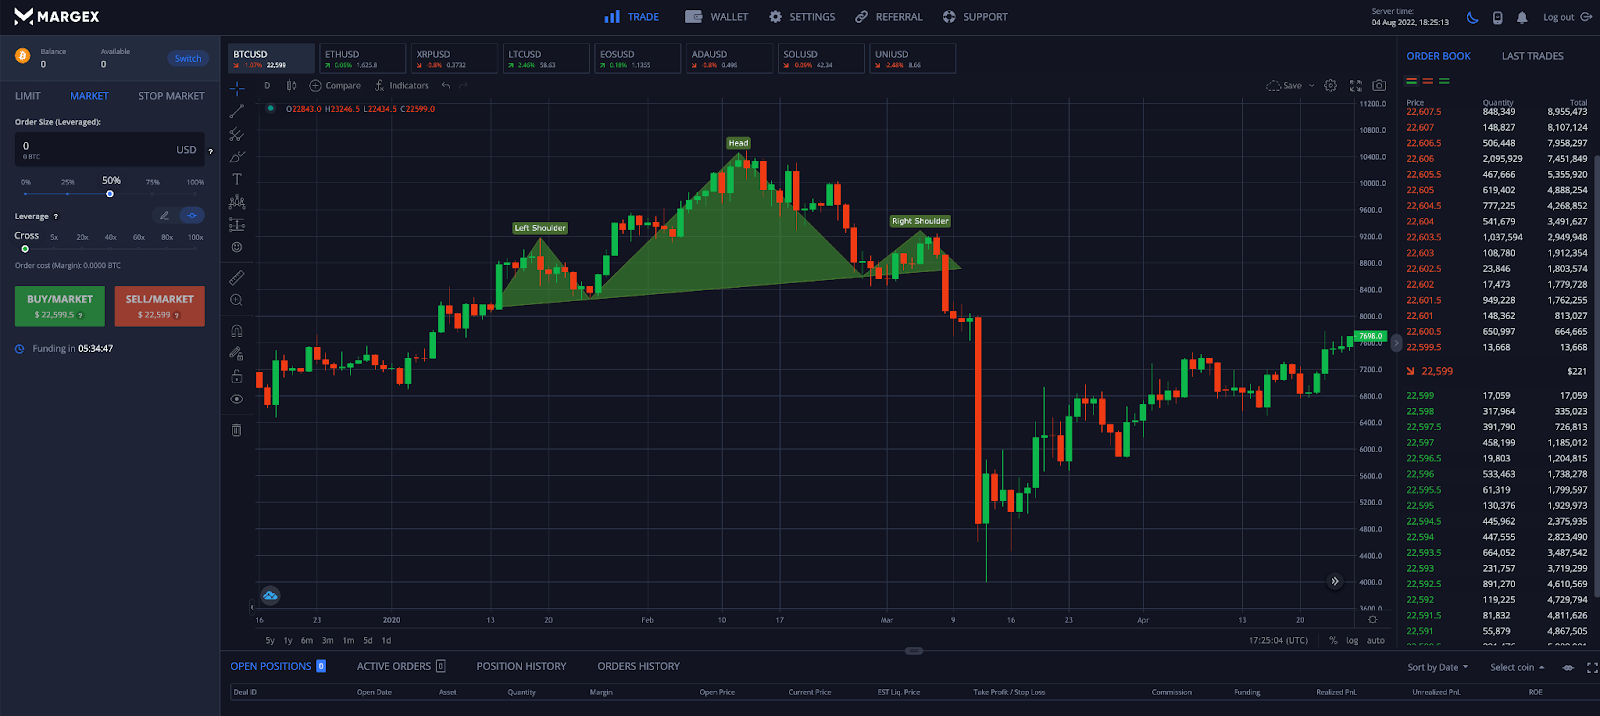
Here is an example of a projecting the target of a head and shoulders chart pattern using the Margex trading platform’s built-in technical analysis tools:
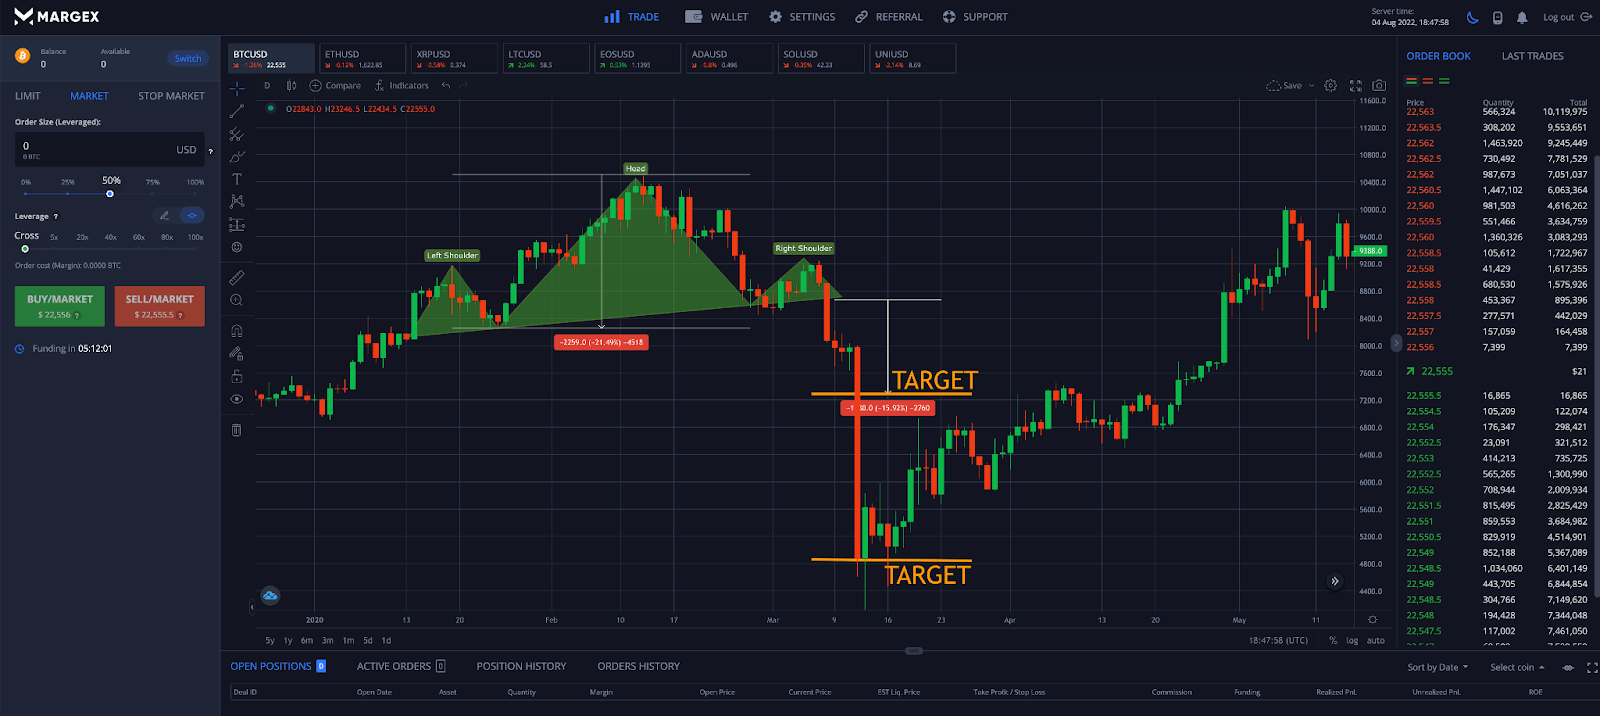
In the above BTC daily time frame example, intraday price action formed a large head and shoulders pattern. Traders would go short at a daily close below the neckline. The target would be measured from the neckline to the peak of the head of the pattern.
To find the minimum target objective, multiply the measurement by 51% and subtract the number from the neckline to find the minimum price target. In the example above, the price target overshot, taking out all of the positions built up at previous support levels.
How To Draw A Head And Shoulders Chart Pattern With Margex Trading Tools
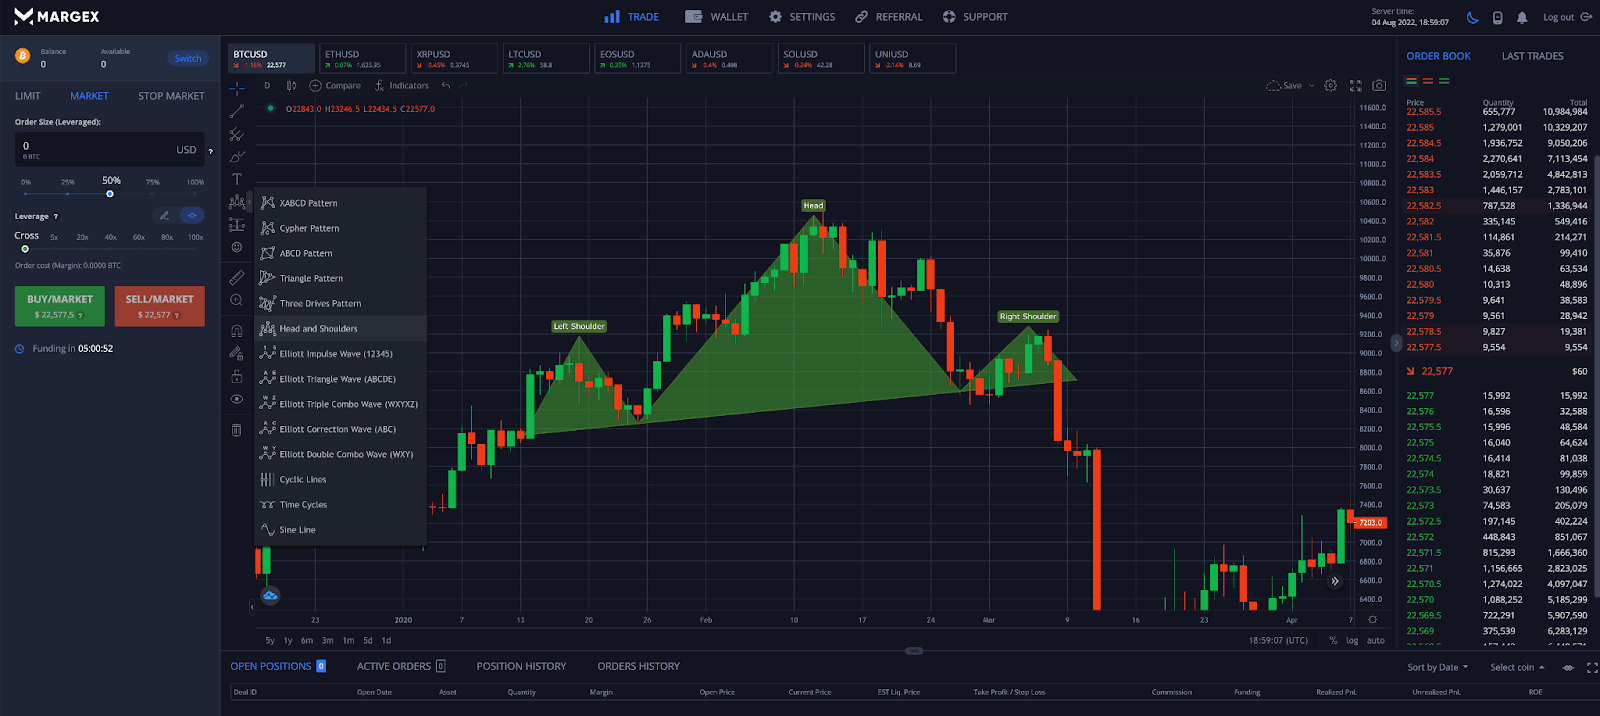
Drawing a head and shoulders pattern is simple. It starts with selecting the head and shoulders pattern tool from the list of pattern tools in the Margex toolset.
Once the tool is activated, scan the market for signs of a head and shoulders pattern or an inverse head and shoulders pattern.
First, draw the peak (or trough for inverse version) of the left shoulder, and then draw the line back to the neckline.
Next, draw the peak (or trough for inverse version) of the head stopping at the swing high (or swing low for inverse), and again draw a line connecting back down to the neckline.
Finally, draw the right shoulder, connecting it back down to the neckline. If price passes below this neckline with a decisive close and holds, the pattern is confirmed and a larger move should result.
Tip: Traders can also use the neckline to watch for a possible pullback or throwback, which is a safer and more conservative entry method. A pullback or throwback occurs only 68% of the time, so there is a chance the trade is missed if you wait to enter.
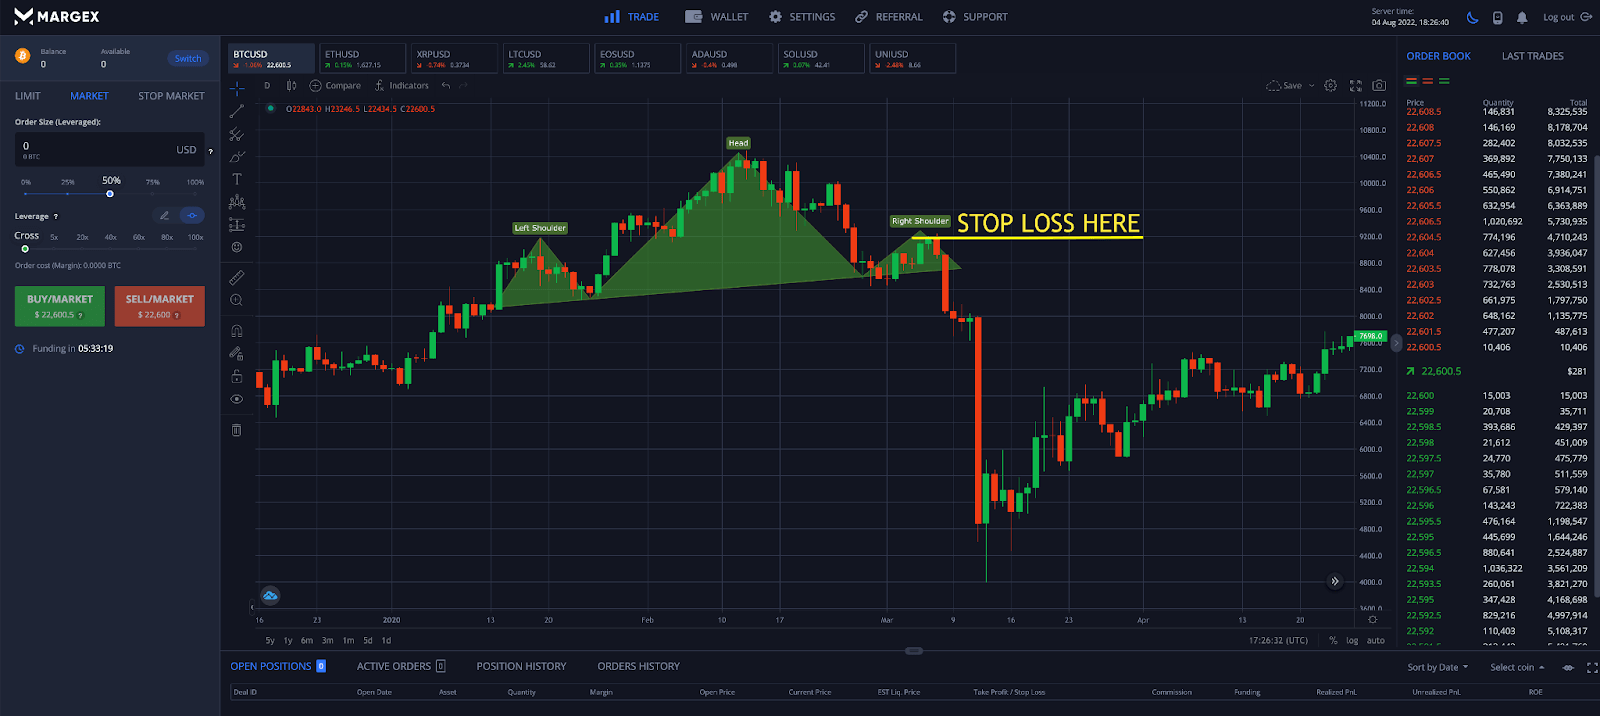
Can The Head And Shoulders Chart Pattern Fail? How To Prepare A Stop Loss
Head and shoulders patterns are known to fail and impact a trader’s bottom line adversely. Any time a reversal pattern fails, a large continuation move often results. The reason for this is because a large amount of orders are made in the trading range where the head and shoulders develops. Both buyers and sellers, bulls and bears open new positions in what is essentially a tug of war.
When one side gives out, the resulting move is larger due to the abundance of orders being stopped out along with new orders rapidly being placed.
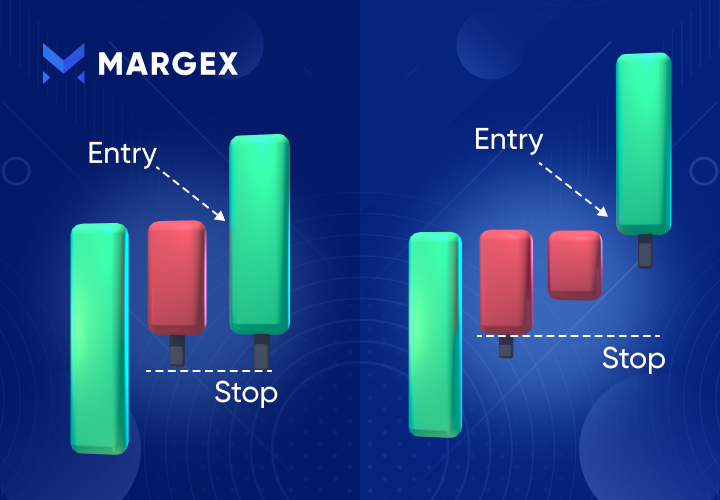
The best way to prepare for a pattern failure is to place a stop loss above the peak of the right shoulder, or below it for an inverse head and shoulders. The right shoulder is the more conservative spot loss placement. A more aggressive and loose method would be to place the stop loss order above the head of the pattern.
If price action climbs above the right shoulder, the pattern is considered invalidated and there is risk of loss or being stopped out.
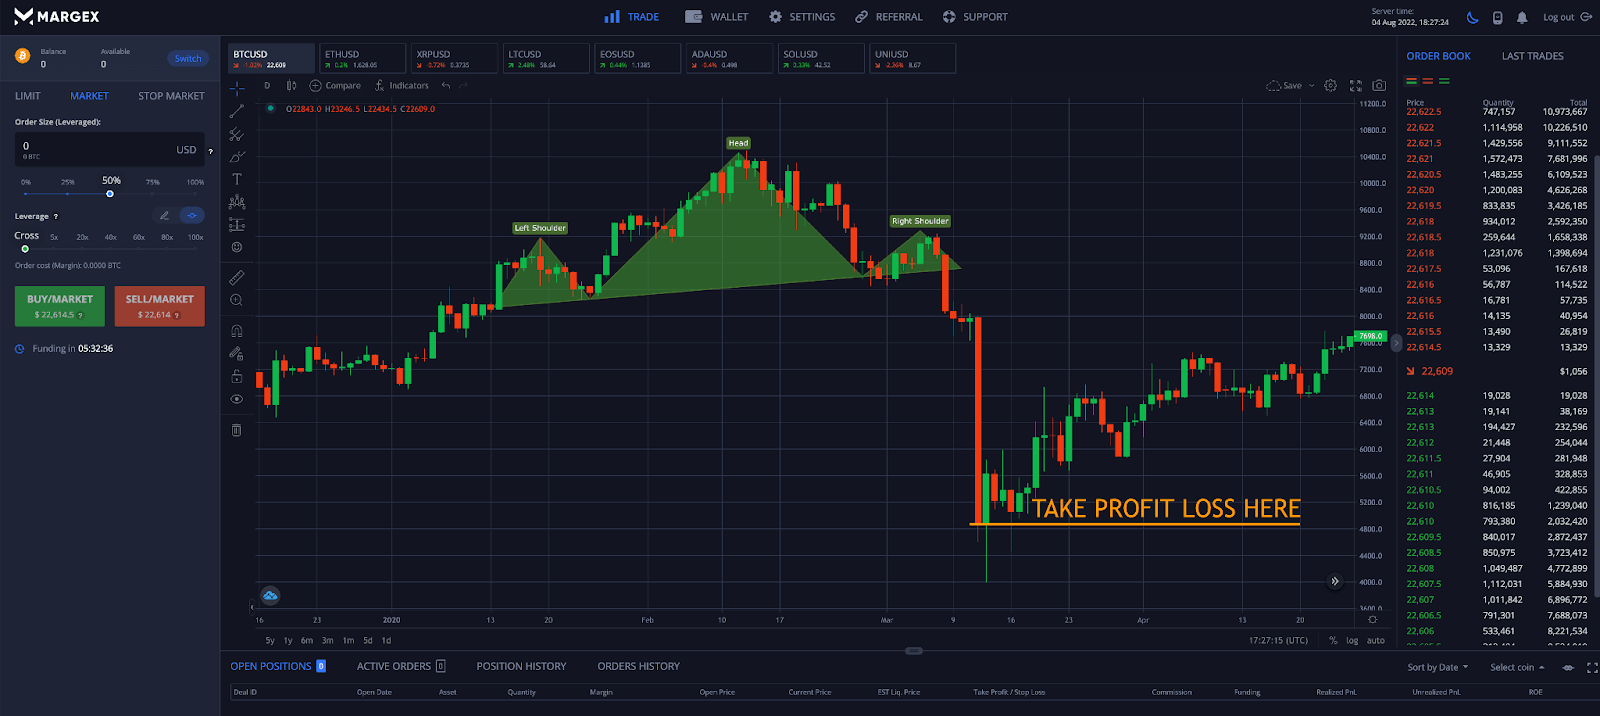
In the above example, Bitcoin formed a head and shoulders pattern, but the pattern ultimately failed and it caused prices to rip higher, stopping out all of the short positions placed at the head and each shoulder.
How To Trade A Head And Shoulders Chart Pattern With Margex Margin Trading
The innovative Margex digital asset margin trading platform offers long and short positions with up to 100x leverage, and built-in charting tools. The platform also includes access to powerful technical indicators like the Relative Strength Index, Bollinger Bands, Ichimoku Cloud, and the Stochastic RSI.
Using the built-in technical analysis tools provided by Margex, the following steps will walk you through trading head and shoulders patterns like a pro:
Step 1 - Open up the chart for your favorite cryptocurrency and scan the market for any possible head and shoulders patterns. Utilize the drawing tool to properly identify the pattern and draw it out on the chart.
Step 2 - Wait patiently for the head and shoulders pattern breakout and confirm with a close below the neckline on high volume in the right shoulder. Alternatively, traders can wait for a throwback to the neckline to go short.
Step 3 - Place a stop loss order above the peak of the right shoulder or above the peak of the head for more wiggle room on your stop loss. Where you place your stop loss should be defined by your risk management strategy and position sizing.
Step 4 - Measure the target of the pattern, and wait patiently for price to reach the projected target. Consider setting a more conservative price target in case the measured objective isn’t reached.
FAQ
The head and shoulders pattern is a popular technical formation that is easy to identify. Trading the head and shoulders pattern is rarely confusing.
However, in an attempt to clear up any remaining confusion for traders, we’ve prepared this FAQ on head and shoulders patterns and inverse head and shoulders patterns.
What does the head and shoulders pattern mean?
A head and shoulders pattern is named as such due to the way the pattern forms. It forms across three different peaks set at different levels, which appear to form a head and two shoulders. The pattern begins with a medium high creating a left shoulder. Another higher high is set, creating the head. After yet another return to the neckline, the right shoulder forms. If the right shoulder breaks down with high volume, the trading pattern is confirmed and a larger move should result.
How reliable is a head and shoulders pattern?
The head and shoulders pattern is one of the most reliable chart patterns as it is extremely easy to identify and has clear and concise guidelines to follow during its formation. As such, the head and shoulders pattern makes for an easy to recognize pattern for beginners. Traders should also be aware of the inverse head and shoulders pattern, which is the same pattern just flipped upside down.
How do you confirm the head and shoulders pattern?
The head and shoulders pattern is confirmed once there is a candlestick close below the neckline support trendline and price action continues in the same direction with high volume. More often than not, prices will throwback to the neckline to confirm it as support turned resistance, retest the line, and then continue with the expected reversal.
Which timeframe is best for head and shoulders pattern?
Any time frame can be used for the head and shoulders pattern, however, traders tend to prefer the daily timeframe. Head and shoulders patterns can appear in any timeframe, from the one minute chart to the one year. The larger the timeframe, the longer it takes for the pattern to develop and the larger the resulting move once the pattern is confirmed.
Is a head and shoulders pattern bullish or bearish?
The head and shoulders pattern is primarily a bearish chart pattern, signaling a reversal at the peak of an uptrend. However, there is a bullish version of the pattern called the inverse head and shoulders pattern. In this case, these patterns are a bottoming reversal pattern that appear at the bottom of a downtrend.
Is head and shoulders always bearish?
This is a confusing question to try and answer and explain. The short answer is yes, the head and shoulders is always a bearish chart formation. However, the inverse head and shoulders pattern is the upside-down version of the pattern and is always bullish instead. Rare patterns called a compound fulcrum bottom sometimes appear at the bottom of a downtrend and look like a regular head and shoulders pattern. These are a different pattern, however, and should not be mistaken.
Is an inverse head and shoulders bullish?
Much like the head and shoulders pattern is always bearish, the inverse head and shoulders pattern is always bullish. These patterns represent price action hitting a wall and being unable to get through after several attempts. After three successive troughs in the form of two shoulders and a head, prices reverse and the market rallies higher.
Does the head and shoulders pattern fail?
Like all chart patterns, the head and shoulders and the inverse head and shoulders can fail. Although they are reliable signals, even the most reliable signals sometimes fail and price continues in the opposite direction than expected. Traders must use careful stop loss placement and risk management strategies to ensure a successful trade and minimal losses.
What is a complex head and shoulders pattern?
A complex head and shoulders pattern is a type of head and shoulders reversal pattern that includes either an extra head or extra shoulders, or both. The same forces in the market are at play, with the only difference being the number of peaks or troughs. Traders would still take a position at the break of the neckline following the right shoulder. A stop loss is placed above the right shoulder in case the pattern fails. Busted patterns lead to continuation in the opposite direction, so be ready for anything.
How to increase the chances of success with head and shoulders trading?
Traders can increase the chances of success when trading any pattern by looking for additional confirmation of the movement using technical indicators or trading volume. The head and shoulders can be combined with tools like the Relative Strength Index, Bollinger Bands, Ichimoku Cloud, and the Stochastic RSI. Margex offers access to all these tools and more for free as part of the full suite of professional trading tools.
Can the head and shoulders pattern be a continuation pattern?
Some analysts argue that the head and shoulders can also appear as a continuation pattern in trending markets. However, the pattern is more commonly defined as a reversal pattern that arrives just as a trend is changing. The head and shoulders pattern acts as the point the trend reverses.