Anyone who has spent a considerable amount of time in the crypto market quickly begins to realize that the powerful intraday and longer-term volatility in price movements can be taken advantage of for additional profit.
For example, in 2021 Bitcoin price fell from $65,000 to $30,000, then climbed back to $68,000. In 2022, it fell below $20,000 – and below its former all-time high set back in 2017. Had a crypto investor held their coins the entire time without trading, buying, or selling in between, they could end up with a loss, or barely retain any ROI.
The practice of using technical analysis is how cryptocurrency traders predict potential trend reversals before they occur, know where support or resistance lies, or in general get a read on price action on various timeframes.
Read the following beginner’s guide to cryptocurrency technical analysis charts and learn all about crypto trend analysis and the most commonly used technical indicators for crypto trading.
What Is Technical Analysis And How Does It Apply To Cryptocurrencies?
The practice of technical analysis involves the study of price charts and chart patterns in various financial instruments, with the goal of potentially predicting future outcomes and using the information to improve the probability of increasing return on investment (ROI).
Crypto chart analysis aims to tell the technical analyst the current status of the underlying trend, its strength, and where support and resistance might be. Crypto traders and investors can use this information strategically as part of a technical trading system.
Technical analysis is sometimes ridiculed in the cryptocurrency community, where individuals claim that it is impossible to predict the future of each crypto asset. However, crypto tech analysis is about improving the probability of success and utilizing information about support and resistance within a risk management strategy. Therefore, not only can technical analysis make you money, it can help you to keep more of your profits, too!
Basic Assumptions Behind Technical Analysis
Technical analysis follows several key tenets, specifically that the market prices in all available information. Much of this information is based on historical chart patterns and technical indicator behavior. Because this information has been studied and is well documented, chart patterns in a sense become a self-fulfilling prophecy because market participants are reacting according to the guidelines of the pattern.
Efficient Market Hypothesis
Efficient market hypothesis is the assumption that the prices of any asset or trading instrument will reflect all available information and thus, the current price of any asset is the fair market value based on supply, demand, sentiment, and other factors.
Price Trend Theories
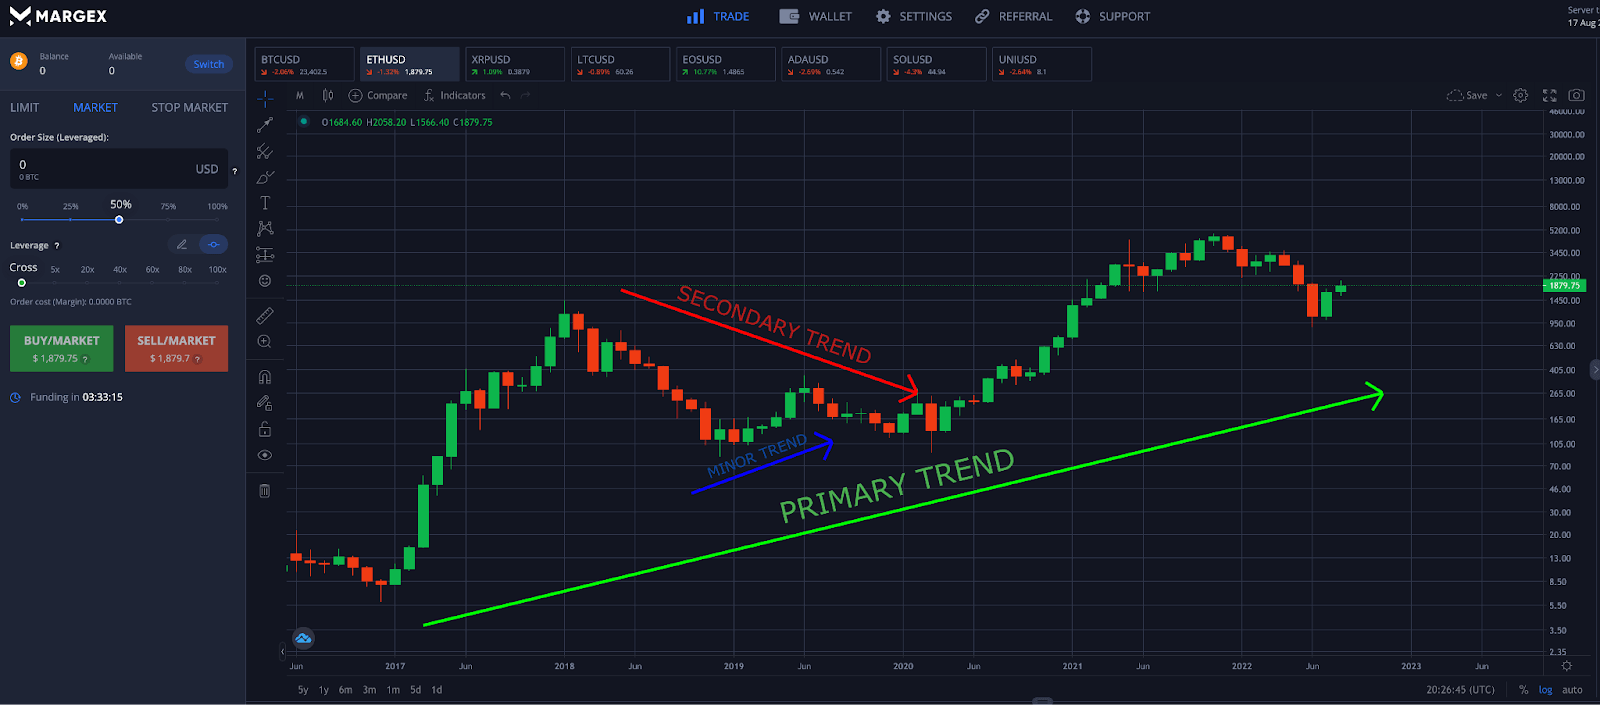
All markets are in a state of growth or decline and move in phases called trends. According to Dow Theory, there are three types of market trends: primary, secondary, and minor. Each trend is broken down further into three sub-phases: accumulation phase, public participation phase, and excess phase.
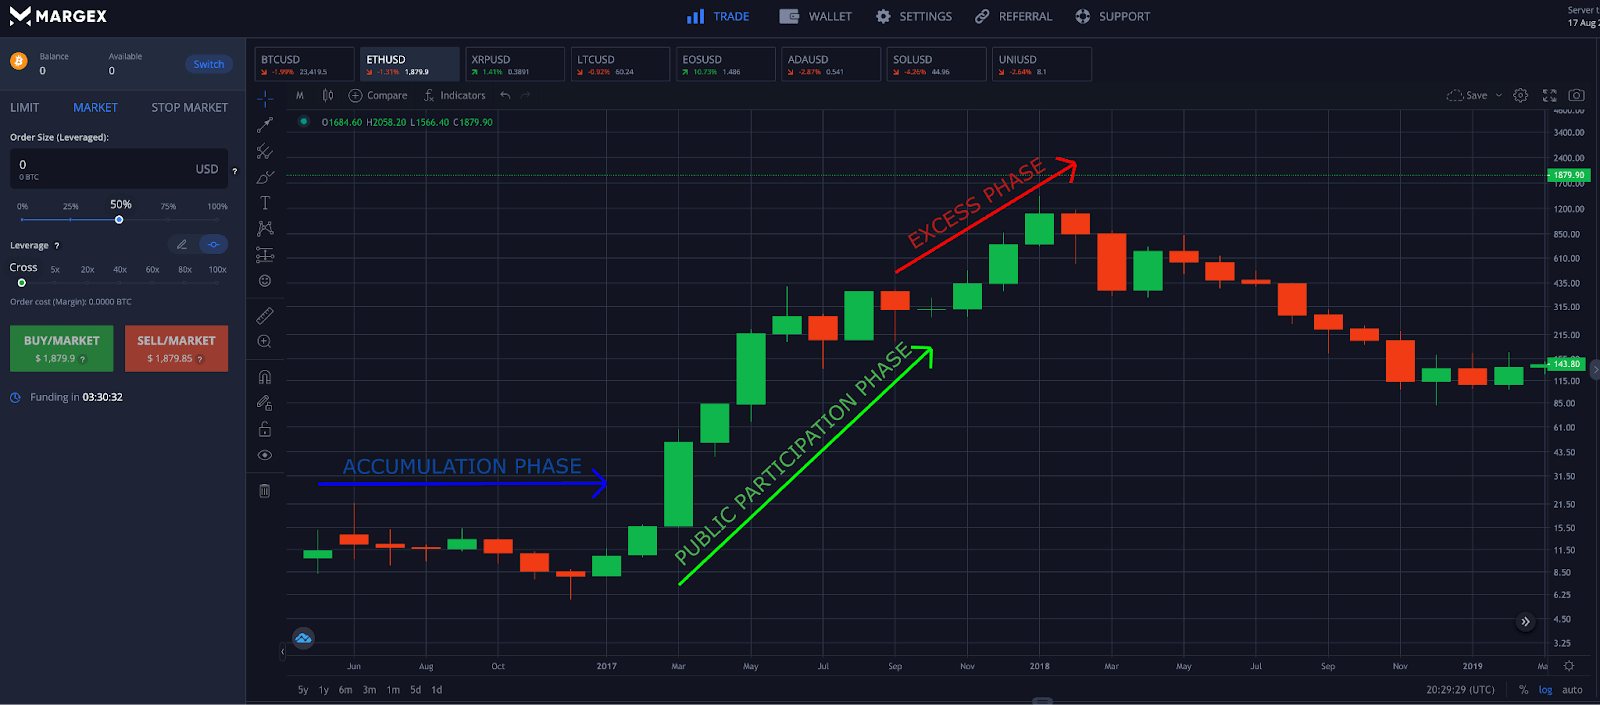
A secular bull market would be an example of a primary trend. Smaller bear markets would serve as secondary trends moving against the long-term primary trend, while a bear market rally would prove to be an example of a short-term minor trend taking place in a medium-term secondary price trend. Trends must be confirmed with increasing volume, signaling an increase in participation from investors and traders. Trends also tend to persist until there is a clear reversal.
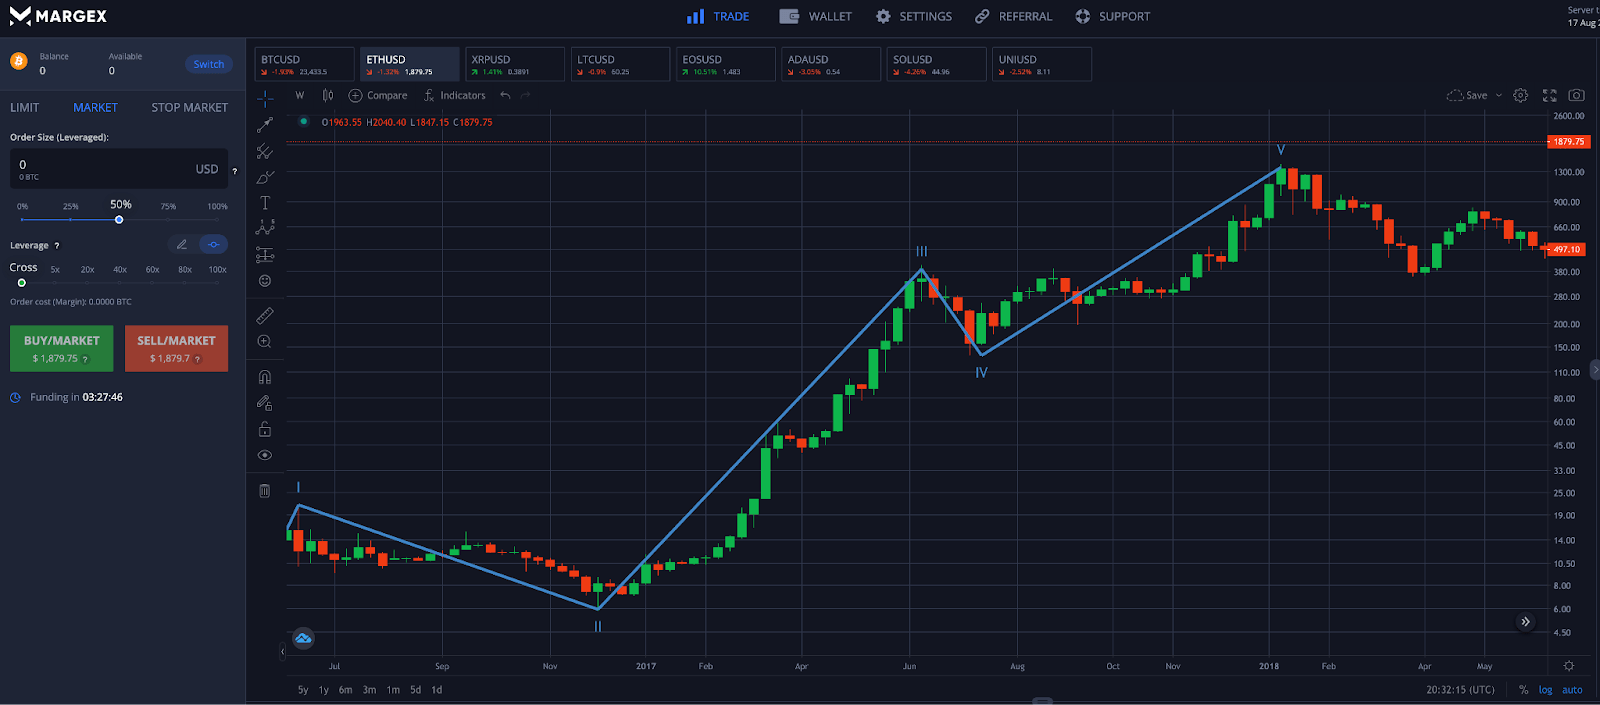
Elliott Wave Theory is yet another often-used guiding principle in technical analysis. Ralph Nelson Elliott believed that advancing markets moved up in five-wave patterns alternating between growth impulses and corrective phases, for a total of three steps forward, and two steps back. Fibonacci retracement and extensions are used to find targets in Elliott Wave Theory and could explain why these levels commonly appear as resistance and support.
History Doesn’t Repeat But It Often Rhymes
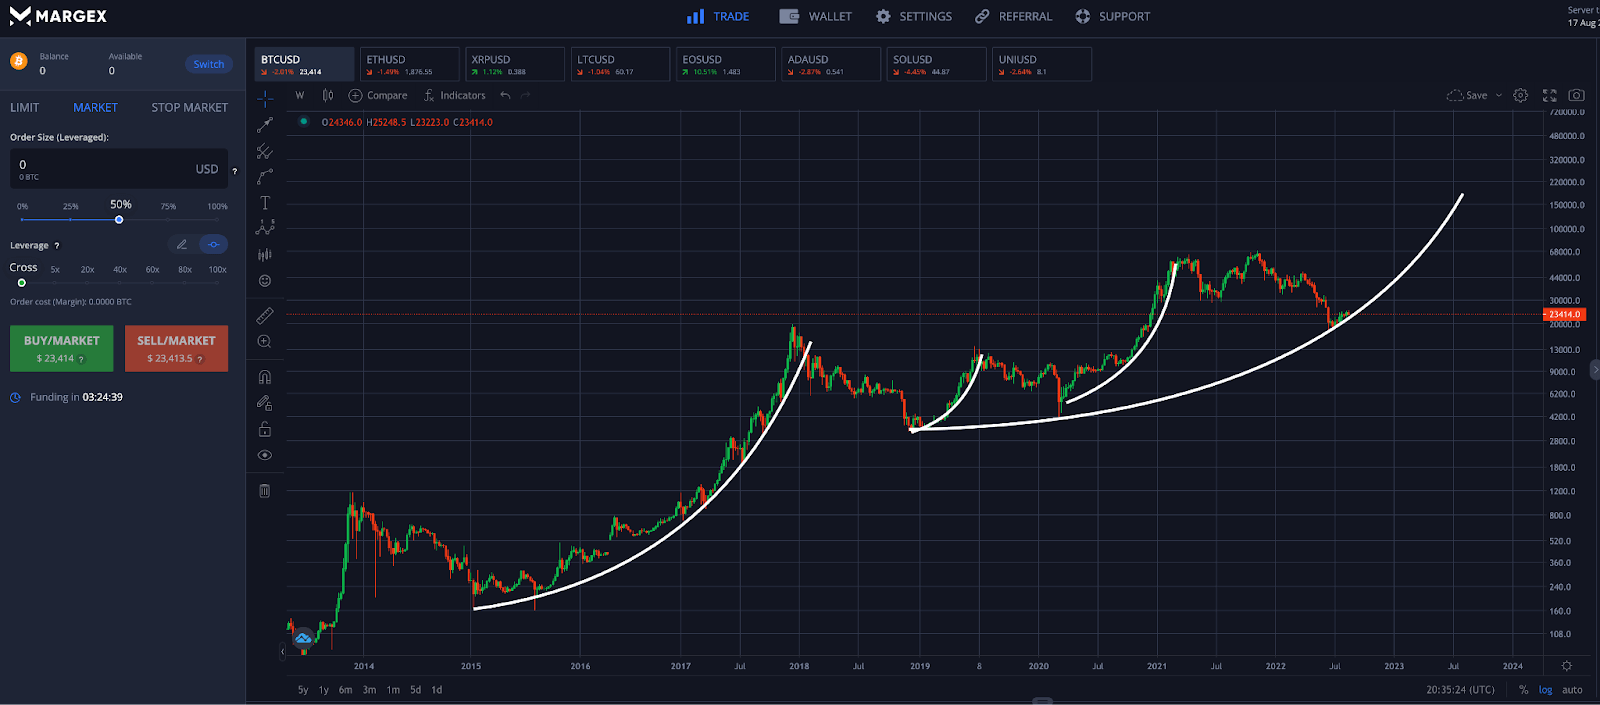
Mark Twain once said that “History never repeats itself, but it does often rhyme.” Price action in all markets exhibits fractal behavior, where ongoing price action resembles previous price patterns.
However, no trends or patterns develop exactly the same, so it is important to combine various technical analysis signals for confirmation. Clear chart patterns can often fail. Busted patterns can lead to a powerful move in the opposite direction than that was expected. Technical analysis also tells traders where to place a stop loss in the event a failed pattern occurs.
Basic Technical Analysis Tools
The average crypto investor or trader first starting technical analysis might be tempted to fill their charts with all kinds of complex tools and indicators, but oftentimes less is more and the simplest charts provide the clearest signals.
Focus first on the following foundational building blocks of crypto technical analysis before you move on to more advanced techniques. Too much information can lead to something called analysis paralysis, causing hesitation and possible poor decision making –– or a lack of making any trading decisions.
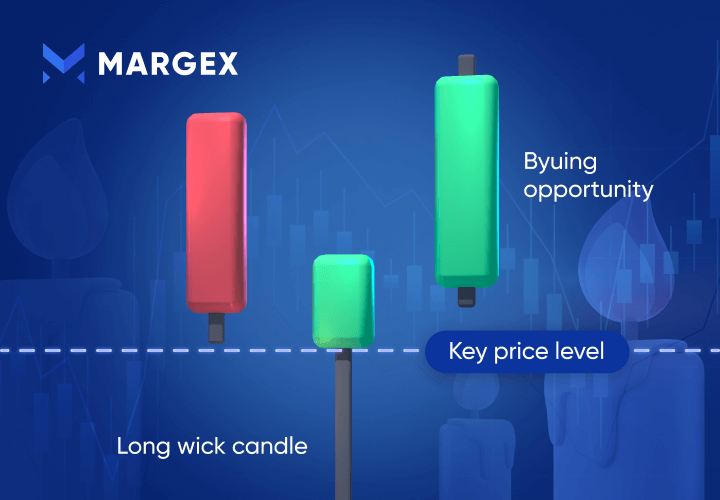
Japanese Candlestick Charts
The origin of Japanese candlesticks aren’t entirely known, but are said to be developed by Japanese rice trader Munehisa Homma in the 1700s. Since their introduction to the western world in Steve Nison’s 1991 book Japanese Candlestick Charting Techniques, candlestick charts have mostly replaced standard line charts in technical analysis.
Japanese candlesticks can provide information about each session by providing information on the session’s opening price, closing price, high, and low. Depending on these factors, each candlestick forms in a particular shape. Two or more specific candlesticks can come together to form a candlestick chart pattern. Different signals are given depending on the space of each candlestick or if they form as a red candlestick or green candlestick.
Other chart types include: Point & Figure, Renko, Kagi, Heiken Ashi, Range Bars, Volume Bars, Area, and more.
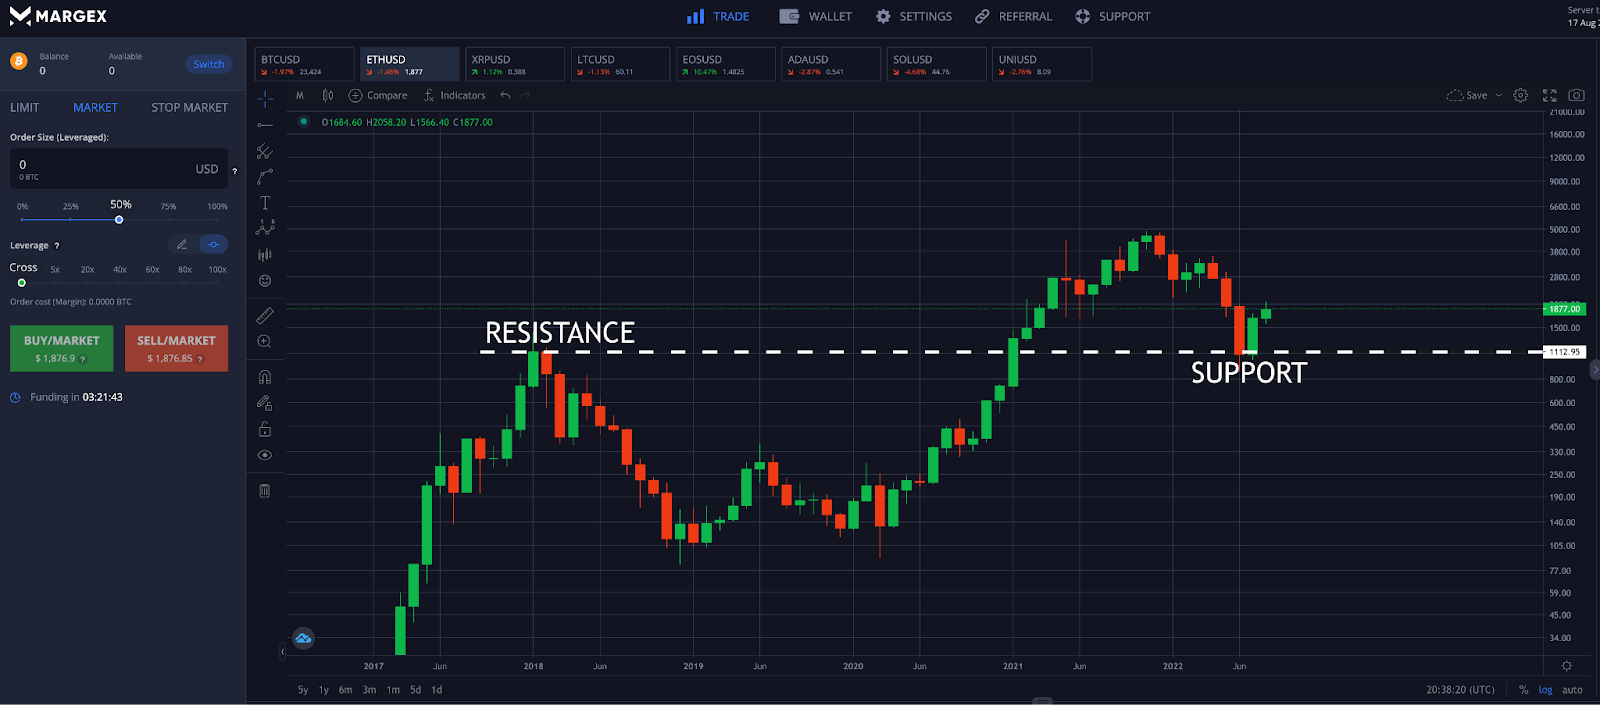
Support And Resistance
Support and resistance levels represent areas of supply and demand. Either past trading history, or psychological zones are where the bulk of buy and sell orders are placed. When price reaches one of these zones where there is significant supply or demand, there is potential for price to run out of momentum, and the trend could reverse at that point. This makes buying support and selling resistance a very basic investment strategy.
Crypto resistance levels and support can be: horizontal, diagonal, Fibonacci, psychological, or exist at whole, rounded numbers. Fun fact: support and resistance often lie at whole, rounded numbers because humans find entering these numbers easiest when placing a limit order.
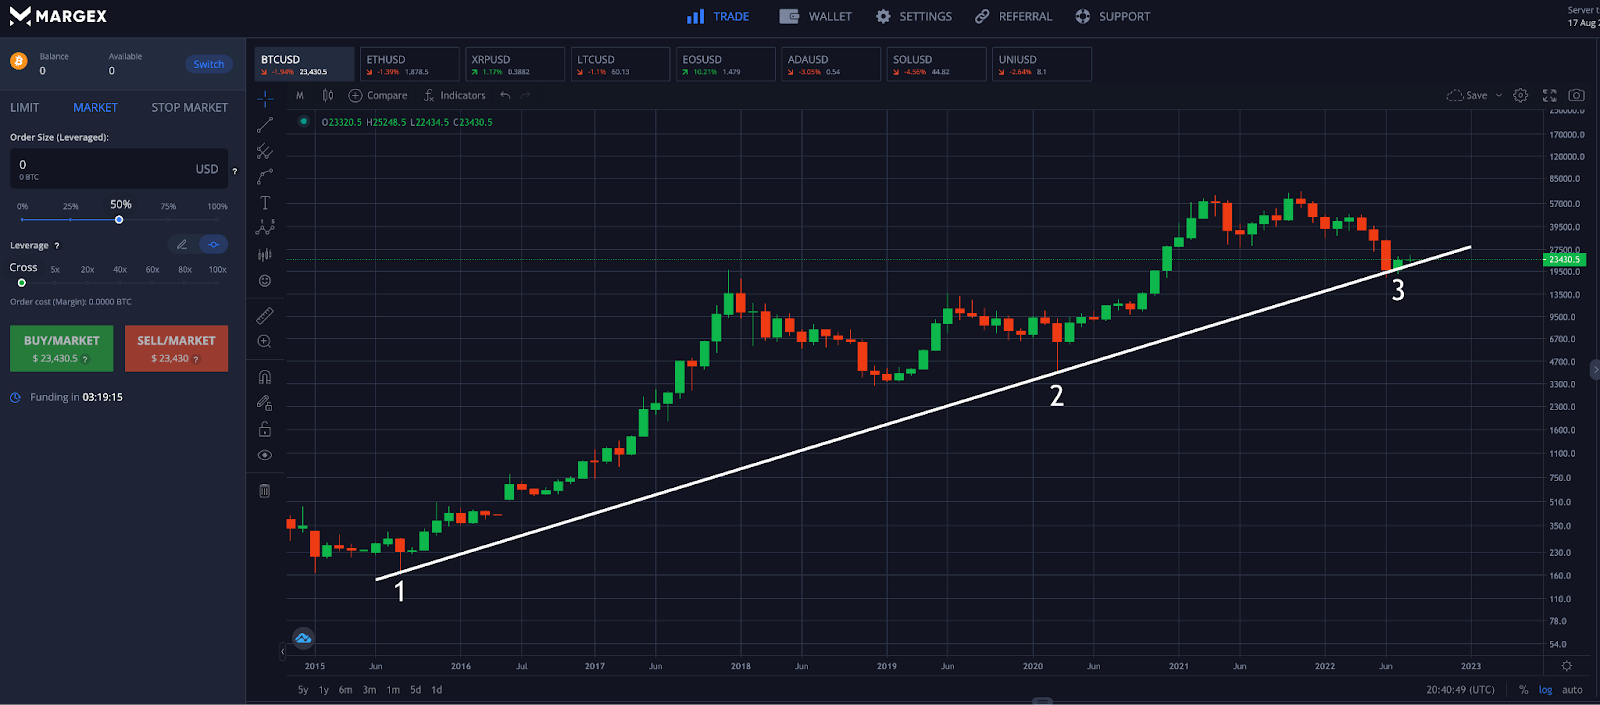
Trend Lines
The basis of horizontal and diagonal support and resistance, as well as the boundaries of active chart patterns involve finding and drawing trend lines. Trend lines are typically drawn across peaks and troughs.
A valid trend line should have a minimum of three touches. The more touches of the trend line, the more validity it exists. However, the more a trend line is tested, there is an increase in the probability that the trend line will be broken. Broken trend lines result in a large move, as traders typically place stop loss orders below a trend line, expecting it to hold.
When performing crypto technical analysis, traders can draw the trend line across each candle close, or from wick to wick.
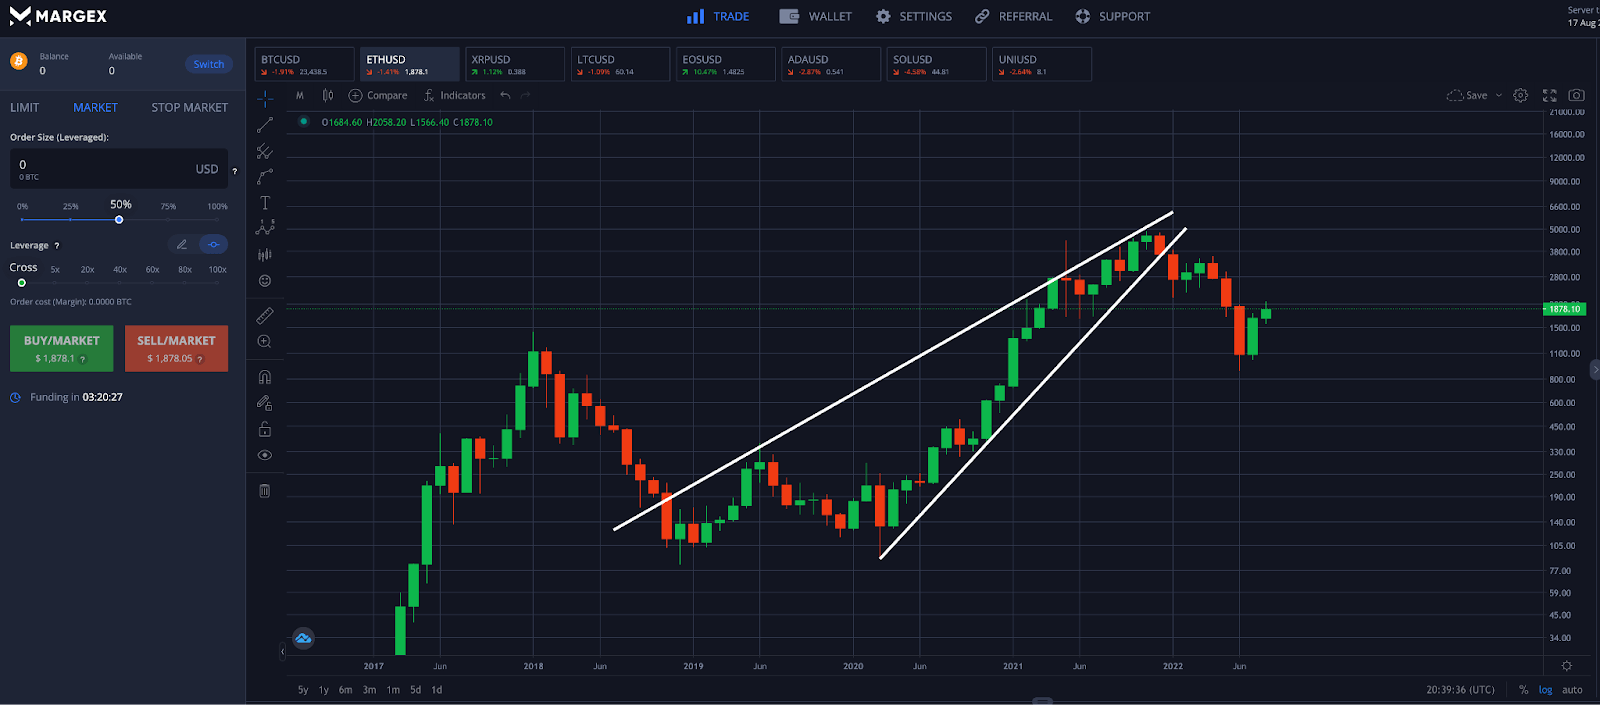
Chart Patterns
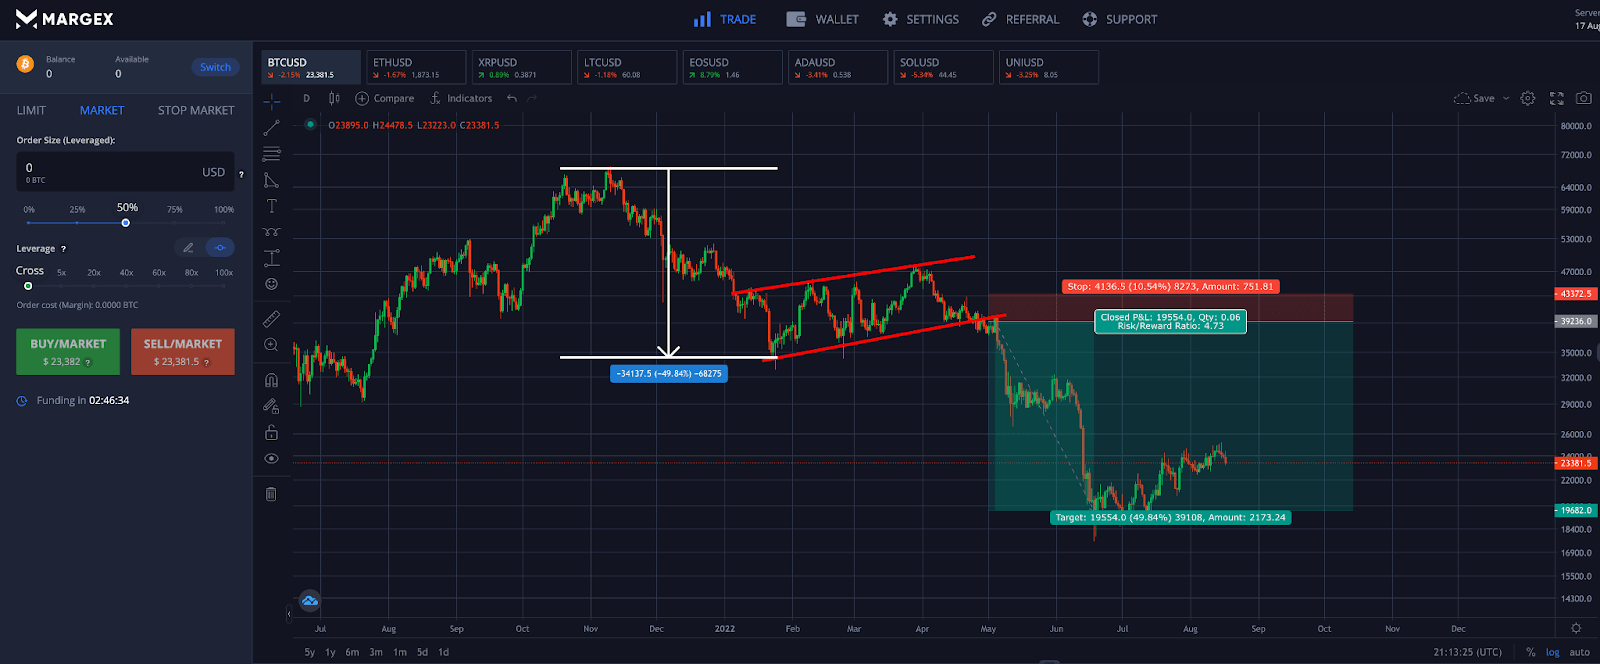
Trend lines can be used to discover chart patterns that can signal a potential move ahead. Common chart patterns include triangles, wedges, head and shoulders, and more.
Trading can combine chart patterns with Japanese candlesticks, trading volume, and technical indicators for further confirmation and confidence in a prediction.
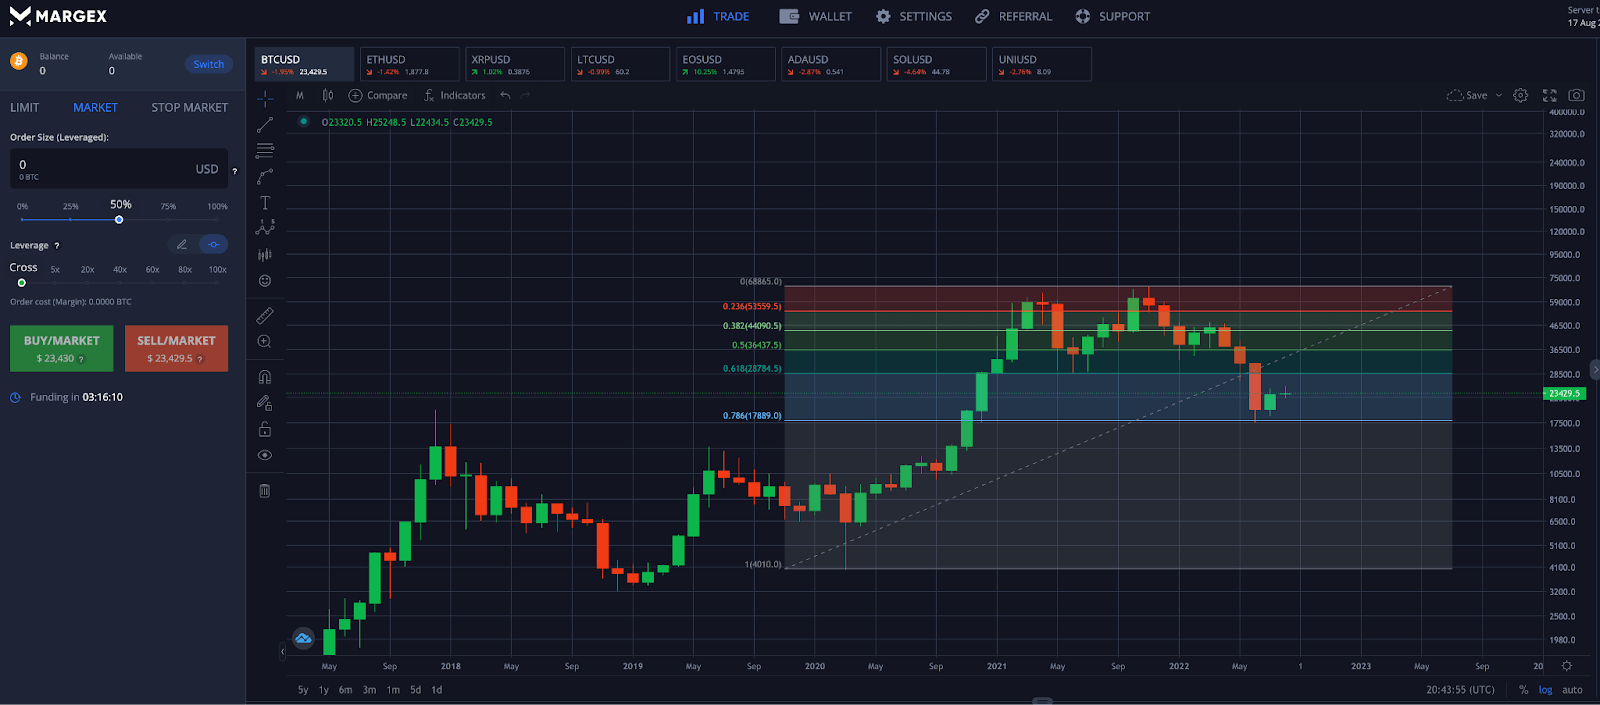
Fibonacci Retracement
Although it isn’t fully understood why, crypto technical charts show that prices regularly pullback to Fibonacci retracement levels, and trends more often than not end at Fibonacci extension levels.
Fibonacci retracement and extension levels are based on ratios of the Fibonacci sequence. Common Fibonacci retracement and extension levels include: 0.382, 0.5, 0.618, 0.786, 1, 1.272, 1.414, and 1.618.
The Most Popular Crypto Technical Indicators
A variety of handy technical analysis tools can be used to analyze and measure different aspects of the market, including price, time, volume, momentum, strength, volatility, and much more.
Here is a list of the most popular crypto technical analysis tools and what their readings indicate.
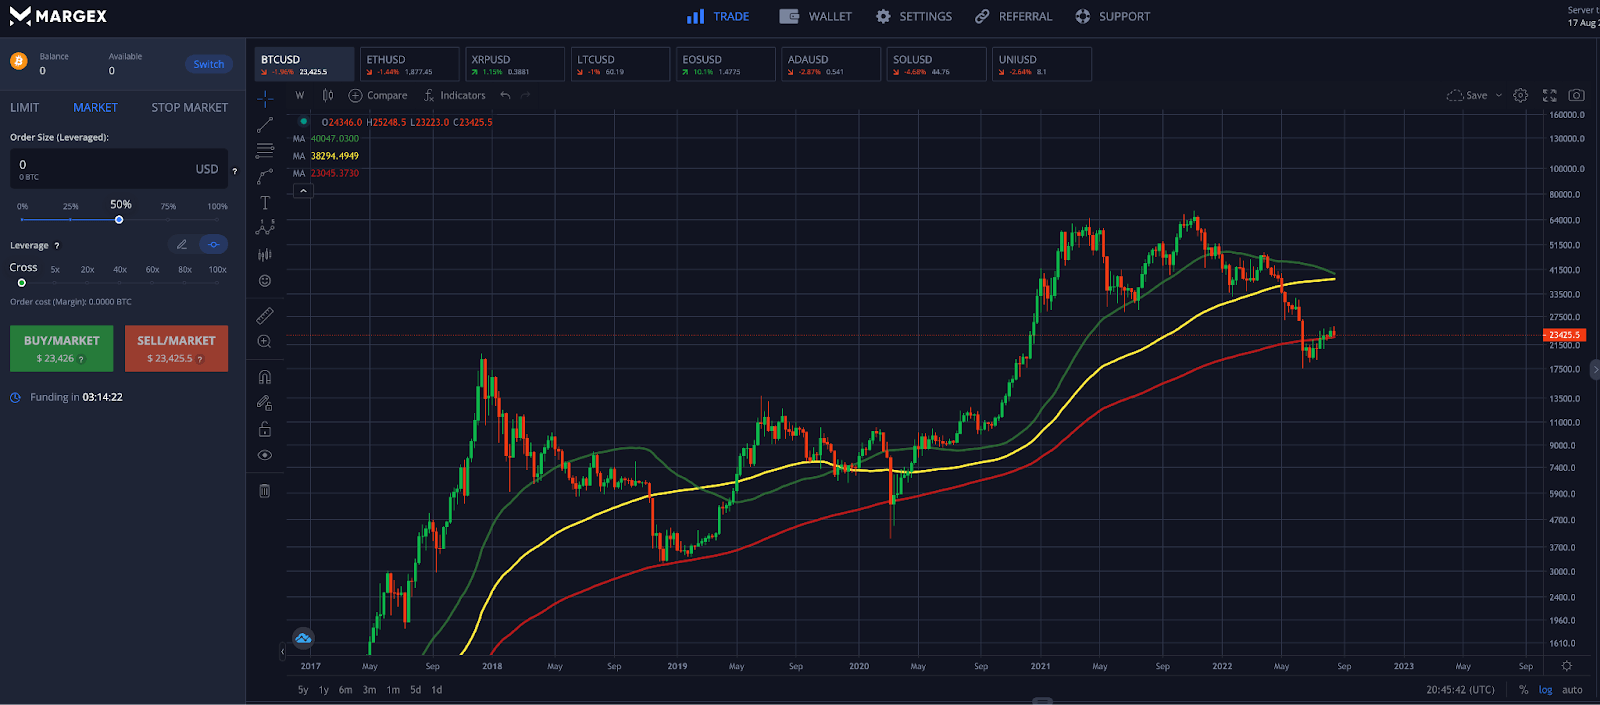
Moving Averages
Moving averages are among the most common technical analysis tools and are a visual representation of price averages across a specific time period. The visual lines oscillate upward and downward based on the average price and settings. Moving averages can be calculated as a simple moving average, exponential moving average, weighted, cumulative, triangular, centered, and more.
Moving averages can be set across an endless number of time frames with different results. Shorter-term moving averages can help with minor or secondary trends, while longer-term moving averages help indicate the primary trend. Medium-term moving averages when used in conjunction with a fast and slow moving average is used for confirmation of trend changes. Traders can take a position when prices pass through a moving average, or when the moving average begins changing direction.
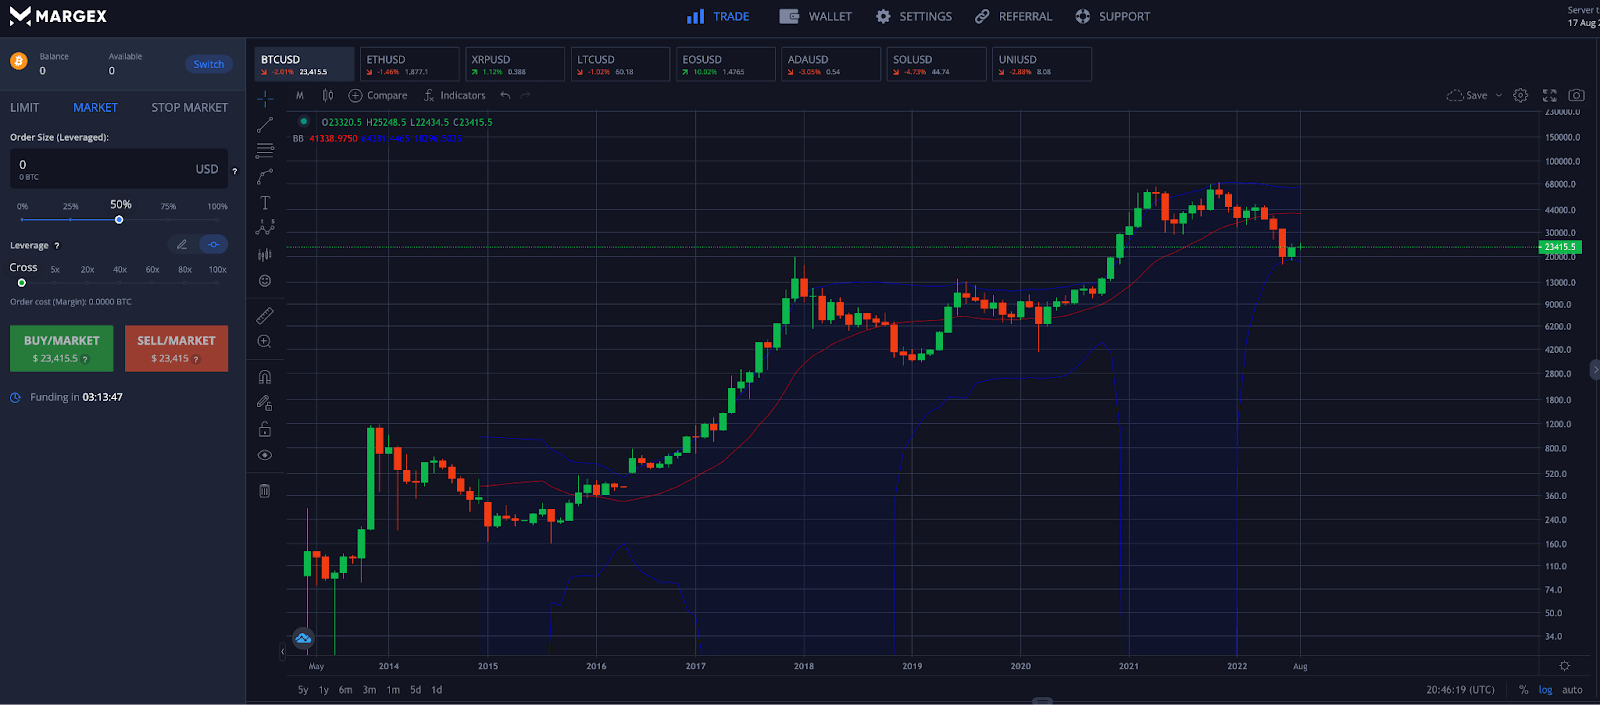
Bollinger Bands
The Bollinger Bands are price envelopes plotted at two standard deviations of a 20-period simple moving average. The technical analysis tool tells a trader if the price of an asset is high or low on a relative basis, how volatile the asset has been historically, provide potential support and resistance levels, and more.
The majority of price action takes place within the bands, making any movements near the upper or lower bands a possible area where a trend reversal could take place. Like standard moving averages, the middle-SMA can be used for buying or selling signals.
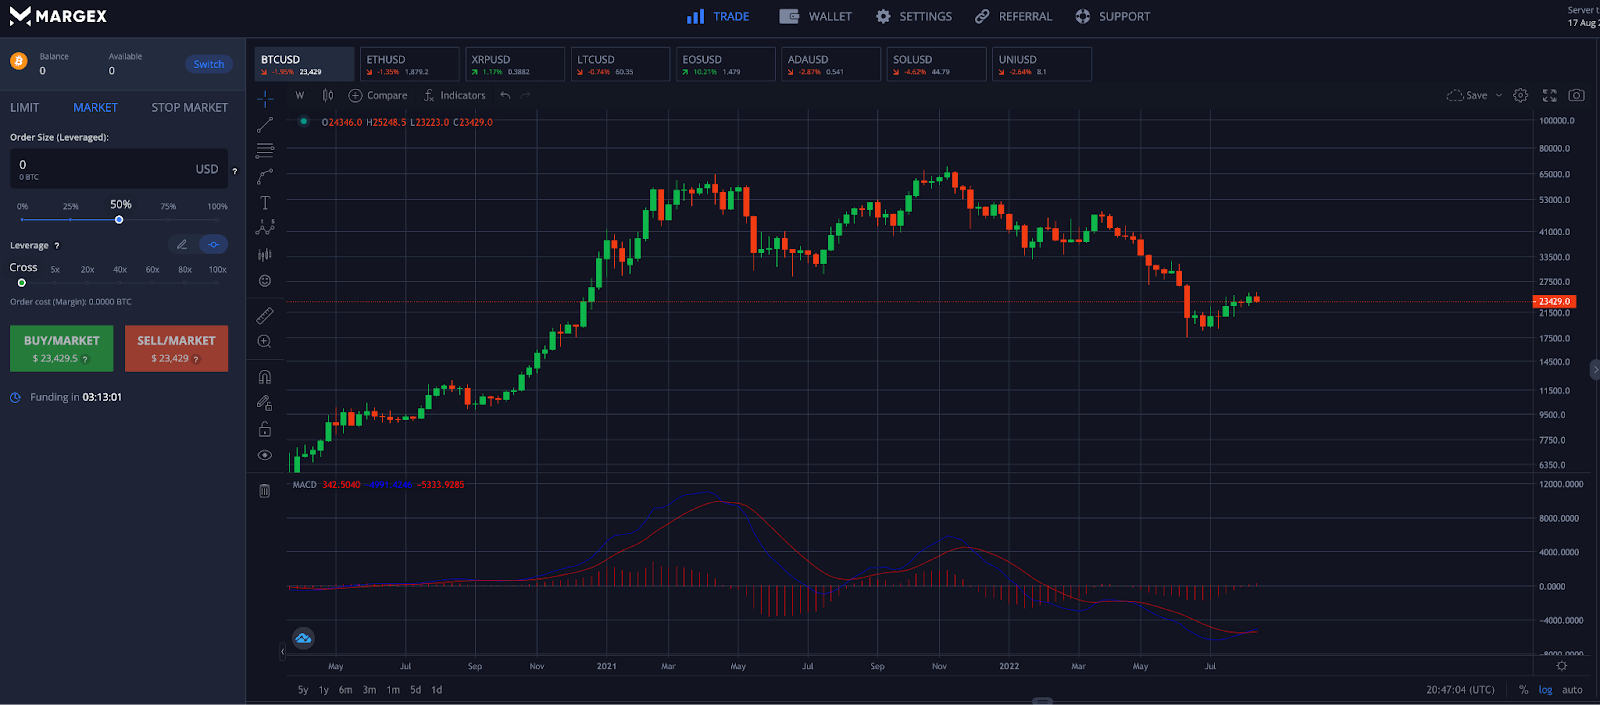
MACD (Moving Average Convergence Divergence)
The MACD is short for Moving Average Convergence Divergence indicator. The tool is a trend-following momentum indicator that often includes a histogram that measures the difference between the tool’s two moving averages.
The two moving averages are calculations called the MACD line and the signal line, which can provide various signals to the market. When the two lines are diverging, it means an asset is increasingly oversold or overbought. Converging can lead to crossovers of the two lines, which can generate a bullish or bearish signal. Buy or sell signals can also be generated when the MACD histogram passes through the zero line.
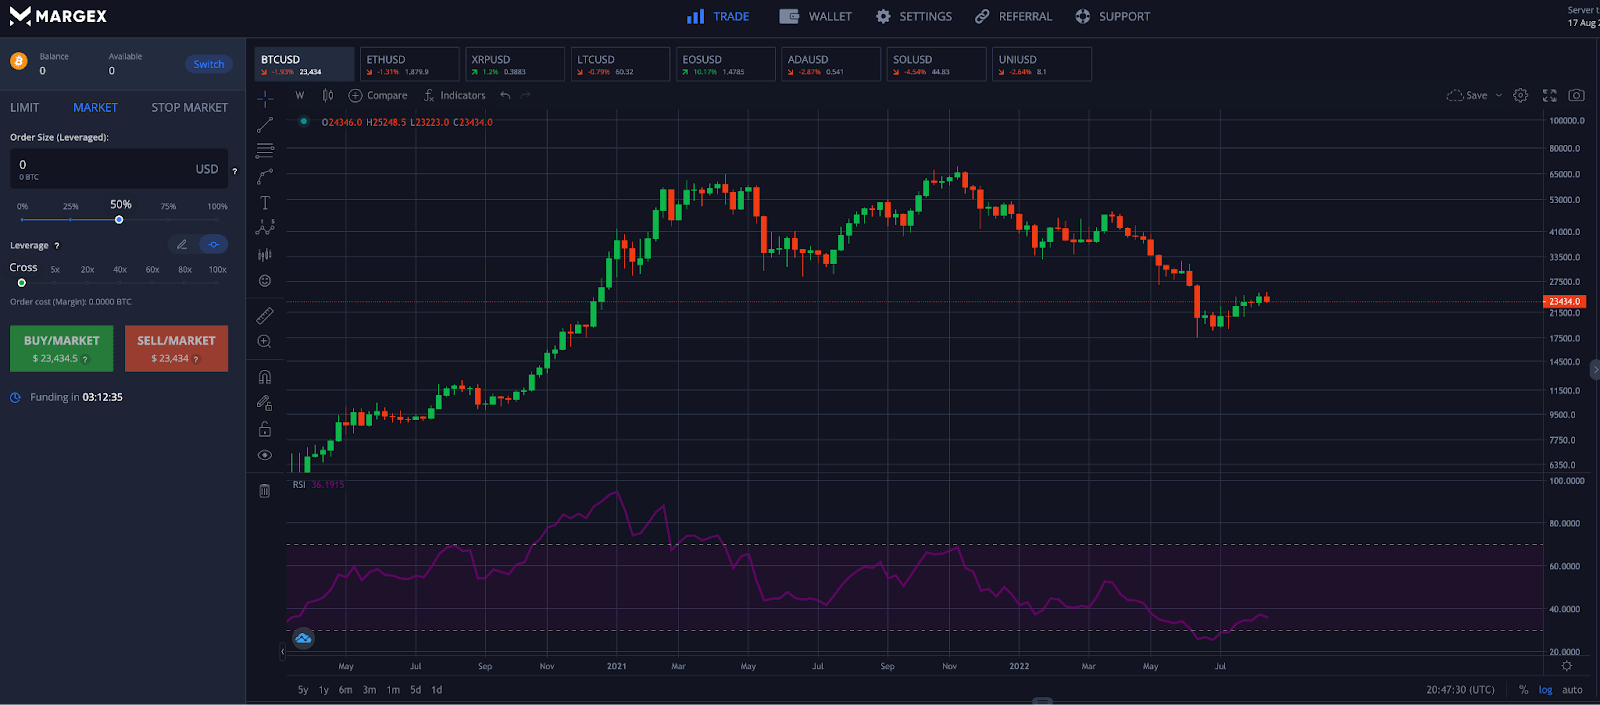
Relative Strength Index (RSI)
The Relative Strength Index is a momentum indicator in technical analysis measuring the velocity of price movements to signal if an asset is reaching overbought or oversold conditions.
It is a range-bound indicator offering readings between 0 and 100. Readings of below 30 are considered oversold, while readings above 70 are considered overbought.
The RSI gives clear buy or sell signals, and commonly gives regular and hidden divergences which can be additional signs of a reversal or continuation. The RSI works best in ranging markets, as trending cryptocurrencies can remain overbought or oversold for extended periods.
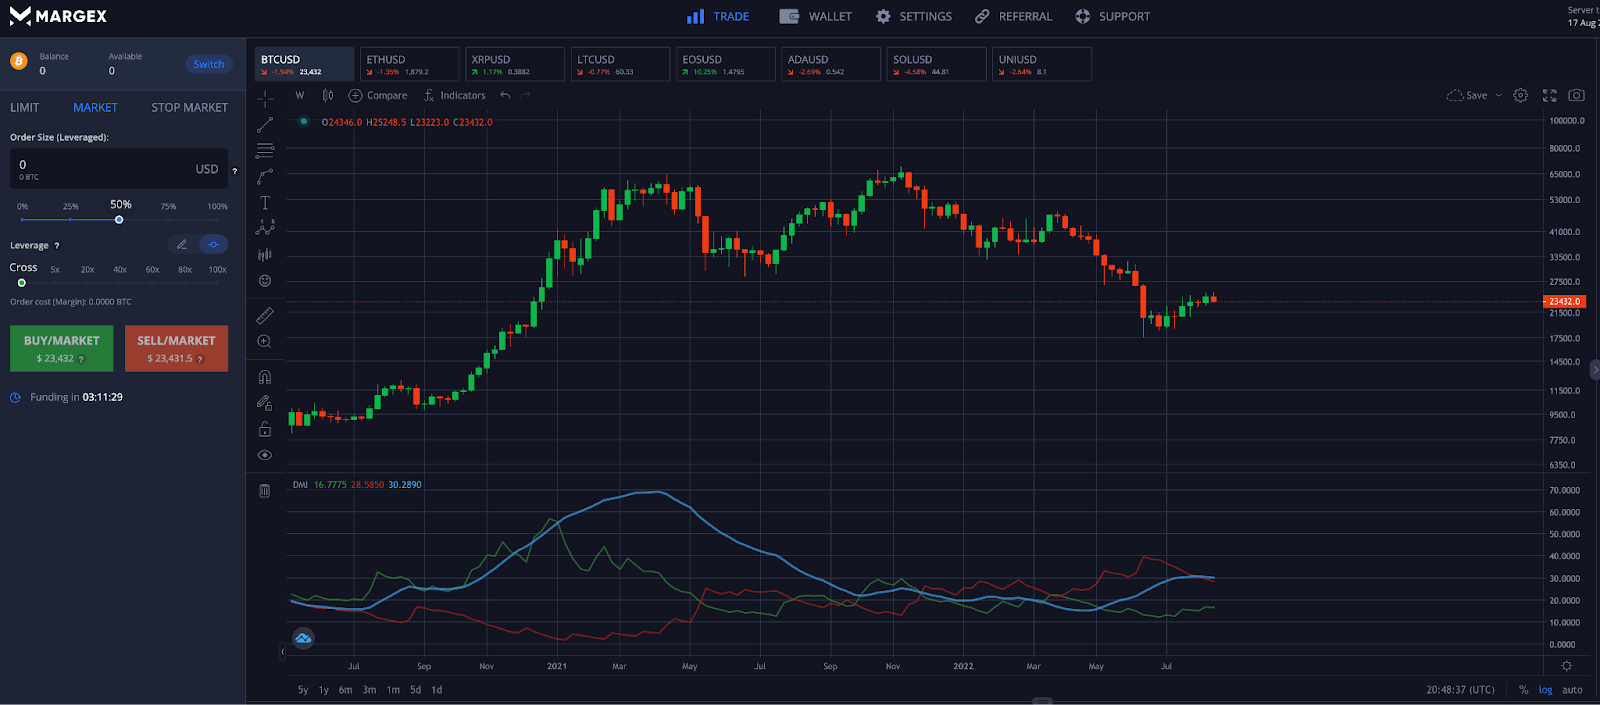
Average Directional Index (ADX)
The Average Directional Index (ADX) is a tool that measures the strength of a trend. Readings of above 20 suggest a trend is strengthening, while readings below 20 suggest a lack of a trend.
The ADX typically comes with a Directional Movement Index consisting of a DI+ representing bullish strength and a DI- representing bearish strength. The ADX is also used to tell a technical analyst to switch from trend-following tools to range-trading tools.
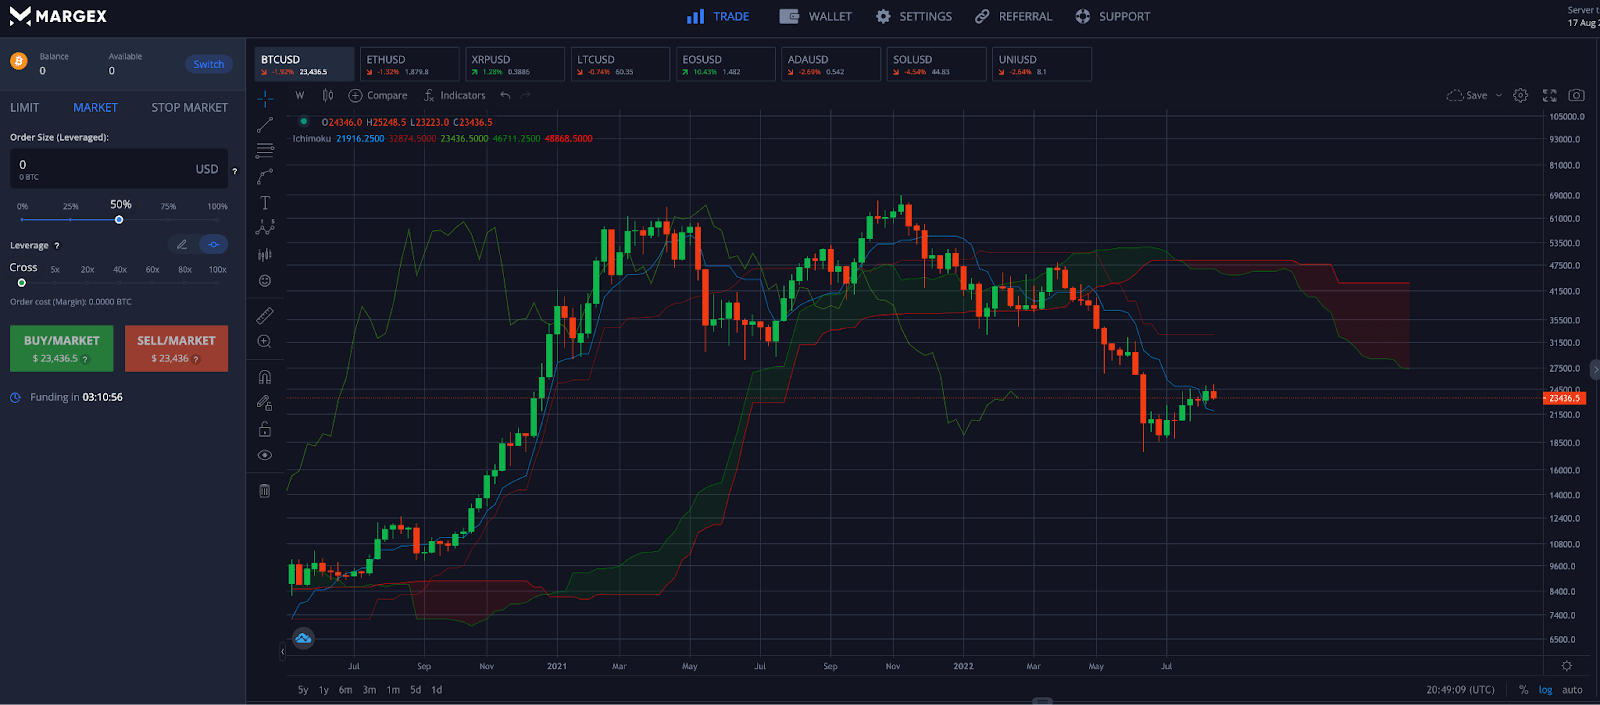
Ichimoku Cloud
The Ichimoku is a visual-based technical analysis system, offering an “at a glance” look at the overall balance of the market. The Ichimoku is famous for its “cloud” or Kumo, which expands or tightens based on price volatility.
The Ichimoku factors in time in addition to price. As a forward-looking tool, cloud twists can indicate a possible point of a trend change. The Chikou span is a back-plotted indicator that tells the analyst where possible support or resistance might be found. The Ichimoku also consists of a Tenkan-sen and Kijun-sen that act as minor and major resistance and support, and provide signals when crossed or depending on if price is above or below the lines.
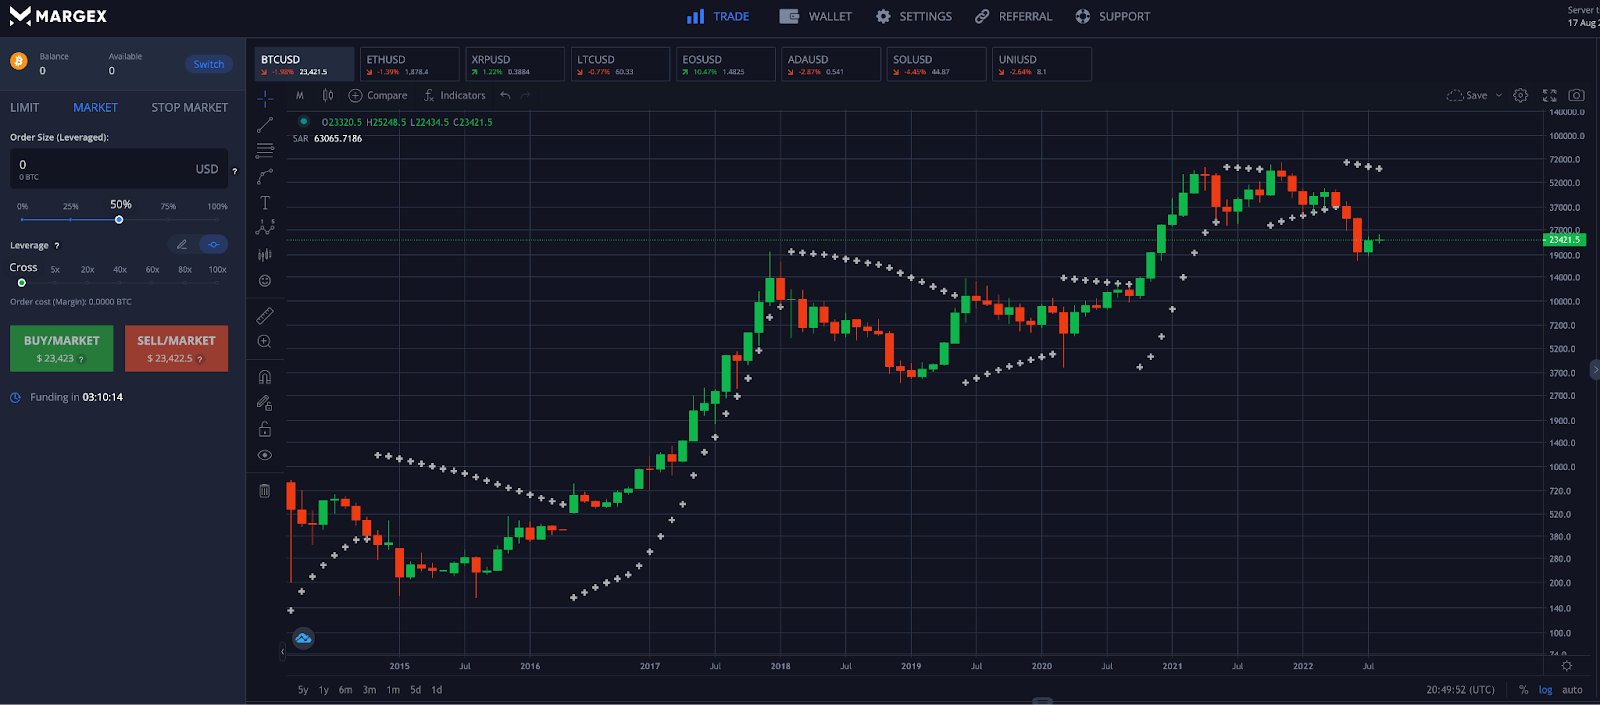
Parabolic SAR (Stop-And-Reverse)
The Parabolic SAR is a very simple to use visual tool that tells the analyst when a trend has possibly stopped and reversed, which is where the indicator gets the acronym in its name. SAR appears above or below the price action, supporting the trend and its parabolic growth.
When price passes through the SAR, the trend is thought to have stopped and reversed, and is a signal to close out positions. As such, the Parabolic SAR is regularly used as part of a trailing stop loss strategy, where the trader moves a stop loss directly below the SAR as it travels with the trend. If the stop is taken out, the trader might lose some of their profit, but are able to keep the majority of it rather than losing it all in a trend reversal.
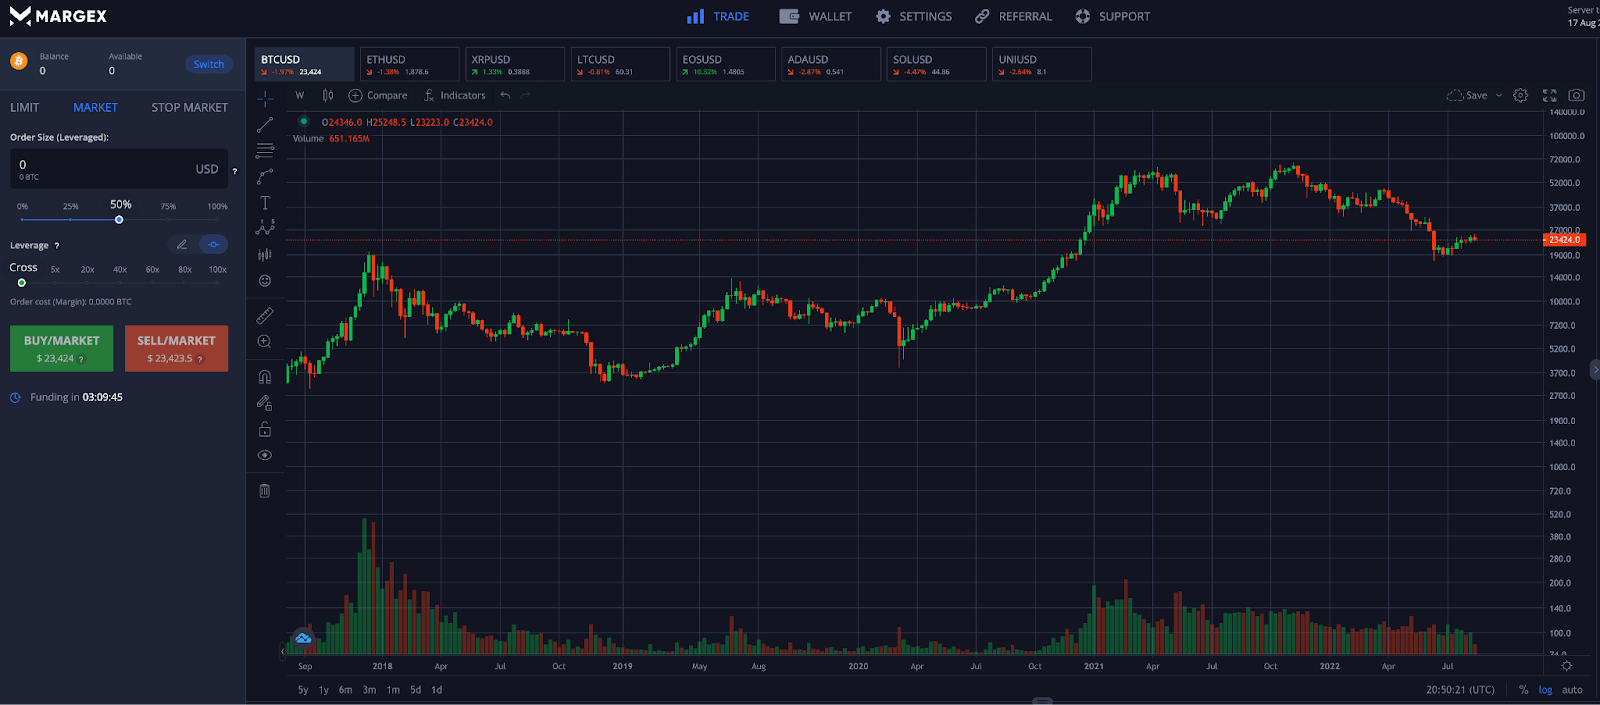
Volume
Trading volume is often regarded as even more important than price and this is because volume always confirms price action and breakouts. The idea is that volume will increase before price action can react. Volume increases with market participation.
Increasing volume is a signal that a pattern is confirmed or a trend is validated, which tells other market participants to join and further increases trading volume. Low or decreasing volume is often a sign that interest is waning or non-existent, and prices could reverse to a level where volume does finally begin to increase once again.
Fundamental Analysis Versus Technical Analysis For Crypto
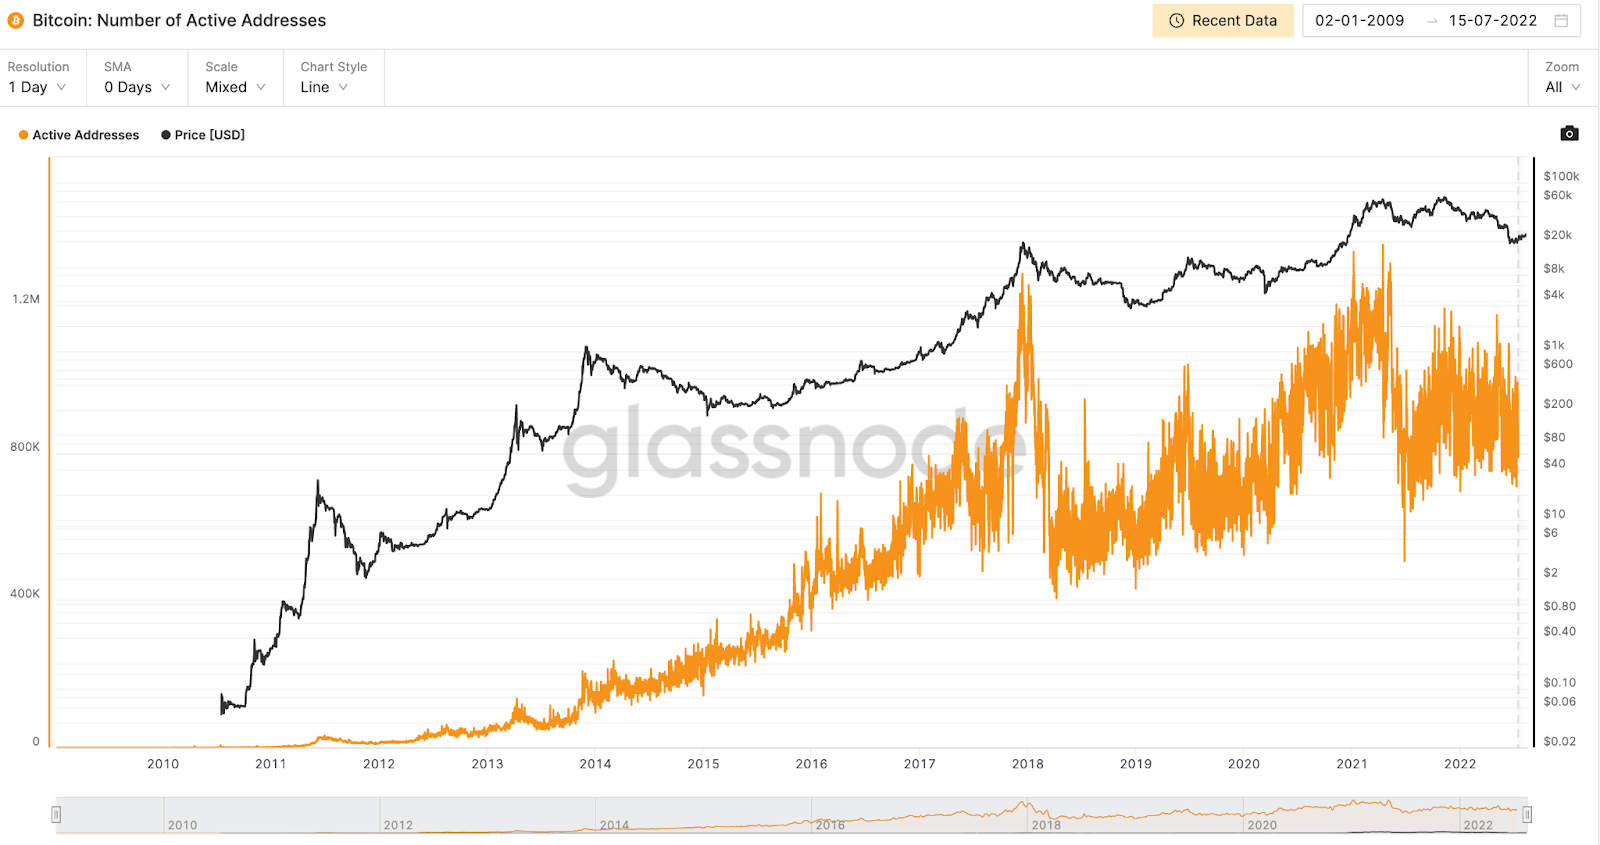
In addition to technical analysis, another form of crypto trading analysis is fundamental analysis. This type of analysis can get investors and traders informed about certain fundamental factors, such as network capacity and throughput, growth in active addresses, regulatory support, blockchain upgrades and forks, or changes in the team behind a crypto project.
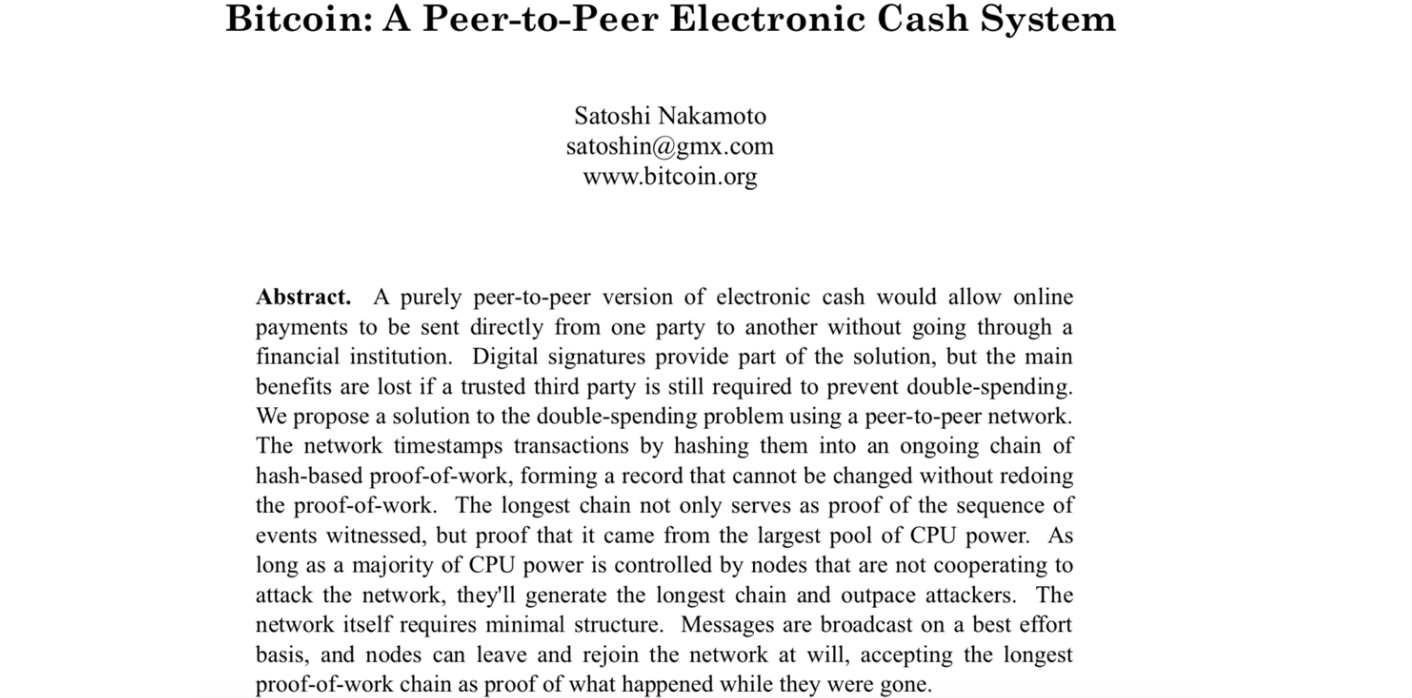
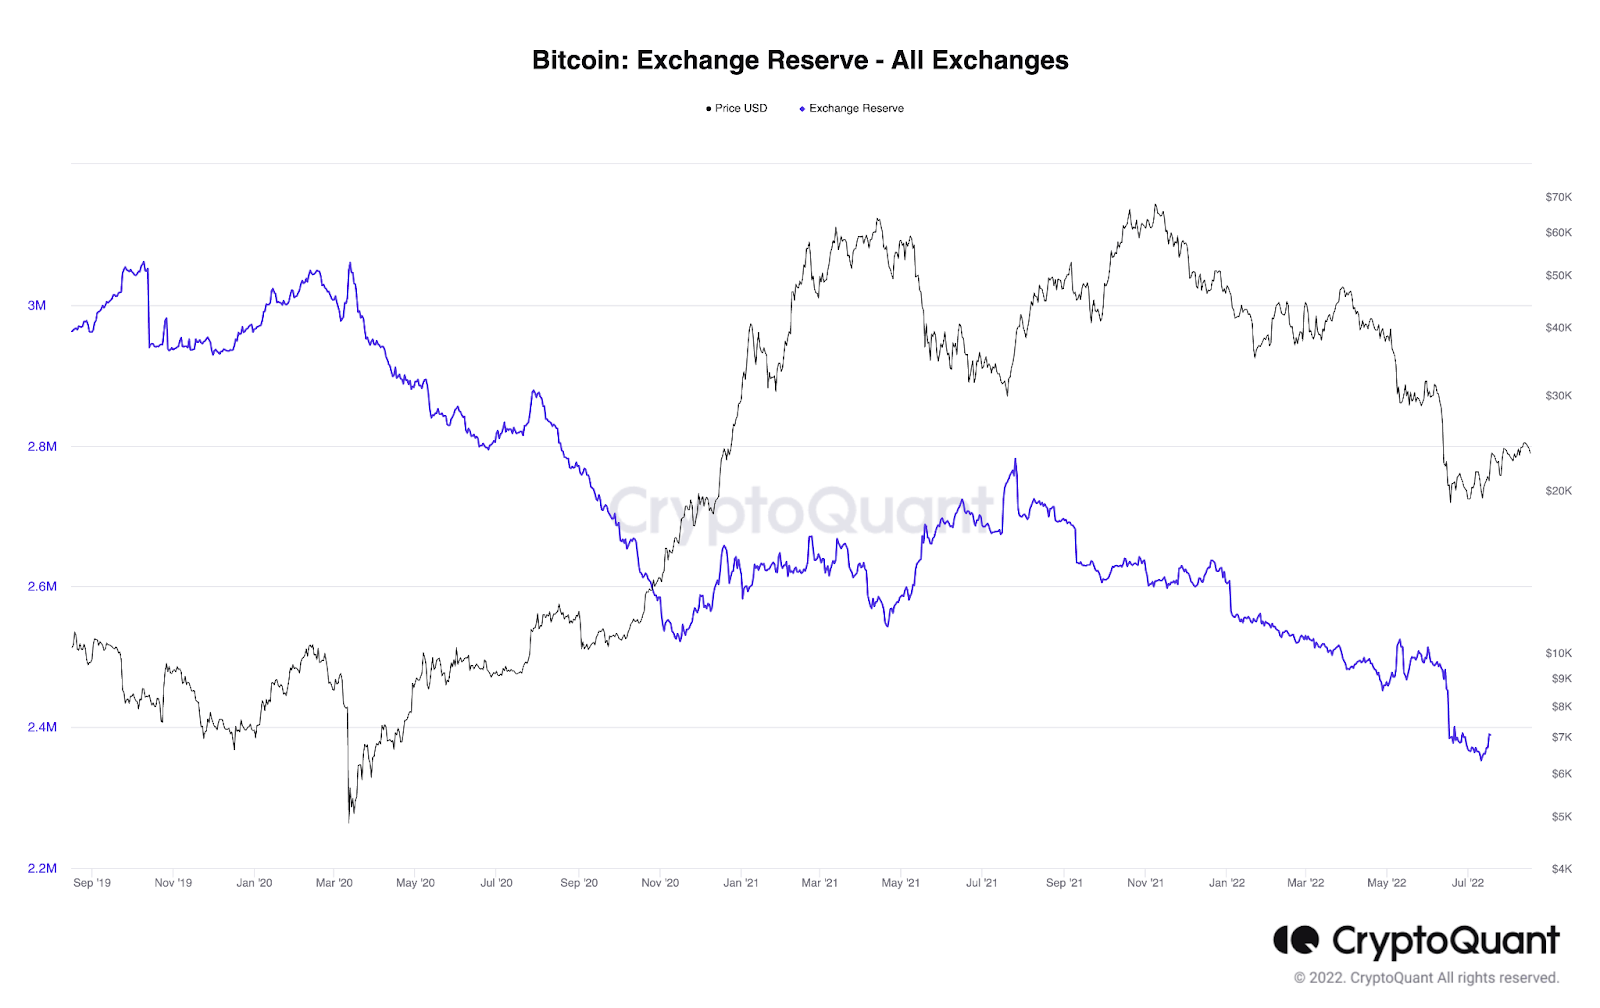
Fundamental analysis includes reading whitepapers, researching a coin’s community, supply and issuance, and much more. Fundamental analysis is further broken down into qualitative and quantitative analysis. Qualitative analysis is more gut-based, such as liking the character of the CEO behind a project or due to expecting a certain category or sector to take off. Such information cannot be quantified for measuring. Quantitative analysis is the study of data that can be quantified. Cryptocurrency inflows and outflows are an example of such type of analysis.
Technical analysis is typically used for a variety of time horizons, from short to long-term, while fundamental analysis is considered on a much longer timespan. Technical analysis can be used to confirm that price action supports the underlying fundamental value of an asset. Therefore, the most effective investing and trading strategies incorporate both fundamental and technical analysis.
Other Types Of Cryptocurrency Market Analysis
While fundamental and technical analysis represent the two most important pillars of cryptocurrency analysis, there are several other types of market analysis to consider:
On-Chain Analysis
On-chain analysis can be considered part of fundamental analysis under the quantitative analysis category, but deserves its own callout here due to on-chain analysis being unique to cryptocurrencies.
On-chain analysis looks at the growth of active addresses, hashrates, supply issuance, and much more.
Macro Analysis
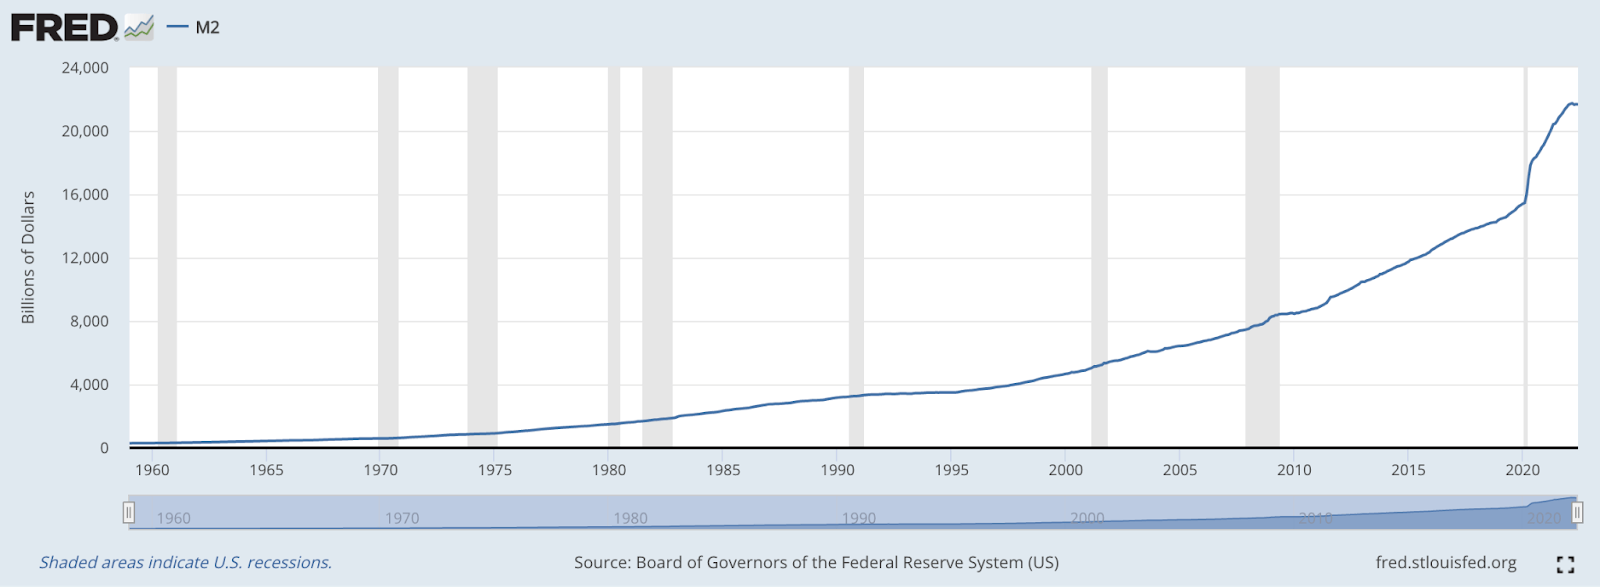
Macro analysis is critical to investing and trading, as it can help set the tone for why a trend has changed. Major macro events can have a dramatic and unexpected impact on markets.
For example, the COVID pandemic and the resulting monetary stimulus and zero interest rates created a bull market in risk assets like stock and crypto. But when the US Fed announced the start of quantitative tightening and interest rate hikes, the market collapsed.
Intermarket Analysis
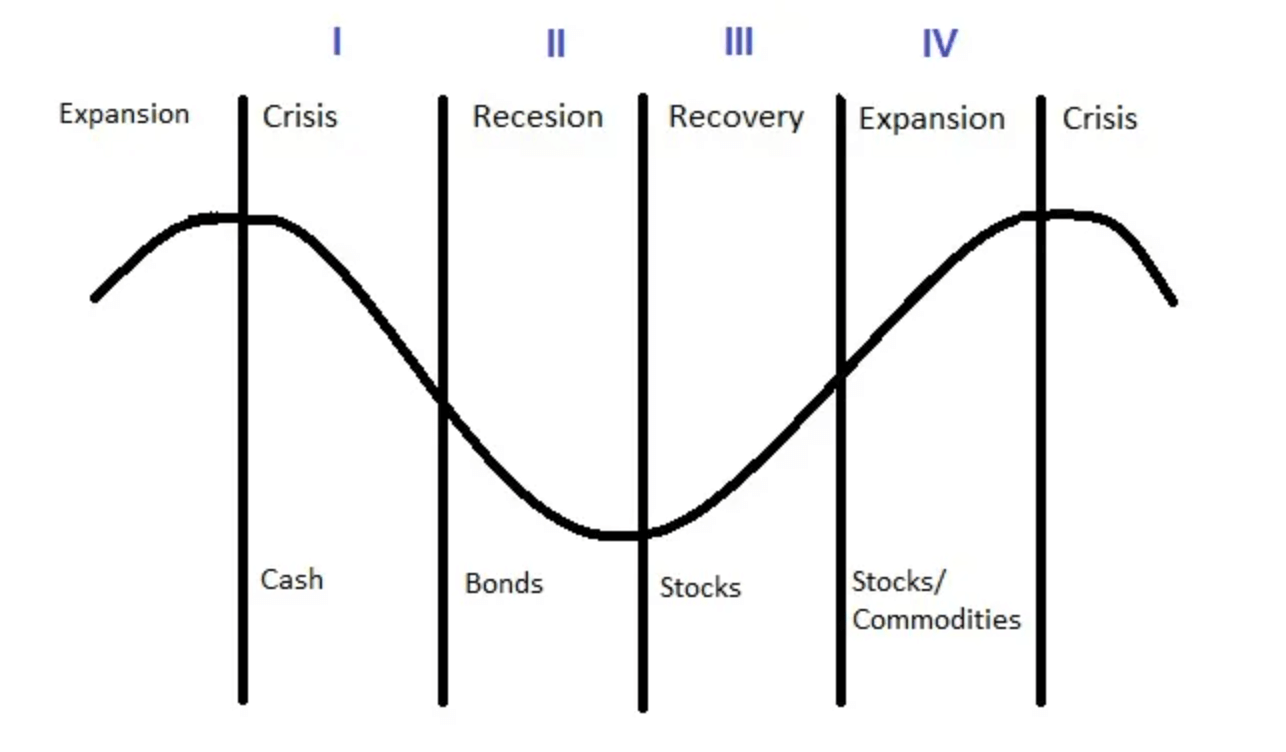
Intermarket analysis looks at things like correlations to other markets, and the impact of other important instruments and their impact on the overall financial market. Intermarket also analyzes the cyclical behavior and rotation of capital flows from one market to another.
For example, bonds tend to bottom or top first, followed by cryptocurrencies, then stock indices, with commodities rolling over next, and capping it all off with currencies before the cyclical rotation repeats.
Sentiment Analysis
Sentiment analysis includes looking at the overall emotional response of social media followers, cryptocurrency communities, and investors. Investing legends like Warren Buffett use sentiment to gauge when to buy or sell. For example, Buffett recommends being greedy when the market is fearful, and fearful when the market is greedy.
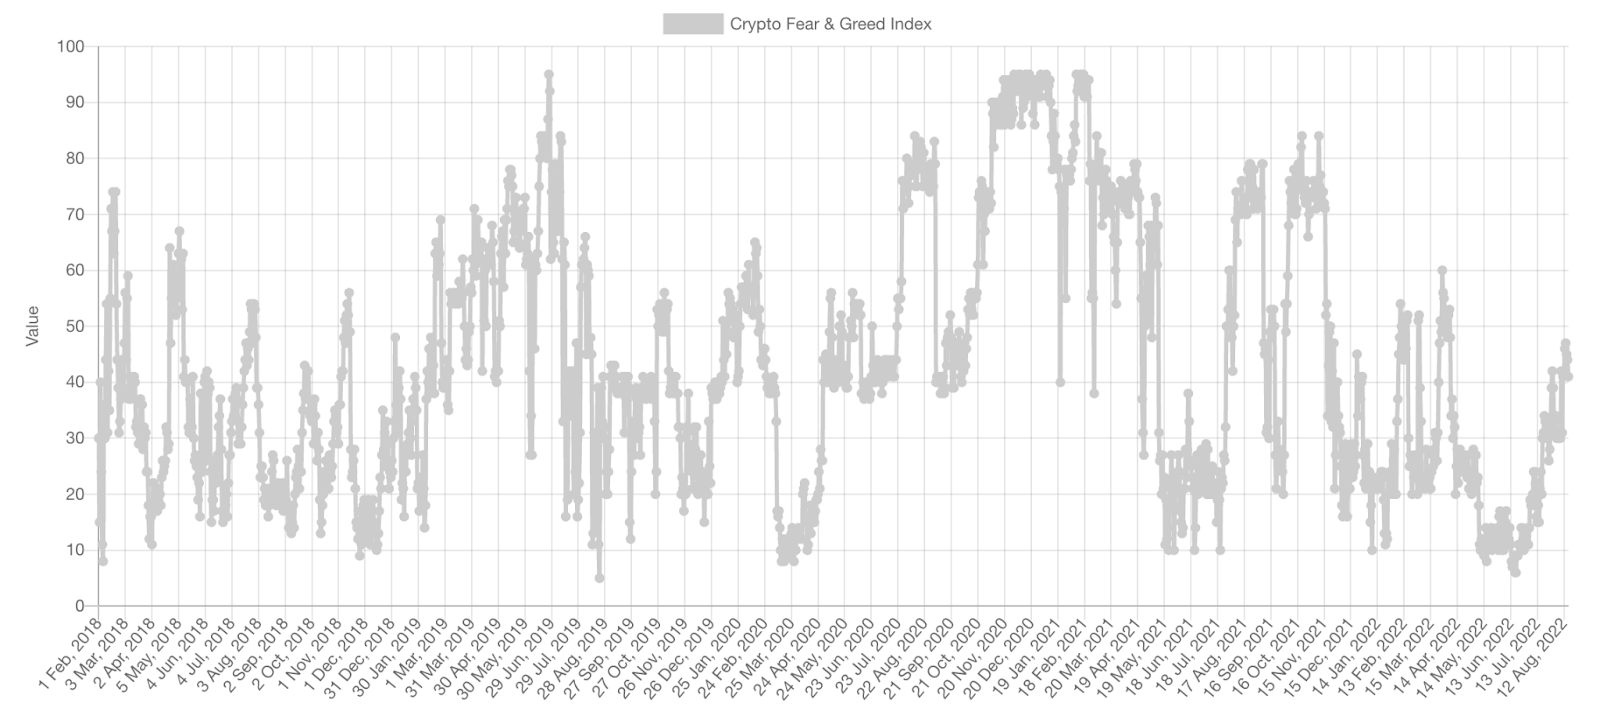
Tools to measure sentiment include the Crypto Fear and Greed Index. However, the best analysis comes from raw human emotion and paying close attention to the media. An example of this is called the Magazine Effect, in which by the time a magazine cover began talking about a bear or bull market, the trend was nearing its conclusion. Contrarian traders take positions opposite the aggregate sentiment due to the herd mentality being incorrect more often than not.
Margex Technical Analysis Cryptocurrency Tutorial: A Step-By-Step Guide
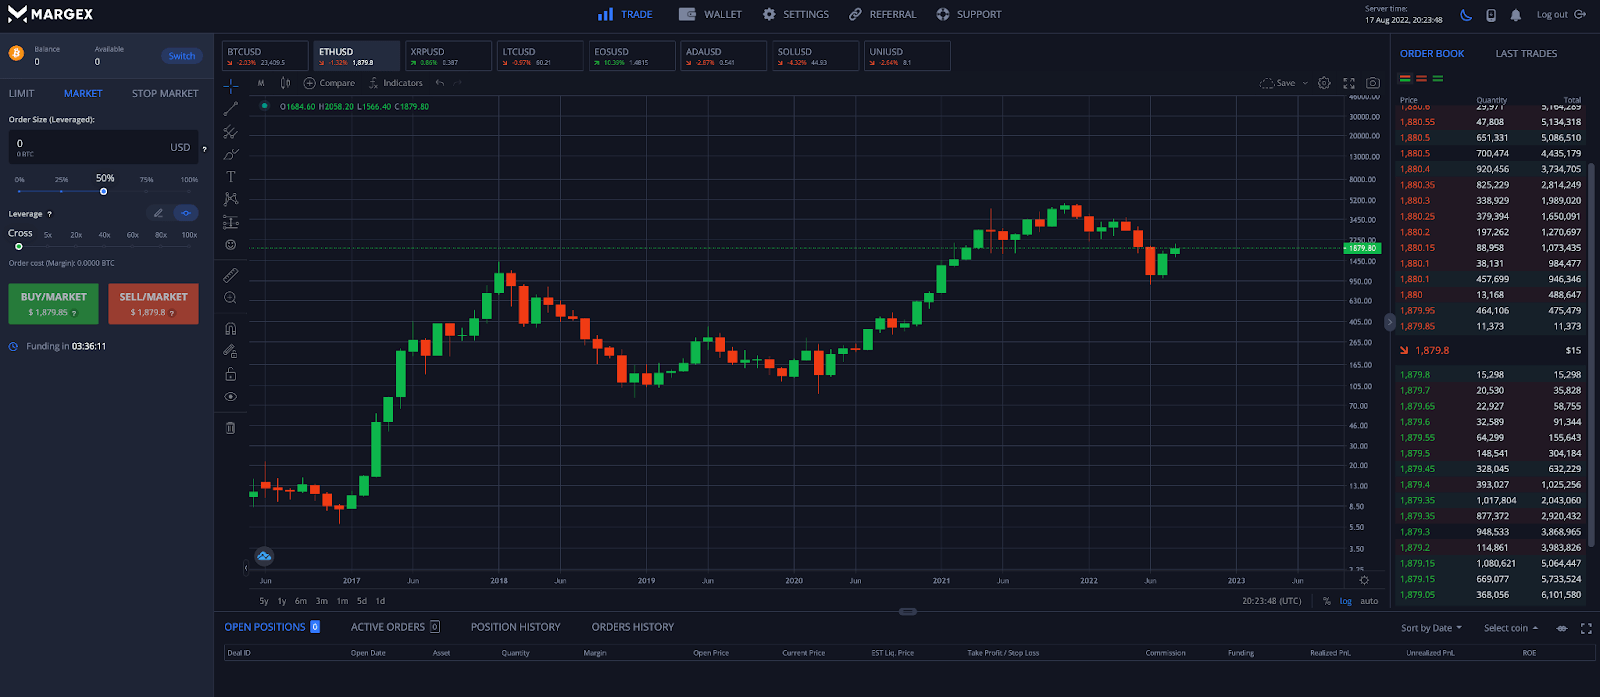
The Margex margin trading platform offers built-in technical analysis tools and dozens of built-in trading indicators. The below example will walk you through how to perform technical analysis yourself using these powerful tools.
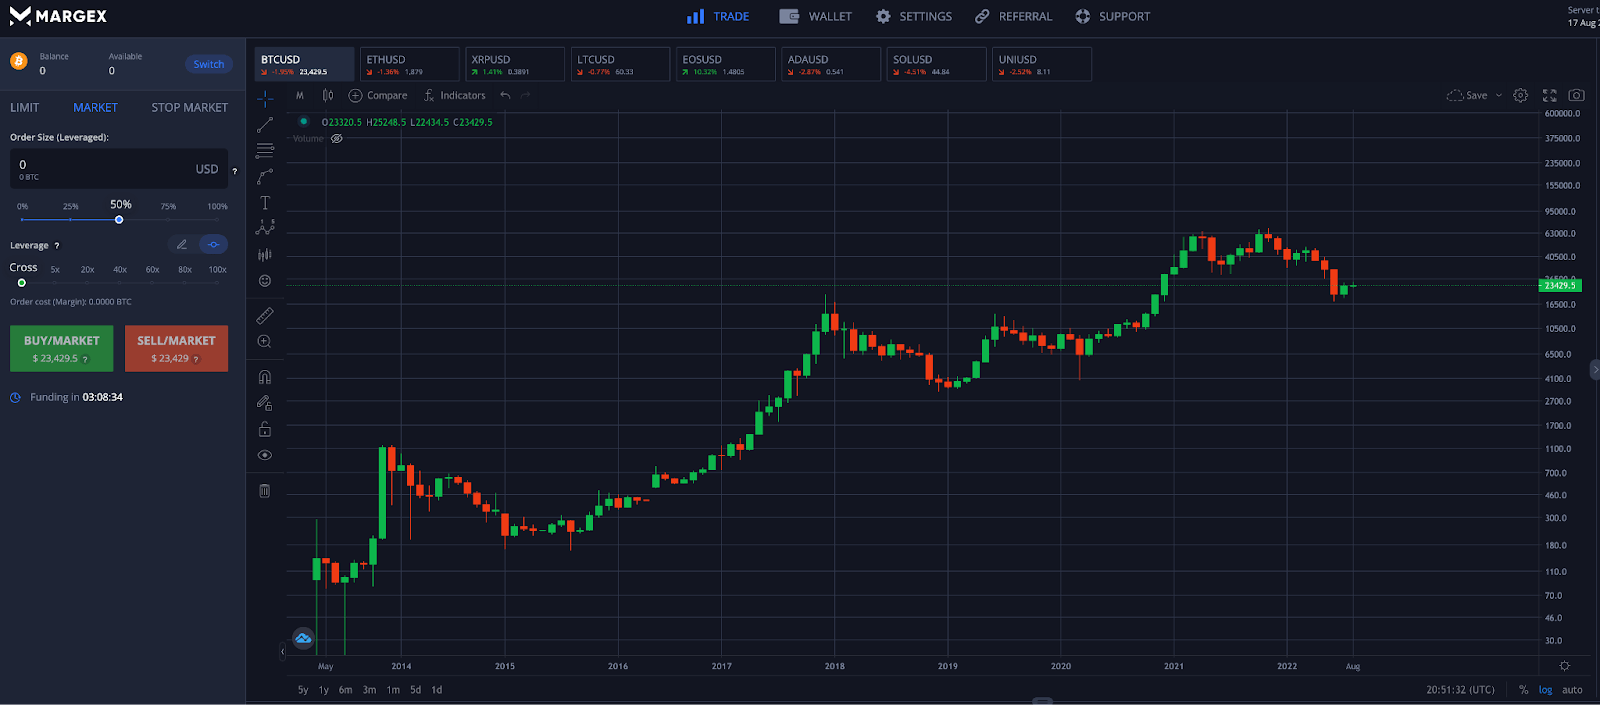
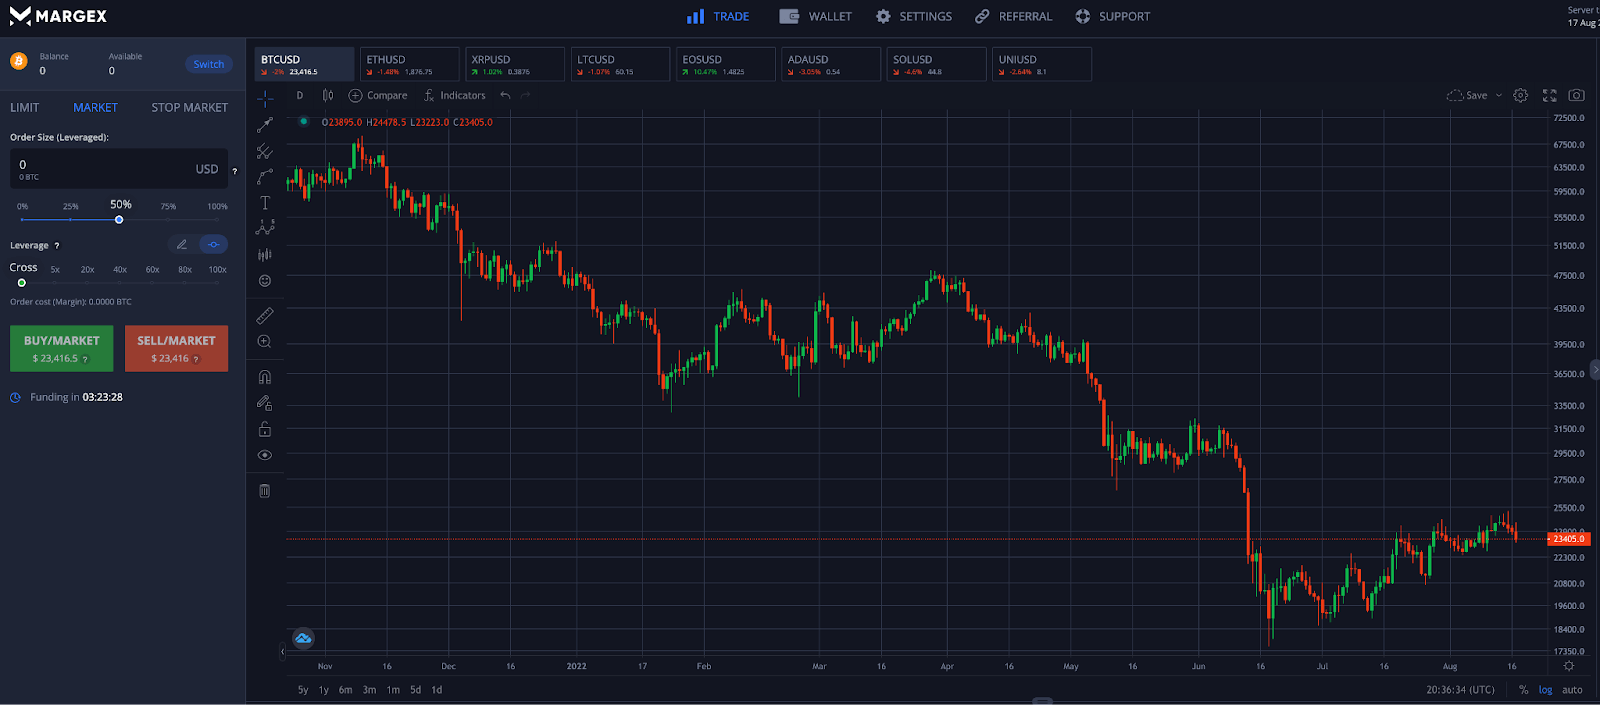
Step 1 - Open up the Bitcoin (BTC) chart, or another cryptocurrency of your choosing offered by Margex.
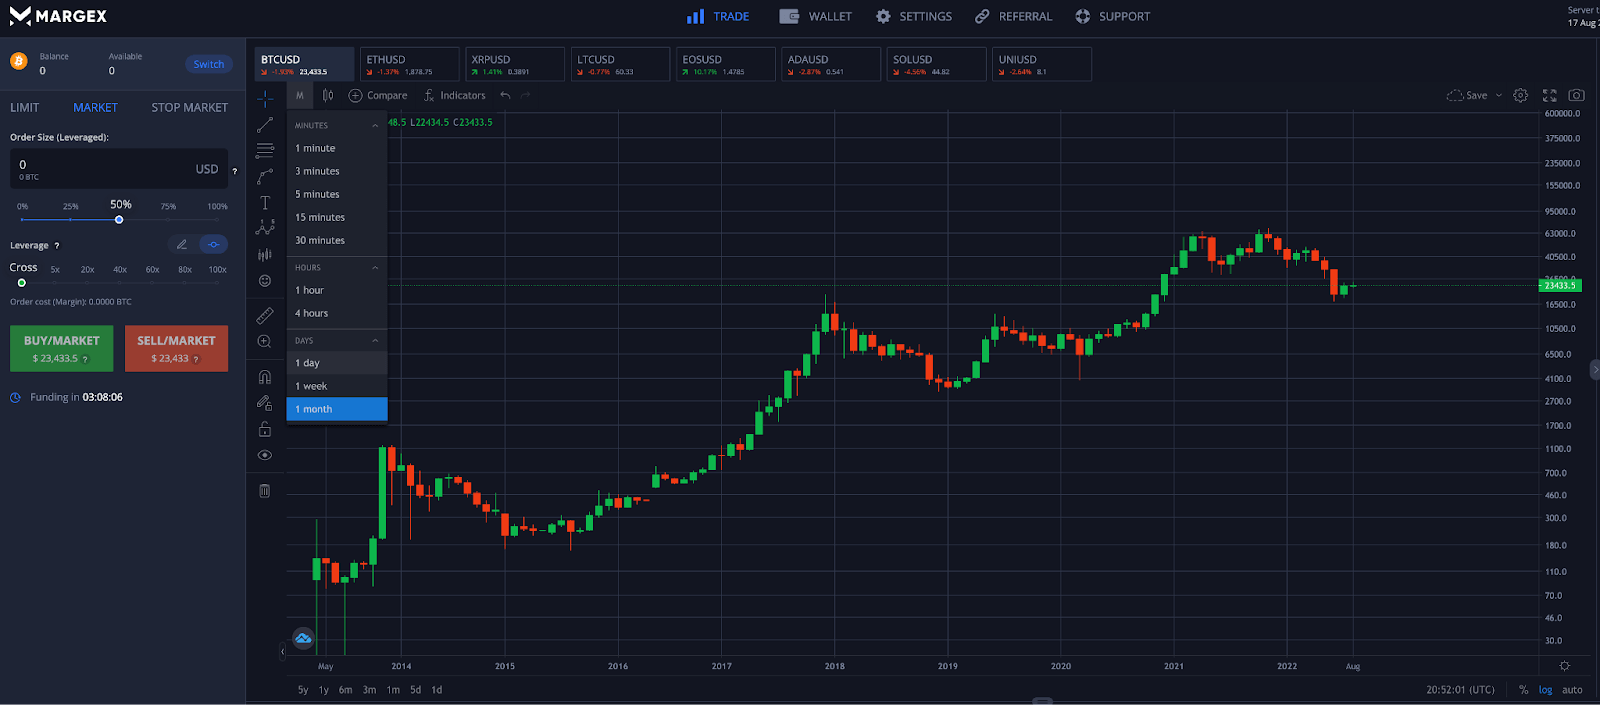
Step 2 - Select the timeframe you would like to analyze. Users can toggle between lower timeframes (minutes, hours), medium timeframes (4-hour, daily), and higher timeframes (weekly, monthly).
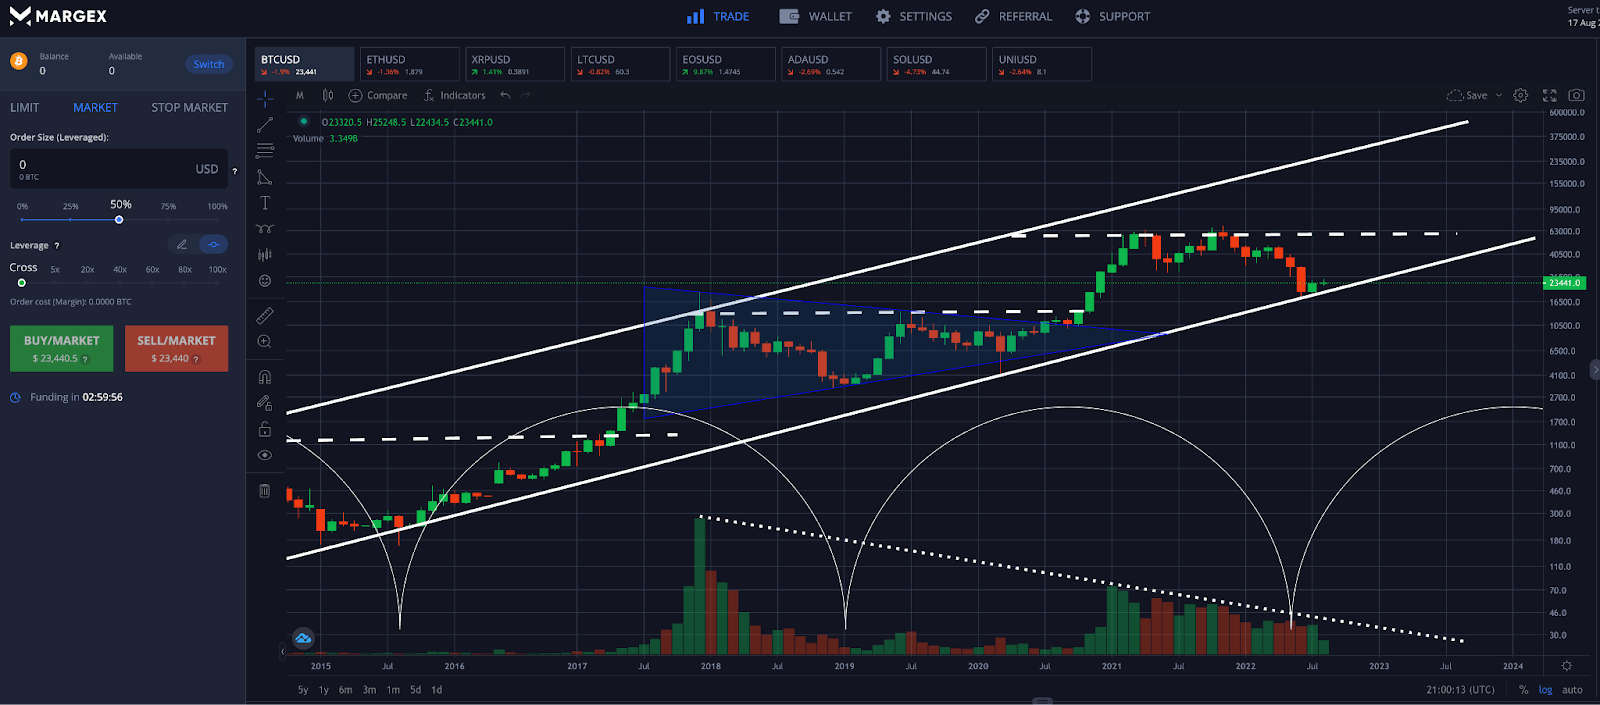
Step 3 - Begin drawing trend lines, outlining chart patterns, and reviewing the formation of Japanese candlesticks. Be sure to turn on the trading volume overlay.
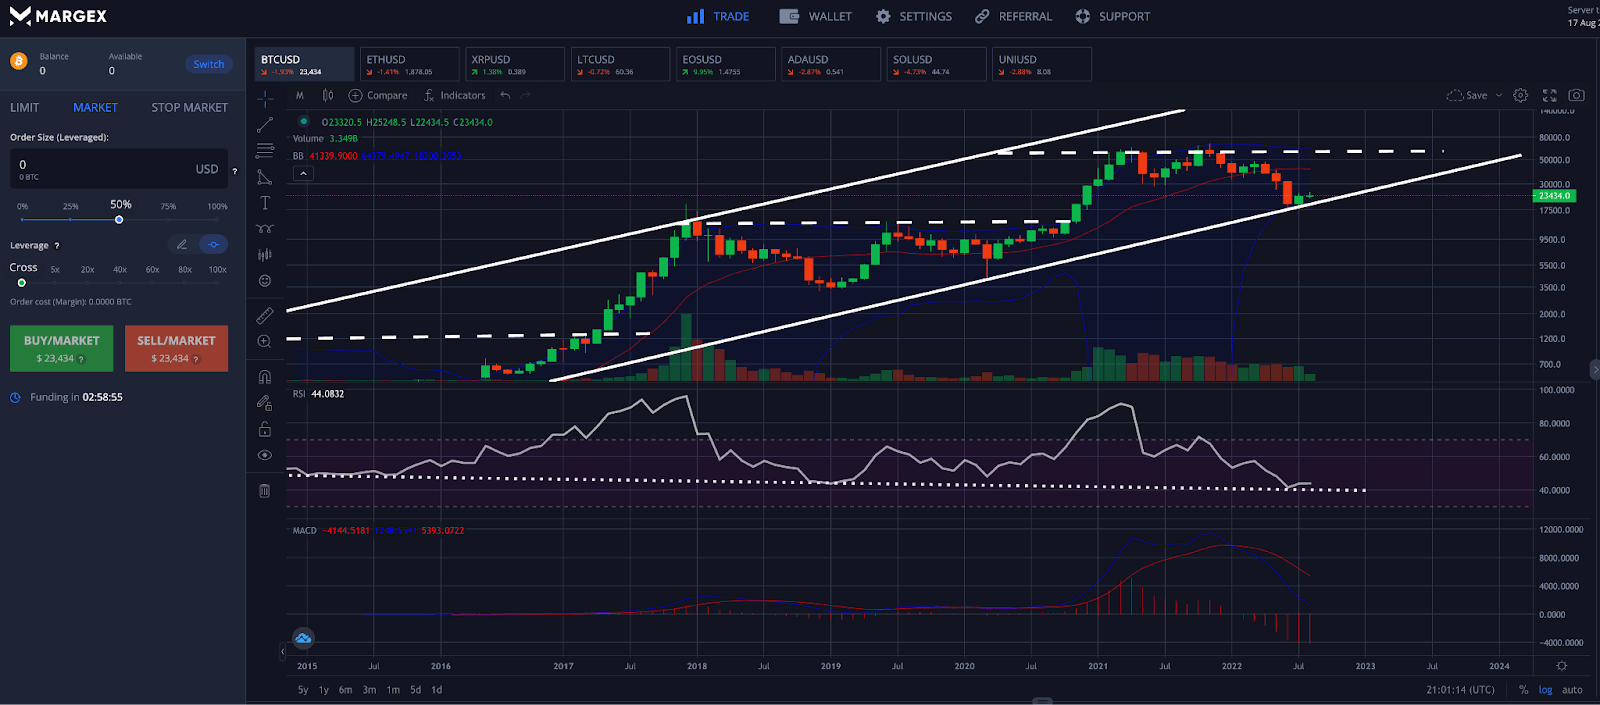
Step 4 - Activate technical analysis indicators such as the Relative Strength Index, MACD, Bollinger Band, Ichimoku Cloud, Parabolic SAR, or others. Try various technical indicators to see which works the best for you.
Technical Analysis Crypto FAQ: Commonly Asked Questions About Crypto Price Charts And Trading Indicators
The art of technical analysis is vast. There are hundreds of chart patterns and Japanese candlestick formations, in addition to thousands of technical indicators.
In case there are any lingering questions after reading the Margex beginner’s guide to technical analysis, we’ve prepared this crypto technical analysis FAQ.
Does technical analysis work on crypto?
Cryptocurrencies respond to technical analysis better than most other asset classes, due to their speculative nature. The emerging asset class and technology is incredibly disruptive, with enormous potential. This makes finding a fair market value more challenging and is driven more by human emotion and psychological support and resistance levels.
How do I learn crypto technical analysis?
Practice makes perfect, and consistency is key. Begin experimenting with technical analysis tools immediately, while referencing the above beginner’s guide. Consider buying additional books on technical analysis, or pay for an educational course. To learn technical analysis for a professional career setting, you can also register to become a Chartered Market Technician.
Is technical analysis different for cryptocurrency?
Typically, technical analysis in cryptocurrency is no different than TA in other asset classes, aside from the fact that speculative assets in price discovery can stay overbought or oversold for extended periods of time.
Which type of analysis is best for cryptocurrency trading?
Although there are many forms of analysis, including fundamental, sentiment, macro, intermarket, and technical analysis, TA is hands-down the best for cryptocurrency trading. Other forms of analysis are too focused on the longer-term picture, and don’t provide enough actionable information about intraday price action.
What are the most popular crypto trading indicators?
The most popular technical analysis tools for crypto include the Relative Strength Index, MACD, Bollinger Band, Ichimoku Cloud, Parabolic SAR, and more. Be sure to experiment with each indicator to see what your preference is, and research if there are any custom settings for crypto.