Traders are usually aware of more commonly discussed technical analysis chart patterns such as the triangle, flat, or wedge. However, technical patterns can range from simple to extremely complex.
Harmonic patterns are distinct geometric shapes that feature measured moves that relate precisely to Fibonacci ratios. Harmonic patterns give traders an edge in markets by allowing them to predict the outcome of future movements ahead of time, potentially making positions more profitable with the right preparation and trading plan. Types of harmonic patterns include the bat pattern, butterfly pattern, shark pattern, crab pattern, gartley pattern, three drives pattern, five drives pattern, and A-B = C-D patterns.
In this guide, we are looking specifically at the butterfly pattern, a harmonic trading pattern that can form ahead of strong bearish or bullish reversals. The guide will help you to understand how to identify and trade the butterfly harmonic pattern.
What Is The Butterfly Chart Pattern? Harmonic Patterns Explained
The butterfly is a harmonic chart pattern consisting of four legs labeled X-A, A-B, B-C, and C-D. The use of each leg helps a trader to identify the pattern, and more importantly, where in the pattern price action currently is. Butterfly patterns are typically reversal patterns, which can be bearish or bullish depending on the direction leading into the move and its resulting shape.
The harmonic butterfly pattern involves measuring movements using Fibonacci extensions and Fibonacci retracements across each leg in order to properly identify the pattern. A common trading strategy is typically to take a position only after the completion of the C-D leg, with traders placing a stop loss below the D point.
Types Of Butterfly Patterns
Like most technical analysis patterns, there is a bullish and a bearish version of the harmonic butterfly pattern. However, there is no neutral version, as it is more typically found after an extreme move and acts as a reversal setup.
Bullish Butterfly Pattern
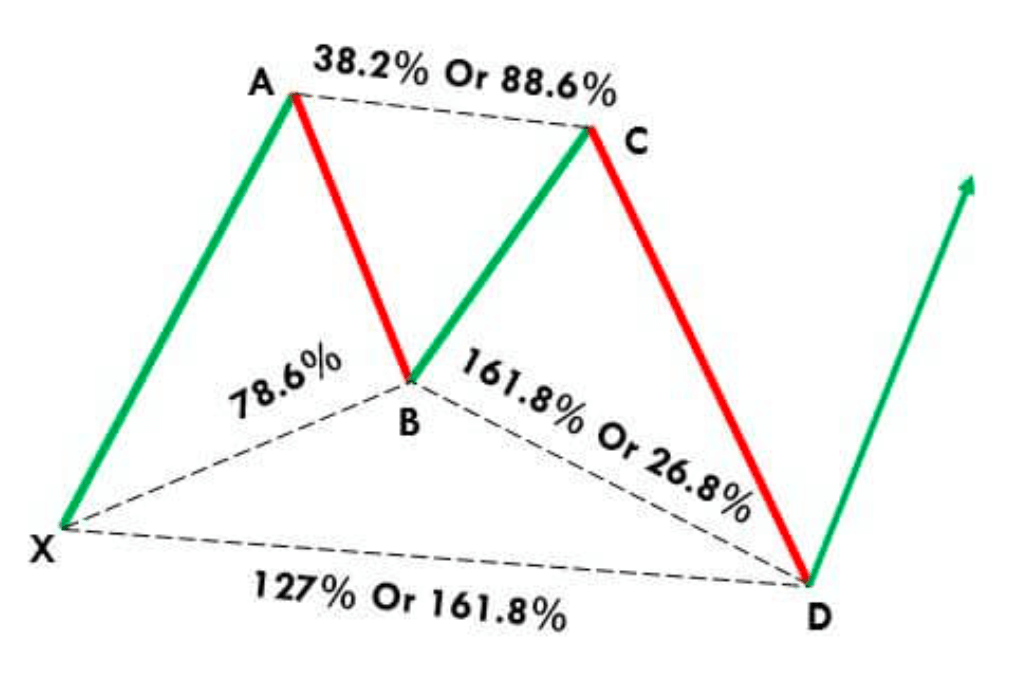
The bullish butterfly pattern (picture above) consists of an X-A, A-B, B-C, and C-D leg, each using different Fibonacci ratios displayed as a percentage.
The bullish version kicks off when the price rises suddenly forming the X-A leg up. The A-B leg involves a sharp drop to form A-B, retracing 78.6% of the distance of X-A.
The B-C leg creates what is essentially a double top with a slightly lower high, retracing 38.2 or 88.6% of the A-B leg.
The C-D leg is the most powerful move of the pattern prior to the breakout. The C-D leg plunges lower, extending 127% or 161.8% of the A-B leg.
The most bullish trade setup for bullish butterfly patterns is a long entry at the termination of the D point, with a trader placing a stop loss below the bottom of the C-D leg. A bullish breakout with volume or confirmation from a technical indicator should yield positive results.
Bearish Butterfly Pattern
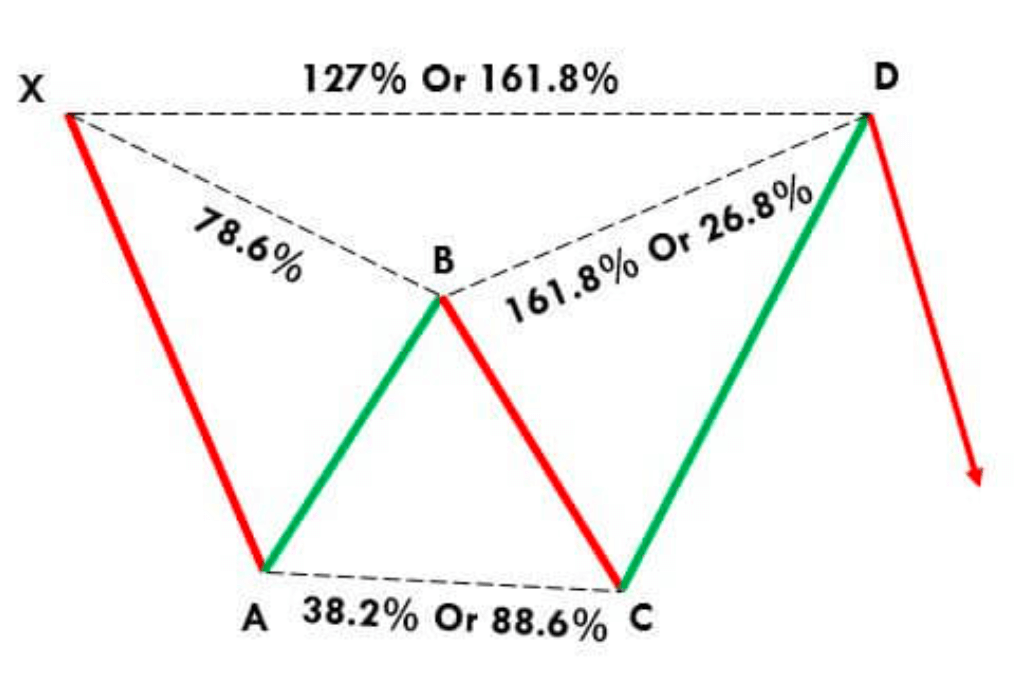
The bearish butterfly pattern (picture above) consists of an X-A, A-B, B-C, and C-D leg, each using different Fibonacci ratios displayed as a percentage.
The bearish version kicks off when the price falls, forming the X-A leg down. The A-B leg involves a sharp rally to form A-B, retracing 78.6% of the distance of X-A.
The B-C leg in a bearish butterfly pattern creates what is essentially a double bottom with a slightly lower low, moving to the 38.2 or 88.6% retracement level of the A-B leg.
The C-D leg is the most powerful move of the pattern prior to the breakdown. The C-D leg soars higher, extending 127% or 161.8% of the A-B leg.
The best trade setup for the bearish harmonic pattern is a short entry at the termination of the D point, with a trader placing a stop loss above the top of the C-D leg. A bearish breakdown with volume or confirmation from a technical indicator should yield positive results and a new downtrend should begin.
How To Identify The Harmonic Butterfly Pattern
First identifying the pattern is the key to effective butterfly pattern trading strategies.
Identifying the pattern consists of using measuring tools to find Fibonacci retracement levels and Fibonacci extensions. Many technical analysis software packages offer an XABCD tool that makes drawing out the pattern easy.
The move always begins with the X-A leg. At this point, it isn’t possible to tell if the pattern is a butterfly pattern. If the next move in the A-B leg retraces 78% of the X-A leg, the trader can begin to consider a butterfly pattern in the making.
If the B-C leg retraces 88.6% of the A-B move, there are now more clues that the pattern we are working with is a harmonic butterfly pattern. At this point, a trader can begin to prepare for the trade setup.
The pattern becomes more likely to be valid if the final C-D leg extends as much as 161.8% of the move. 161.8% is the golden ratio of Phi.
Depending on if the pattern is bearish or bullish, a butterfly harmonic pattern can appear to look like a double top or a double bottom.
How To Use The Butterfly Pattern To Spot Bullish And Bearish Reversals
Using the butterfly pattern, traders can wait for a bearish or bullish breakout trade at the D point reversal zone. At this point, the trader would place a stop loss order below the D termination point to avoid a losing trade.
Ahead of taking a position, traders should have a plan for both a conservative profit target and a more aggressive profit target and watch the reaction when price reaches each level to determine when to close the trade.
How To Trade The Harmonic Butterfly Pattern
The Margex trading platform includes powerful technical analysis tools built directly into the platform. This allows traders to properly identify and successfully trade a butterfly pattern. Here are the steps necessary to trade the pattern.
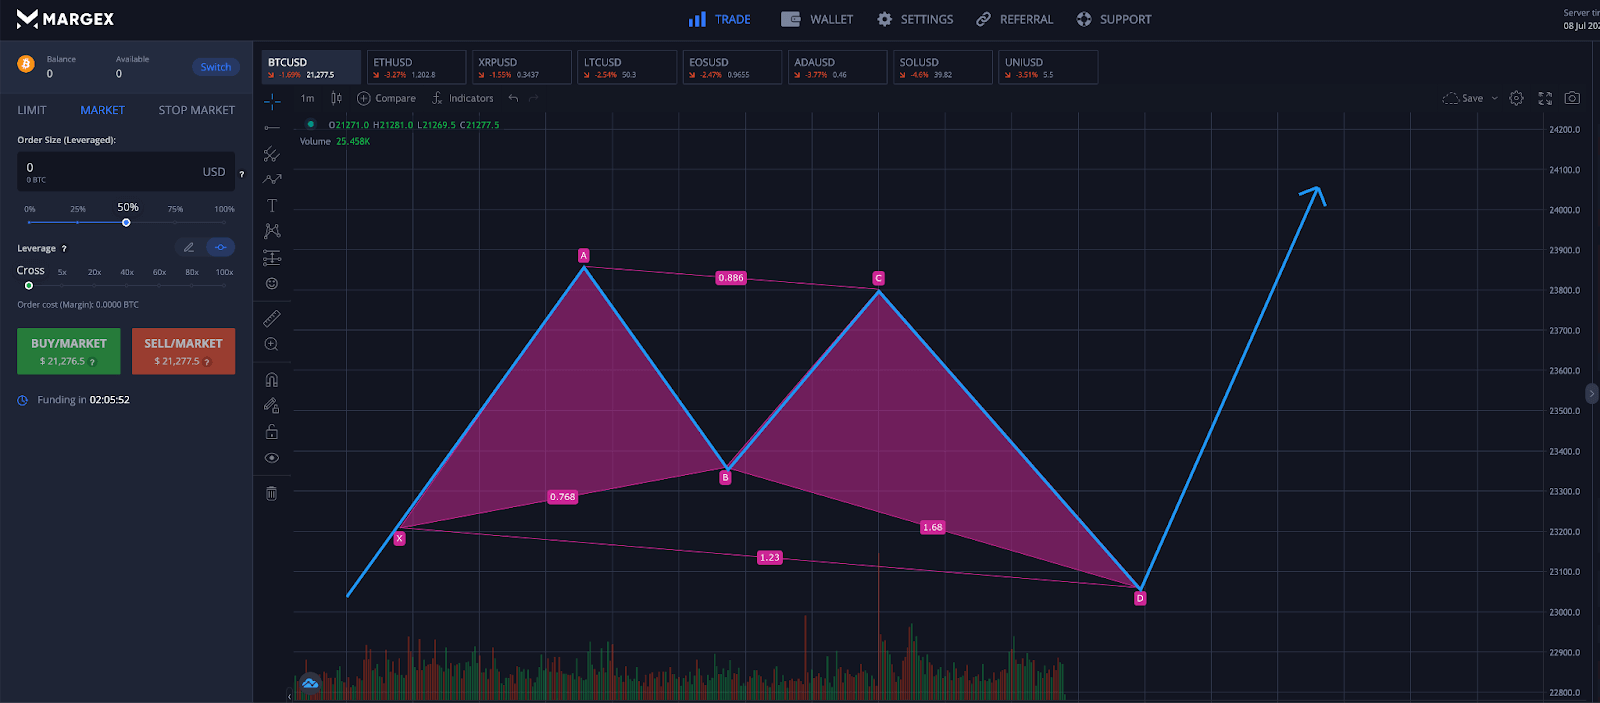
Step 1 - Margex conveniently offers an XABCD drawing tool to make measuring Fibonacci ratios as simple as possible. Using the built-in technical analysis tools, traders can draw out the pattern to properly identify a bearish or bullish butterfly pattern.
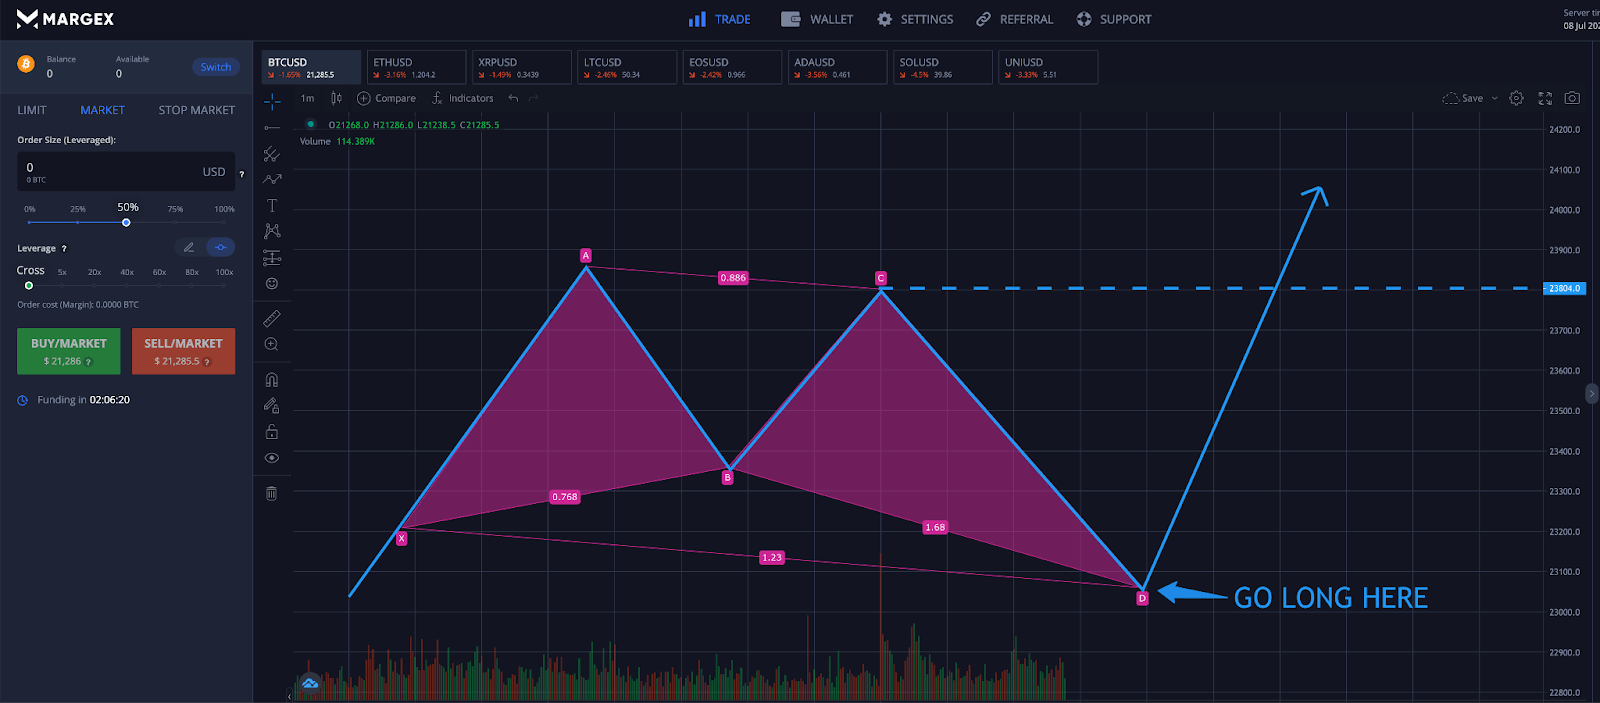
Step 2 - With the pattern properly identified, traders can get prepared to take a long position at the termination point of the C-D leg at the end of the D point. The C-D leg should terminate at the 161.8% Fibonacci extension.
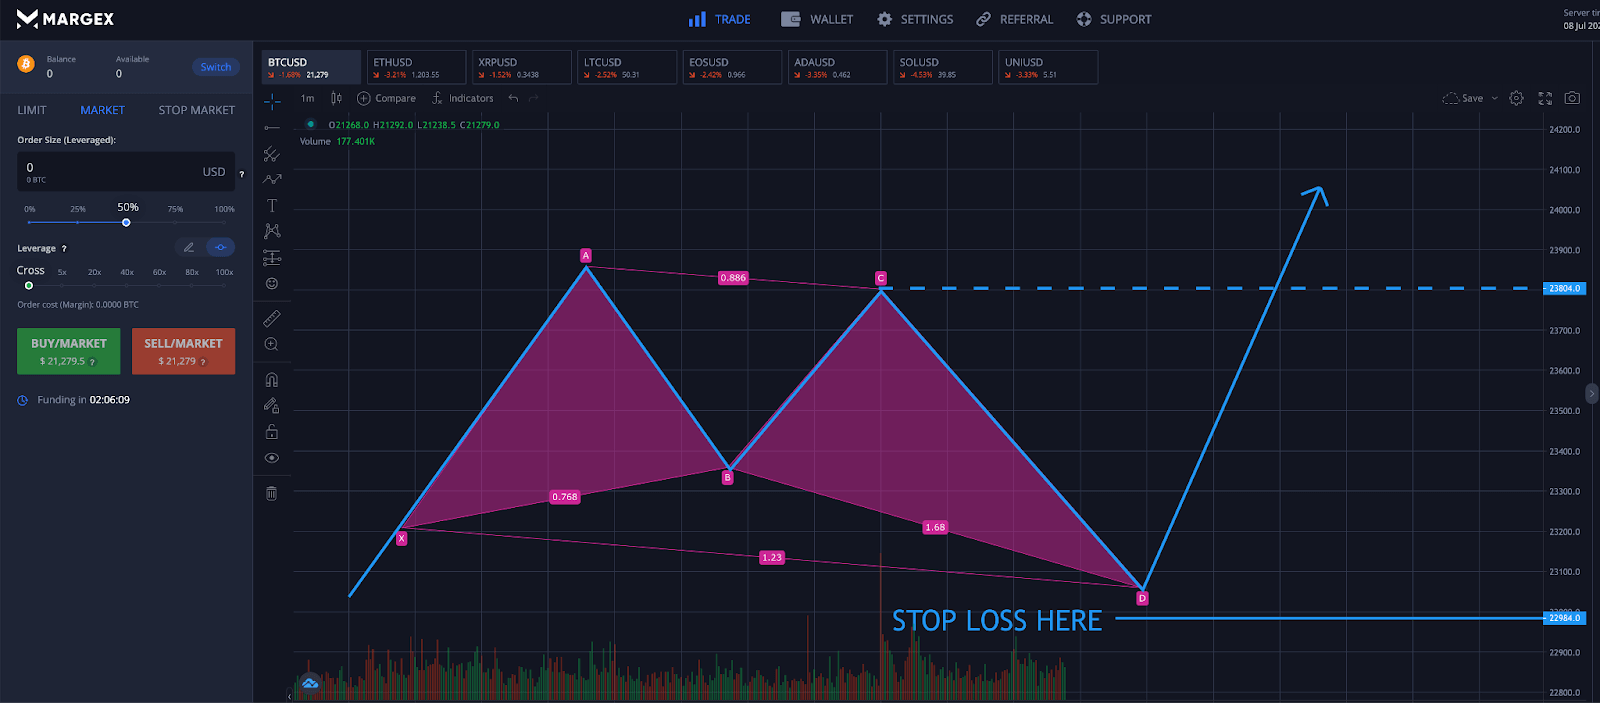
Step 3 - Because the butterfly gives us the termination point of a C-D leg at precise measurements, placing a stop loss below the D point should prevent recurring losing trades and large max drawdowns if the pattern ultimately moves against you.
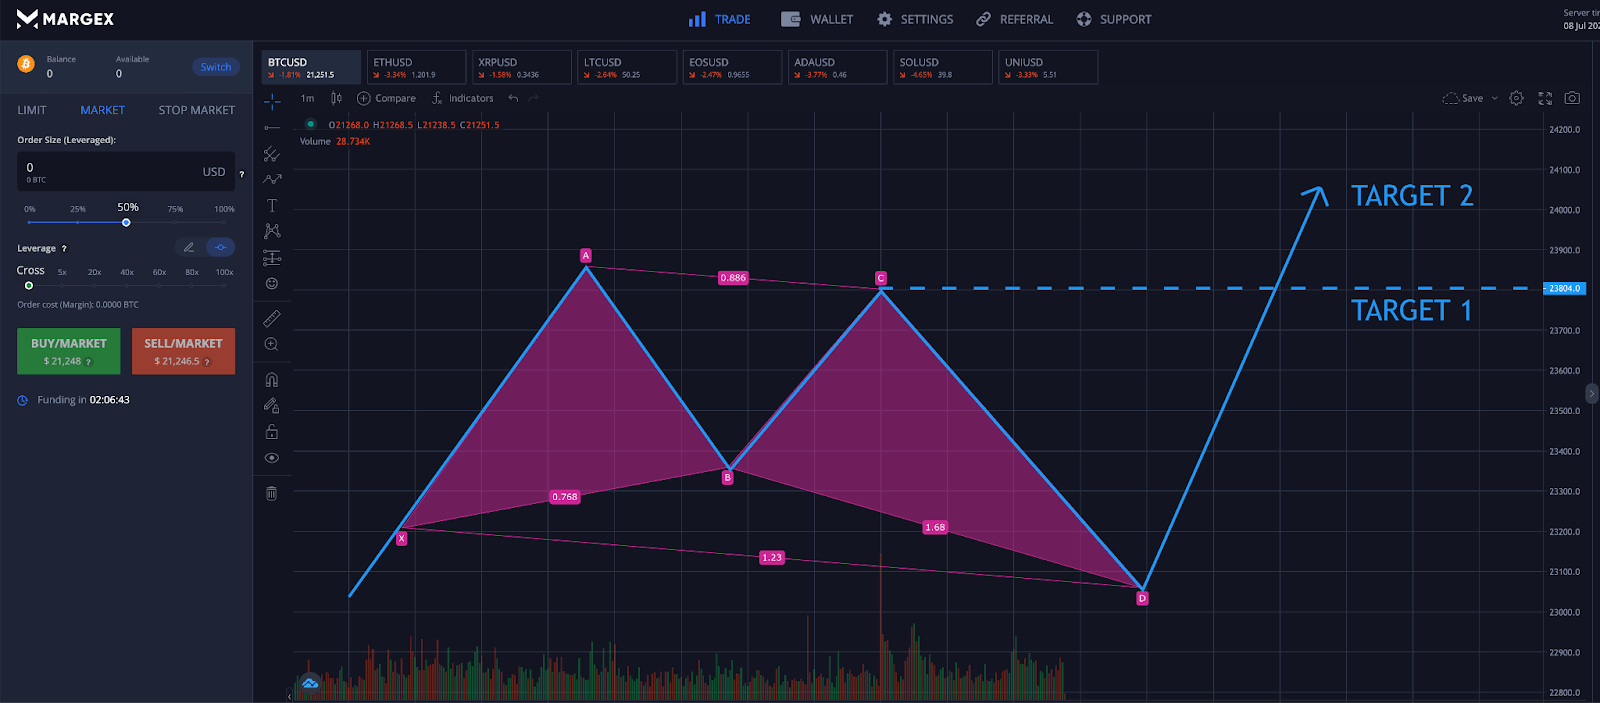
Step 4 - Take profit at predefined levels. Traders can set up a more conservative price target or a more aggressive price target depending on their confidence level in the setup and resulting breakout.
Combining The Butterfly With The Relative Strength Index
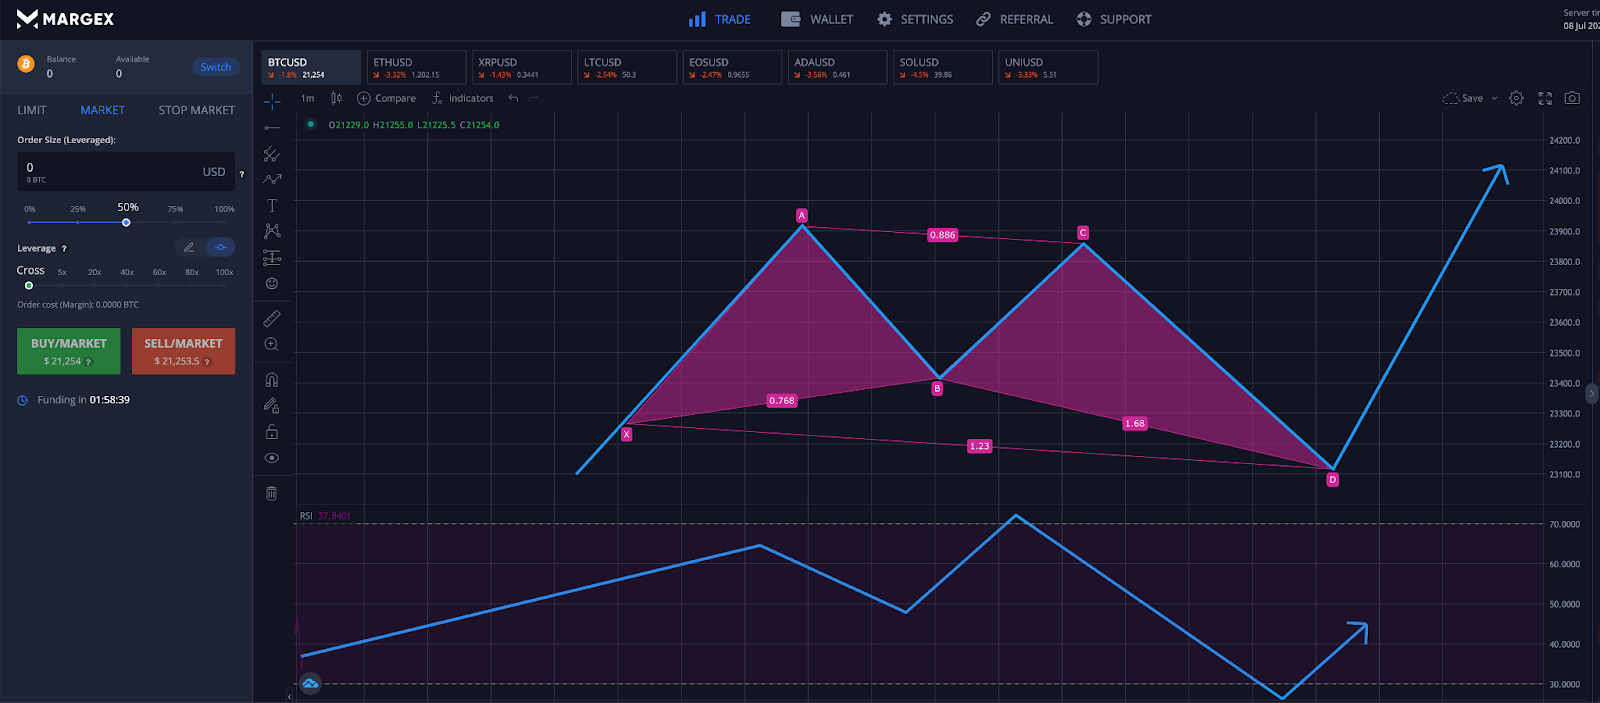
Other technical indicators, such as the Relative Strength Index designed by J Welles Wilder, can help to confirm the setup of a butterfly pattern. In the example below, the RSI exhibited a bearish divergence ahead of the C-D wave tipping traders off about the coming plunge.
At this point, the trader will have enough measurements to consider a butterfly pattern. Waiting until the RSI reaches oversold levels, then reentering the threshold above a reading of 30 should confirm the buy setup. It is wise to backtest results before implementing the setup an active trading strategy.
The Advantages Of Using Butterfly Patterns
The advantage of using harmonic patterns like the bearish or bullish butterfly pattern, is because it gives traders a clear way to confirm the pattern with precise Fibonacci measurements. Because the pattern follows specific conditions across each leg, it is easier to identify once a trader knows what they are looking for.
Other advantages of the butterfly pattern include providing a way to predict future movements and prepare at key to take positions as key reversal zones. There are less losing trades because a trader has a better idea of what is coming next, and stop loss placement is more successful because the moves terminate as Fibonacci retracement or extension levels.
The Disadvantages Of Using Butterfly Patterns
In terms of disadvantages, harmonic patterns are more difficult to spot as they begin to form. Oftentimes, flags, pennants, and triangles can begin to take shape early on, while harmonics require large swings in opposite directions before they can be identified.
Because of this behavior, traders are advised to be patient and wait to take a position at the end of the D point after the pattern has completed and a reversal is more probable. Trading the pattern too early could result in the pattern failing or morphing into another pattern, leaving the trader exposed to potential losses.
FAQ
What is the butterfly pattern?
The butterfly pattern is a harmonic chart pattern in the form of an XABCD, where each leg and movement follows a precise Fibonacci ratio as a termination point. At what percentage price action retraces and extends will help a trader identify and trade the pattern.
What happens after a butterfly pattern?
After the completion of a valid harmonic butterfly pattern, a dramatic reversal and large breakout results in the opposite direction of the pattern’s final move
How do you identify a harmonic butterfly pattern?
Identifying a butterfly harmonic pattern begins with the X-A leg and truly the measurements begin at the A-B leg. A trader can then begin to look for specific Fibonacci retracement levels and extensions across each move until completion.
What is a bullish butterfly pattern?
A bullish butterfly pattern begins with a move in the same direction of the primary trend for the X-A leg, followed by a move in the opposite direction for A-B. The B-C leg again rises in the direction of the primary trend, while the largest move, leg C-D, falls sharply against the trend. When the move completes, a large move continuing in the primary trend typically results.
What is a bearish butterfly pattern?
A bearish butterfly pattern begins with a move in the opposite direction of the primary trend for the X-A leg, followed by a move in the up for A-B. The B-C leg again falls against the primary trend, while the largest move, leg C-D, rises sharply with the trend. When the move completes, a large move continuing the downtrend typically results.
How do you use butterfly patterns?
Traders rely on butterfly patterns to prepare for reversal setups and set stop loss levels that avoid losing trades. Butterflies are effective strategies for taking a position ahead of a larger move and allow traders to predict future price action with some degree of accuracy. However, the pattern is only valid if all conditions are met and a breakout follows the conclusion of the C-D leg.
What are some other harmonic patterns?
Other lesser known harmonic chart patterns include the bat pattern, butterfly pattern, shark pattern, crab pattern, gartley pattern, three drives pattern, five drives pattern, and A-B = C-D patterns.


