
Traders who have been around in the crypto industry understand how important to acquire all the needed skills in technical analysis to have the edge over the big players and financial institution that influences the market due to its volatility. With the help of technical indicators, price actions, price patterns, and other technical strategies combined, these traders look for the best opportunity to provide good profitability in trading.
Technical analysis of the financial market and market psychology sets apart a professional trader from beginners and investors who want to buy crypto assets and hope for the price to go higher; harnessing financial market technical skills is a goldmine that will save you from the volatility that comes with trading in this space; more importantly, you will be able to preserve your capital while looking for the best trading opportunity to maximize profit.
With the help of the Aroon indicator, we would see how a trader can identify early trends and how to combine this Indicator for better profitability best, and the Aroon indicator will assist you in identifying if a market is trending or ranging to best adapt your trading strategies to fit the market structure.
Most traders in the crypto, forex, and stock markets use the Aroon indicator to time their entries as they discover early trends and combine this Indicator with other momentum indicators or oscillators like moving average convergence divergence (MACD).
This guide focuses on an in-depth use of the Aroon indicator and how to combine this Indicator with price actions, MACD, and moving averages.
What Is The Aroon Indicator?
The Aroon Indicator is a trading tool used by traders to identify new trends, spot consolidations, define corrective periods, and predict reversals in an asset’s price. This tool was first developed in 1995 by a renowned financial market trader, Tushar Chande. He developed the Aroon indicator as a part of a family of momentum oscillators.
Aroon was called in the Sanskrit language meaning “dawn’s early light.” As the name implies, the Aroon indicator spots or identifies early trends or trends forming in their early stage.
Other momentum indicators or oscillators include the relative strength index (RSI), average directional index (ADX), and others. It is not new that most traders who trade based on momentum and trends find this strategy to be more successful as the identity of early momentum and trade is based on market trends.
Momentum indicators are much more effective and accurate when there are strong trends but could be exploited and give false signals in a ranging market as prices become more volatile due to price action.
The Aroon indicator comprises two dynamic lines called the Aroon up and Aroon down.
The Aroon up and Aroon down move based on the direction of the market and can be interpreted as;
- Aroon Up crosses over Aroon Down, the market goes to an uptrend.
- Aroon Down crosses over Aroon Up, the market goes to a downtrend.
- The uptrend remains strong as long as Aroon Up is at 100 level .
- The downtrend remains strong as long as Aroon Down is at 100 level.
Characteristics Of An Aroon Indicator
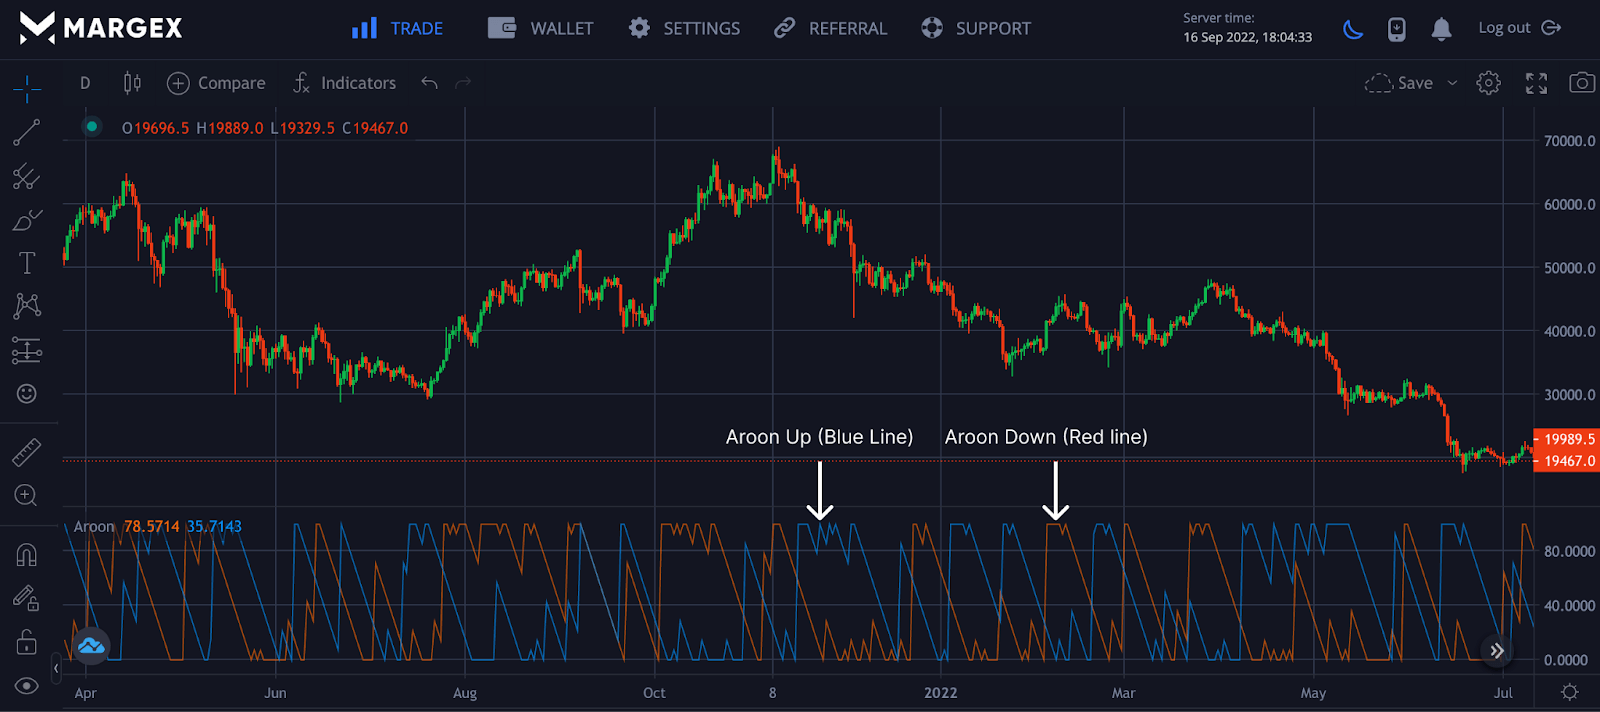
To make this more practical, we decided to use the BTCUSD pair with the Aroon Indicator on the Margex platform. The Aroon indicator comprises two dynamic lines: Aroon up (Blue line) and Aroon down (red line). We will discuss how to use this indicator extensively with examples as we go on.
How To Calculate The Aroon Indicator
To calculate the formula for the Aroon indicator, we would focus our attention on high and low prices over a given period. The Aroon Indicator formular is calculated as;
Aroon Up = [(X − number of periods since the highest high)/period specified] x 100
Aroon Down = [(X − number of periods since the lowest low)/period specified] x 100
Where X is the period specified
Aroon Up records how long buyers have held their positions since the price recorded a new swing high. Its value will reach 100 once the current swing high is the highest, else it will return to where the recent swing high occurred.
Aroon Down records how long sellers have held their positions since the price recorded a new swing low. Its value will reach 100 once the current swing low is the lowest, else it will return to where the new swing low occurred.
The default value for this indicator is 14, but this setting can be adjusted based on the trader’s preference.
Aroon Indicator sometimes might give good entry and exit points, but the fact remains that it can be faulty and exploited in some market conditions. It is best if this Indicator is used with other strategies and technical indicators for better success and results, as the Aroon indicator uses historical data.
How To Interpret The Aroon Indicator
The Aroon indicator is available on most trading platforms, including Margex. As a momentum-based indicator, it helps traders to see when a price is trending or ranging. It is advised not to trade this indicator in isolation as it can be flawed sometimes. Let us discuss case examples that we can use for the Aroon indicator.
Finding Crossover

From the image above, Aroon up crosses over Aroon down after the price was seen, making a trend to the upside. As soon as Aroon up made a crossover from the bottom to the upside of Aroon down, the price of the BTCUSD pair made a major movement from the region of $40,000 to $65,000.
Finding Strong Trend
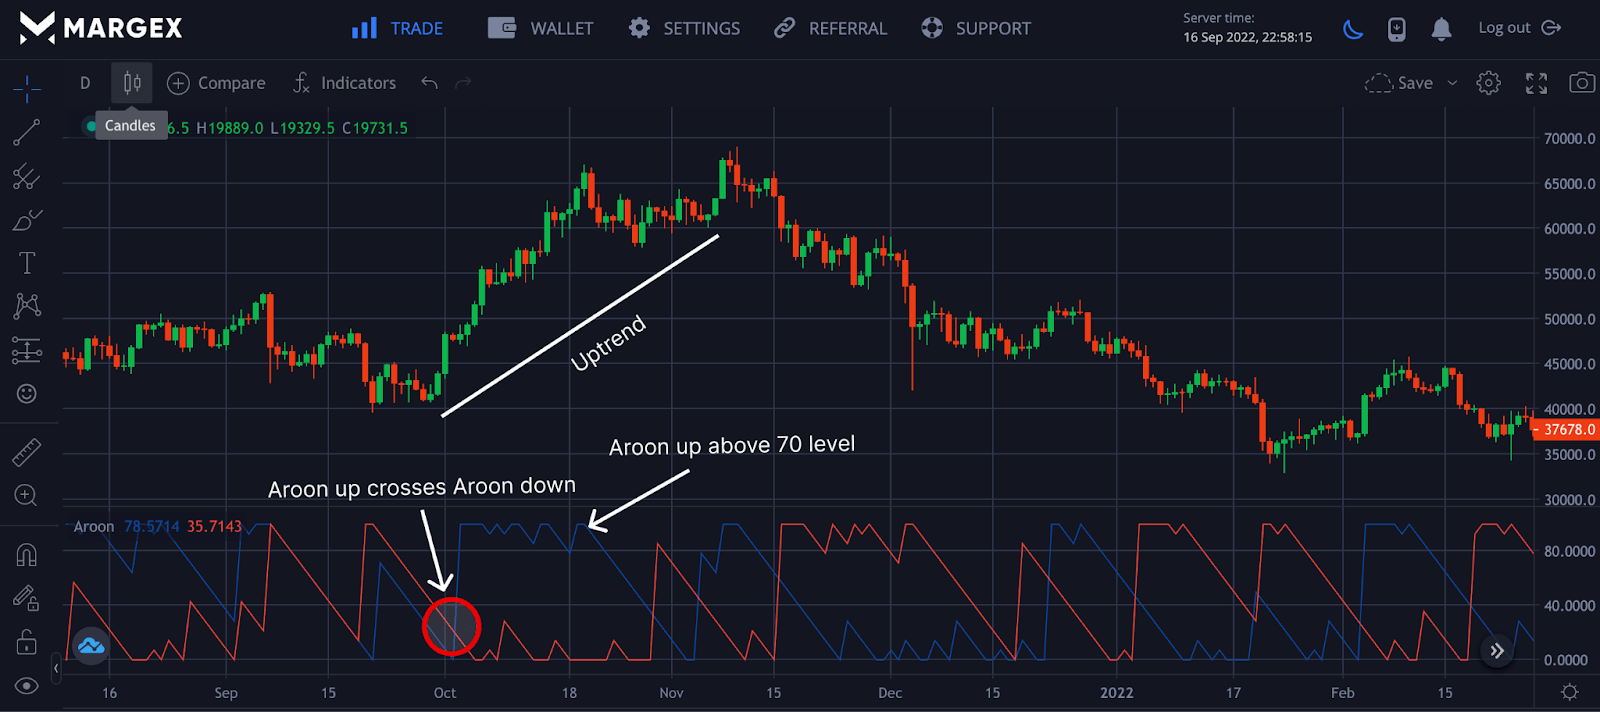
Aroon up crosses over Aroon down to the upside, with the level of Aroon up going above 100 levels, indicating a strong uptrend is in place, with the price of BTCUSD in an uptrend as indicated.
Finding The Reversal
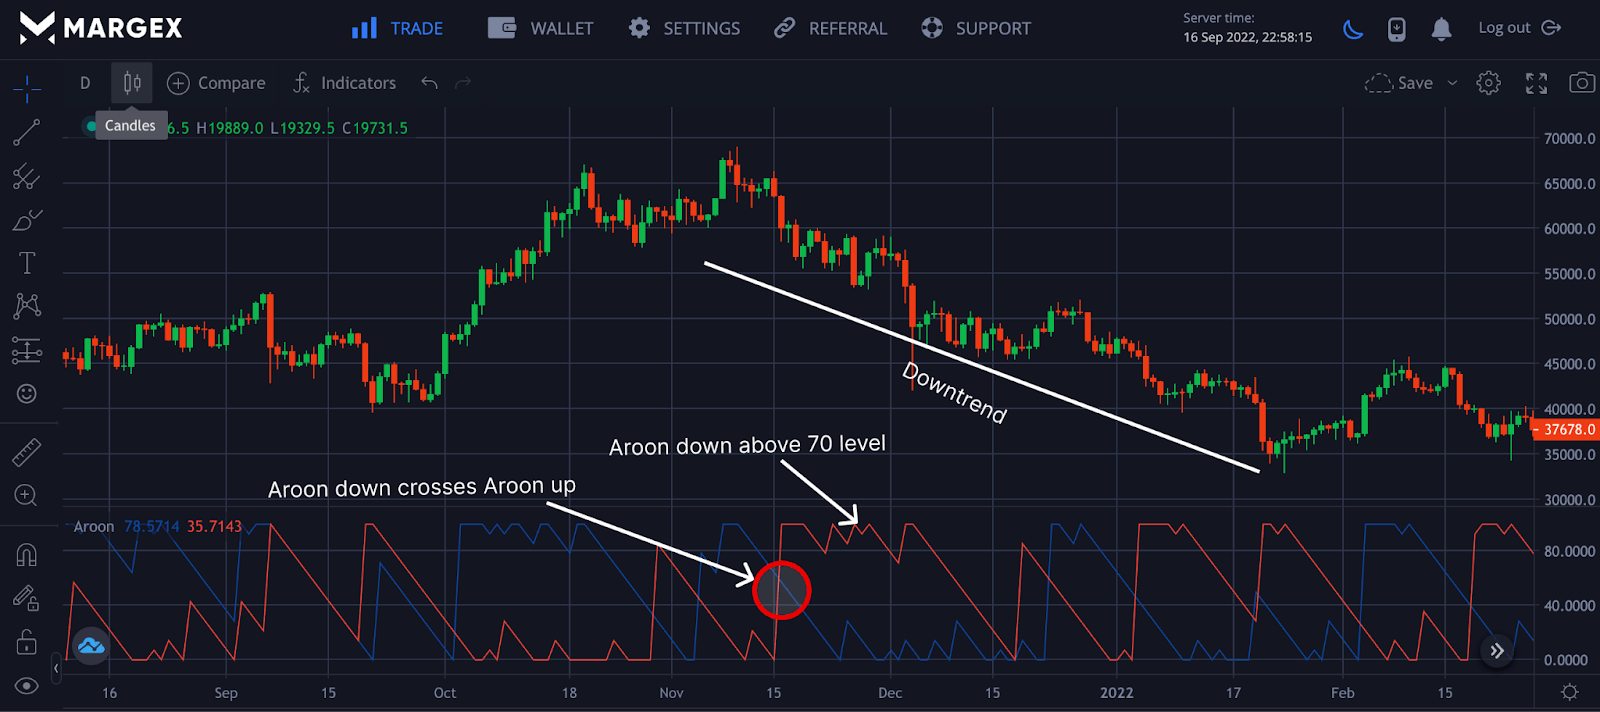
Aroon down crosses over Aroon up to the upside, with the level of Aroon down going above 100, indicating a strong trend reversal with the price of BTCUSD in a downtrend.
The downtrend remains as long as Aroon remains below 70 and 100.
What Is Aroon Up Down Indicator?
Momentum indicators measure price fluctuations as they compare historical prices; Aroon tracks prices relative to time. The Aroon indicator is made up of two lines called the Aroon up down Indicator, as the lines are formed from the last 25-period swing highs and lows. The swing highs and lows are not the entire prices but swing highs and lows with a specified period.
This indicator line makes crossovers and prices tend to go in the direction of Aroon up for a bullish trend or Aroon down for a bearish trend.
Giving The Market Aroon For Its Money
Since the market moves in trends and cycles, the assumption for the Aroon indicator is that prices create new highs as the market trends to the upside, and the market creates new lows as prices go into a downtrend. The indicator is scaled between zero to hundred values and tracks the last 25-periods. New highs are formed in the first half of the 25-periods when readings are above 50, and new lows are formed when readings are new 100.
How To Trade Crypto With The Aroon Indicator On Margex?
A Bitcoin-based derivatives exchange called Margex allows crypto traders to trade various crypto assets with up to 100x leverage while at the same time making more money staking the traded tokens for up to 13% APY returns.
Margex, with its unique feature of trading and staking the same crypto assets, assists traders and investors in becoming more profitable, allowing you to earn passive income despite how volatile trading can be. Margex employs an automated system to credit daily rewards to your staking account immediately.
To gain full access to the Margex platform as a trader, you must first register as a new user or login to gain access to these features, which include robust technical analysis tools built with real-time prices to help you make money trading.
Case Examples From Margex
Step 1: Find The Crossover
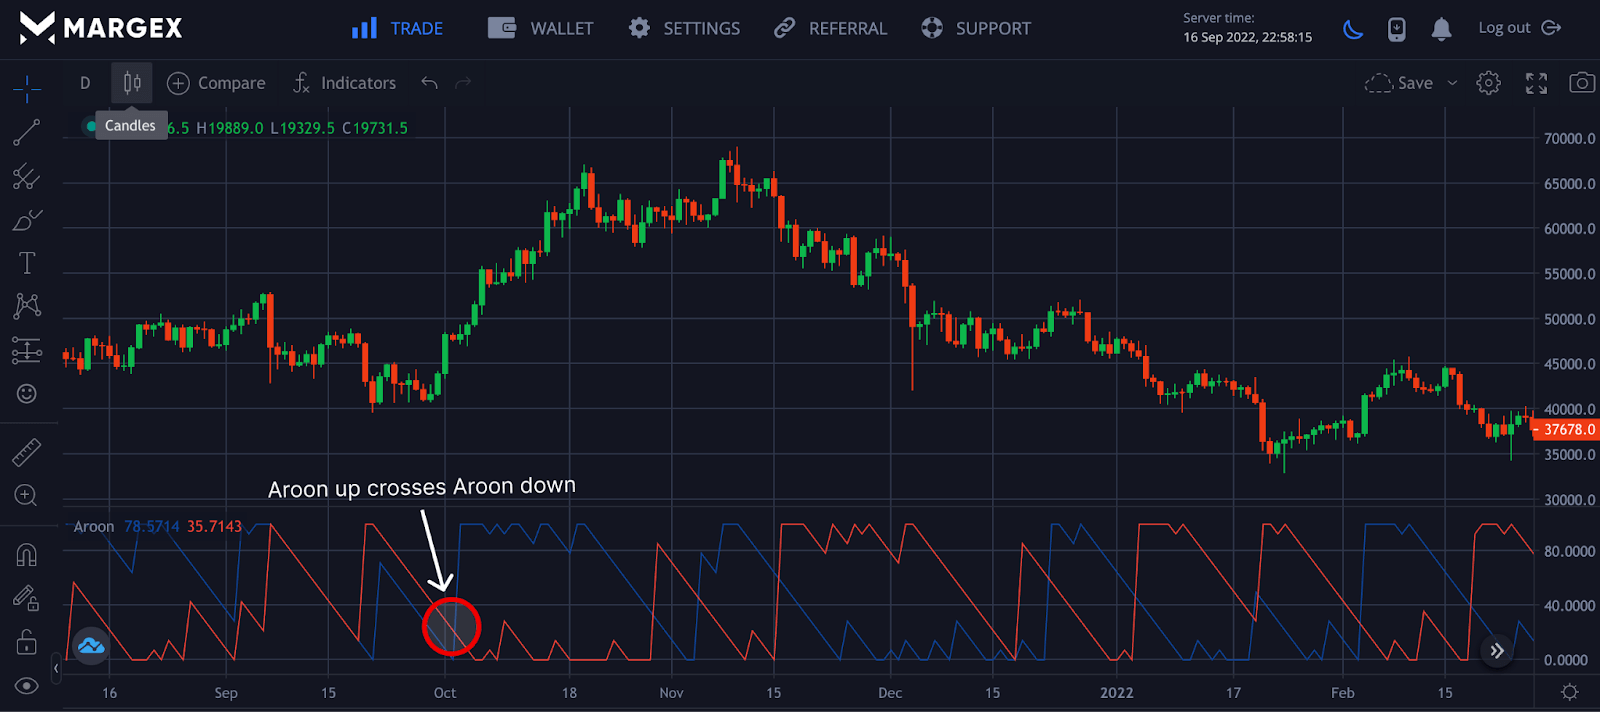
Aroon up crosses over Aroon down after price was seen, making an upward trend in the image above. As soon as Aroon up crossed from the bottom to the top of Aroon down, the price of the BTCUSD pair jumped from around $40,000 to $65,000.
Step 2: Find The Strong Trend

Aroon up crosses over Aroon down to the upside, with the level of Aroon up exceeding 100, indicating a strong uptrend with the price of BTCUSD in an uptrend as indicated.
Step 3: Find The Reversal

Aroon down crosses over Aroon up to the upside, with the level of Aroon down exceeding 100, indicating a strong trend reversal with the price of BTCUSD in a downtrend.
The downtrend will continue as long as Aroon up remains between 70 and 100.
Avoid trading this indicator in isolation as the Aroon indicator could give false signals during a ranging market.
The Difference Between The Aroon Indicator And The Directional Movement Index (DMI)
Aroon tracks prices relative to time compared to Welles Wilder’s Directional Movement Index (DMI), which uses up and down lines to show trend direction. DMI, like other momentum Indicators, majors the difference between current and historical price swing highs and lows, placing so much emphasis on price.
Risk Management When Using The Aroon Indicator
Aroon Indicator, despite its accuracy, should never be used in isolation for trading as indicators tend to be exploited in a ranging market; rather, indicators should be combined with other trading strategies for a better outcome and risk management.
It is tempting to follow the crossover of these indicators. Still, they struggled in an extremely volatile and ranging market as the crypto industry is well known for its volatility.
Indicators Best Paired With The Aroon Indicator
Aroon Indicator can be accurate sometimes but should not be traded alone for a better success rate. For a high outcome and profitability, the Aroon indicator can be traded with other test strategies that work well with this indicator.
Moving Average
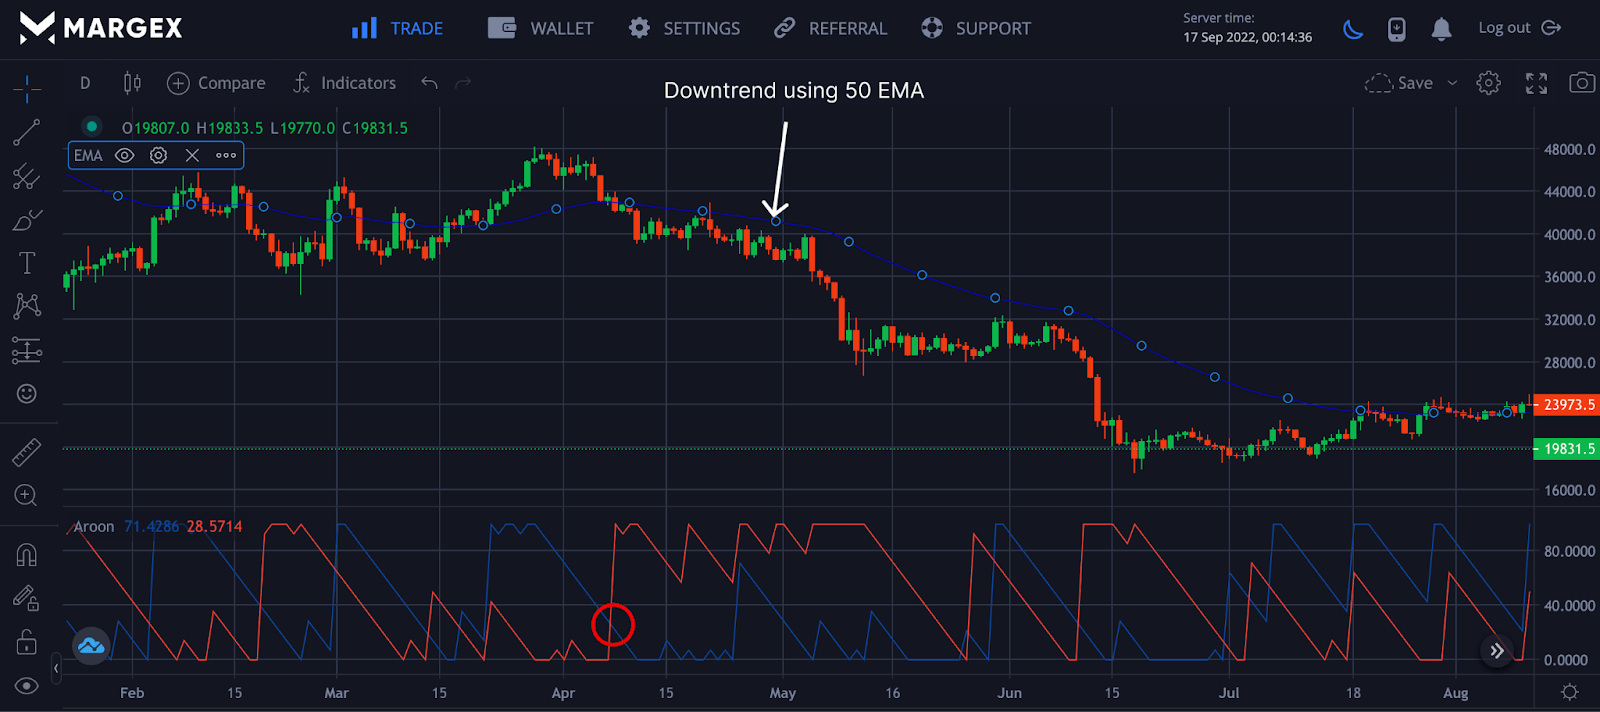
The 50 EMA showed a downtrend as the price closed below the moving average from the image. In time the Aroon indicator printed a sell signal as the Aroon down crossed over the Aroon up to the upside towards the 100 level, indicating a sell order for a trader that wants to go short.
MACD
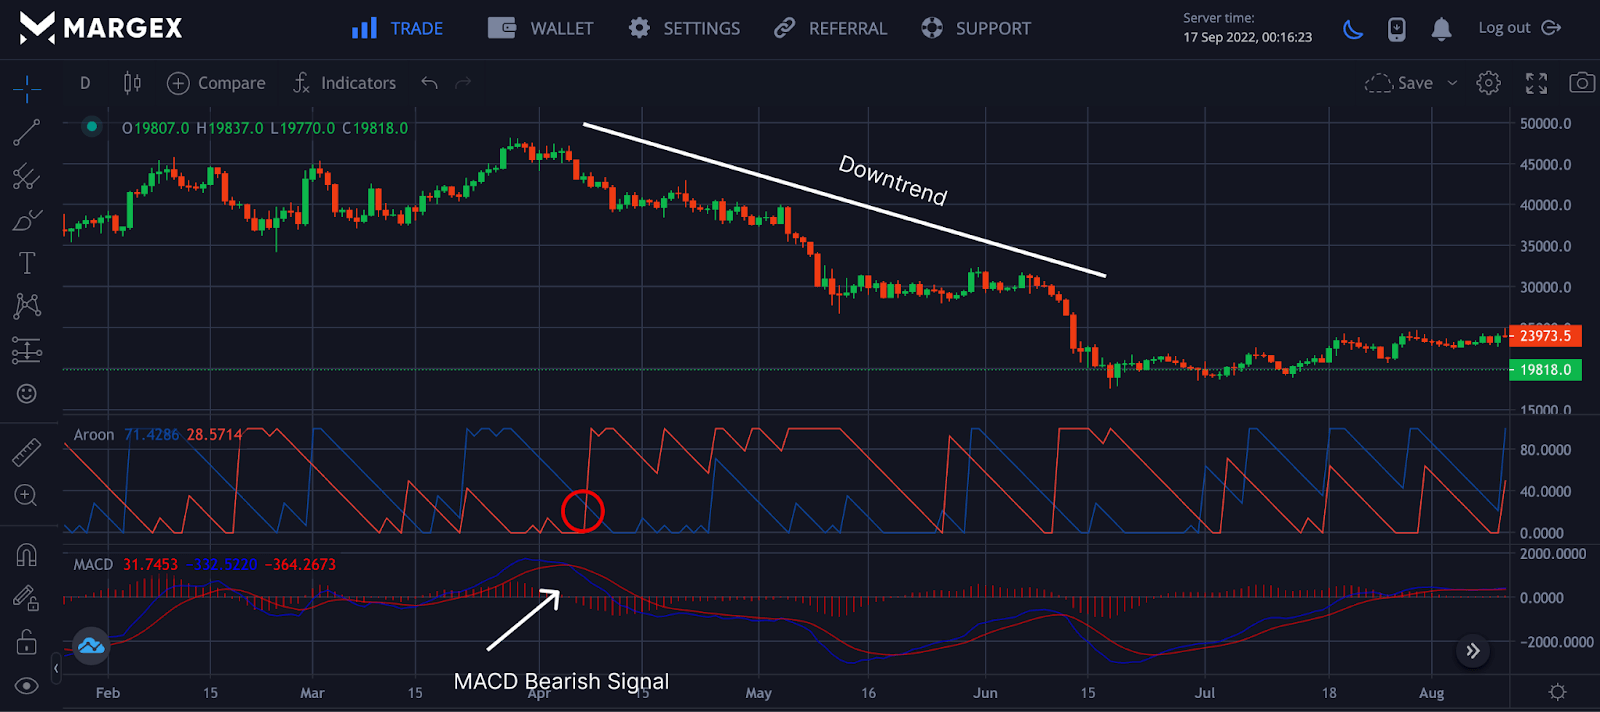
From the image, the Aroon indicator showed a bearish signal which the MACD confirmed as price tends to do in the direction of the trend.
Price Action
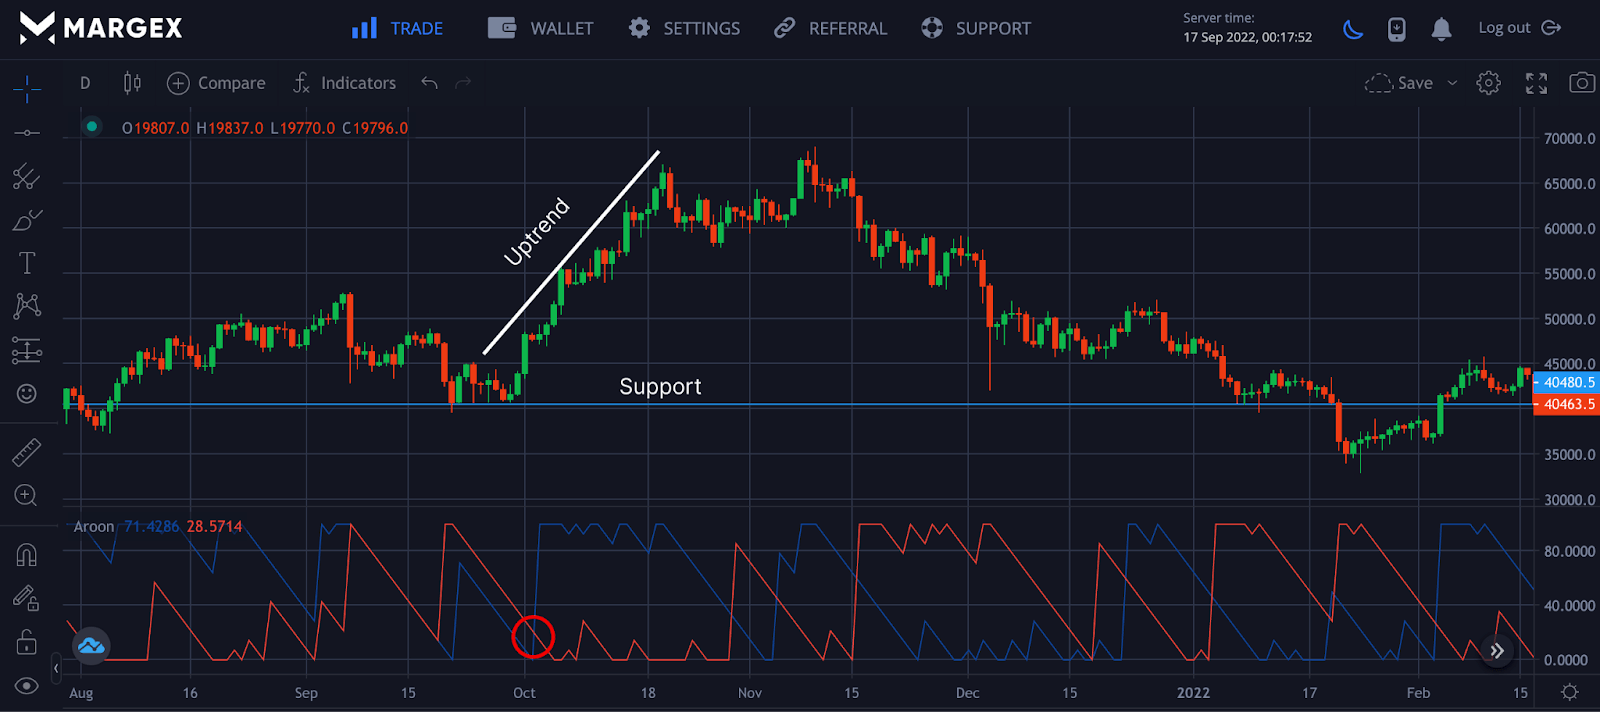
From the chart, the price bounced off from support as buyers pushed the price higher; the Aroon indicator confirmed this as it indicates a strong bullish signal with the Aroon up located in the 100 level.
How Reliable Is The Aroon Indicator?
No indicator is 100% guaranteed to be very profitable as it can be exploited due to market volatility and price action. Most Indicators work based on trends; in a sideways market, they can produce false signals and lead to huge losses.
The Aroon Indicator works best and is most reliable when combined with other strategies or indicators like moving averages, price actions, and MACD.
Limitations Of The Aroon Indicator
Like all technical indicators, the Aroon indicator can give false signals in extreme uncertainty in the market and a volatile market. Do not trade the Aroon indicator in isolation to deal with these false signals.


