
Trading the financial market without the necessary technical analysis skills is like exposing yourself to excessive risk that comes with the market even before engaging yourself with crypto assets. That is why there is more emphasis on gaining all the required skills in trading with the right psychology to take opportunities that the financial market presents, be it crypto, forex, indices, or the stock market.
Advanced and beginner traders have something in common both struggle with the need to find the best entry, exits, bottom, top, trend reversals, and different market cycles to profit and preserve capital from excessive risk exposure.
Traders go out of their way to have the best probable outcome when participating in the financial market. They combine candlestick patterns, chart patterns, strategies, and even indicators to outsmart the market due to its high volatility and price actions.
This guide focuses on the bearish harami pattern as one of the many technical analysis candlestick patterns for determining trend reversal. Good knowledge of the bearish harami patterns goes a long way to help a trader determine the end of a bullish trend and best position itself for a short entry position.
What Is The Harami Candlestick Pattern?
The Harami candle pattern is a trend reversal pattern that consists of two candlesticks. The first candle is a bigger candle indicating a continued trend, while the second candle looks short of an opposite color indicating a potential trend reversal.
The Harami candle pattern is common among traders, and as a Japanese candlestick, most traders find it easy to find as it gives them a tight risk-to-reward ratio when trading it. The term “Harami” is a Japanese term meaning pregnant woman. As a pregnant woman gives birth to a new child, so is the Harami pattern as it is expected to give birth to a new trend when it has been formed and confirmed, with the trend being either uptrend or downtrend depending on the type of harami pattern form after a trend.
There are two types of harami candle patterns, namely bullish harami patterns and bearish harami patterns.
Bearish harami occurs at the end of an uptrend signaling a trend shift from a bullish trend to a bearish trend. For example, for a bearish harami formed, the last candle that precedes the next would be a bullish candle followed by a short-bodied bearish candle with little wicks or shadows indicating an end to the uptrend a potential downtrend is imminent.
Bullish harami occurs at the end of a downtrend signaling a trend shift from a bearish trend to a bullish trend. This is formed by combining two candles, a bearish candle followed by a short-bodied bullish candle with little wicks or shadows.
Interpreting The Bearish Harami Candlestick Pattern
It is important to note that the bearish harami is the opposite of the bullish harami and usually appears at the end of an uptrend. The first candle is a large bullish-bodied candle with little wicks or shadows followed by a small-bodied bearish candle (red), signaling a trend reversal from bullish to bearish.
The body of the first bullish green candle engulfs the second bearish red candle helping the trader to conclude this is a bearish harami pattern being formed rightfully. As the name implies, the bearish harami hints at a trend shift from up to down.
What Does A Harami Candle Look Like?
The harami candlestick pattern is made up of two candlestick patterns. The first candlestick is a tall-bodied candle will little wicks or shadows, and the second is a small candle. The first candle must engulf the second candle. This is where the image of the candle pattern, likened to a pregnant woman, comes to life as the tall candle represents the woman and the small candle represents the child.
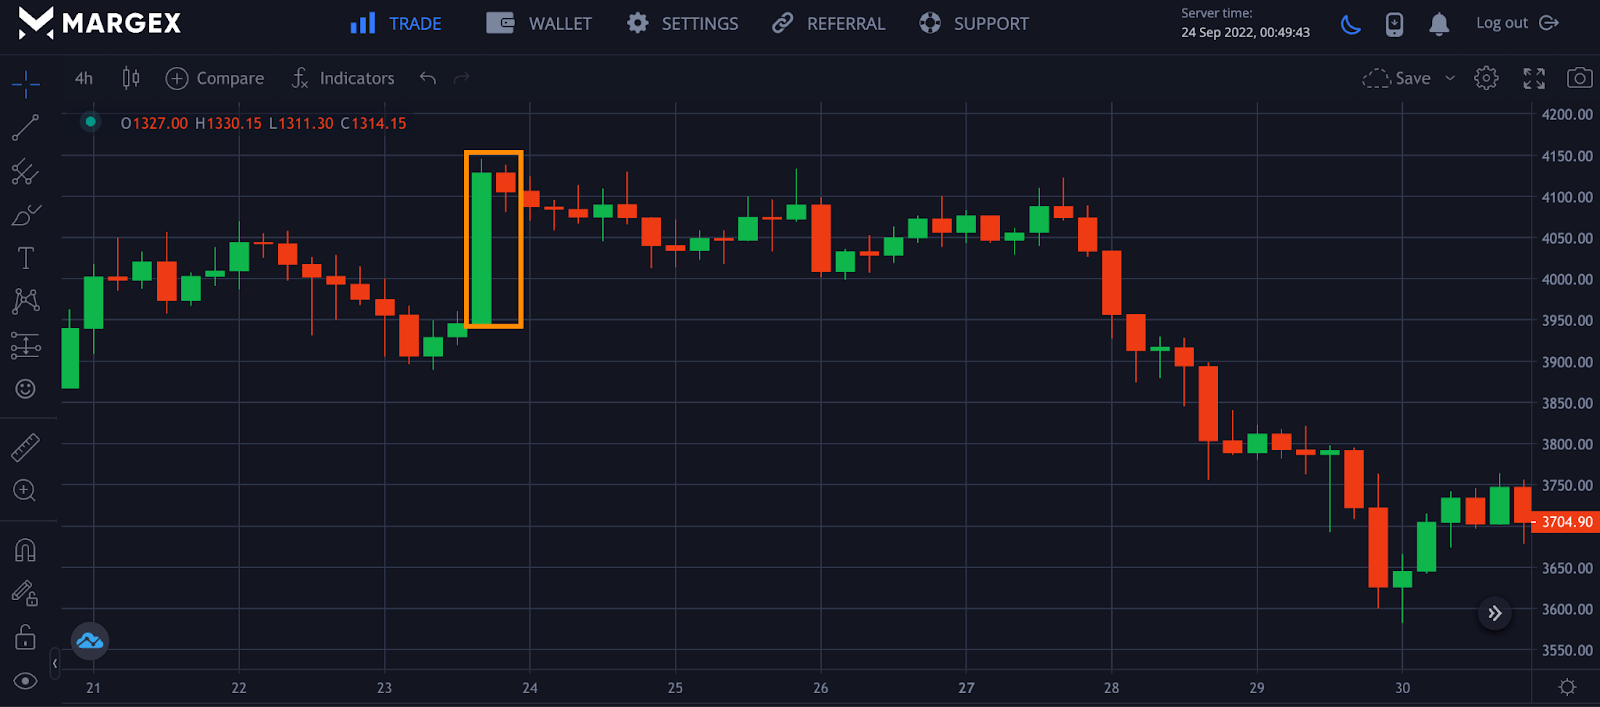
From the image, the ETHUSD pair on the four hours chart shows a formation of a bearish harami followed by a price going into a bearish trend from a previous uptrend indicating a shift in the price of the ETHUSD pair. A trader that spots this bearish harami pattern could take an open short position after the price breakdown, comparing the previous swing low as a point of reference.
Trading With The Bearish Harami On Margex
Margex is a bitcoin-based derivatives exchange that allows traders to trade up to 100x in leverage size. While trading on the Margex platform, you can stake your trading assets crypto assets with the help of their unique staking feature to earn up to 13% APY returns. The feature of this unique staking is that there are no lockup periods as staking rewards are sent to your staking balance instantly daily with the help of their automated system. You don’t need to be an advanced trader to enjoy the benefit of using the Margex platform’s unique staking feature. Margex helps to bridge the gap between DeFi and staking while taking care of the risk involved in staking.
Creating a Margex account, or as an existing user, makes use of all of the Margex features, including free trading tools, staking, and others, easy.
Margex unique user interface has been built with the most beginner-friendly experience making beginner traders trade easily and utilizing the technical analysis tools available to spot great bullish reversal trends like the bullish harami candle pattern.
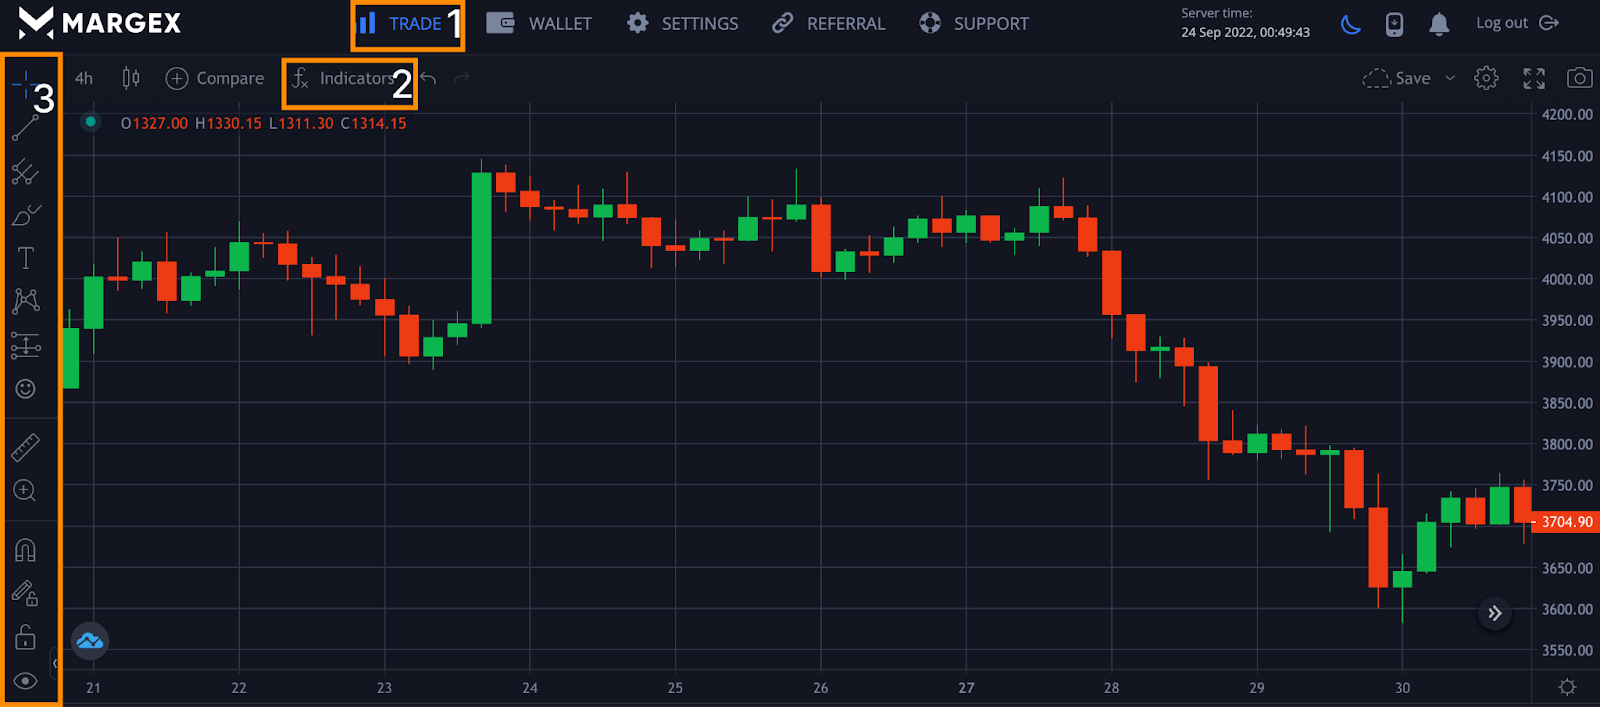
- For new users on Margex, you can access all trading features; clicking on trade helps you use all technical analysis tools.
- On clicking on the indicator section, you can add any indicator and oscillator you wish to trade with the bearish harami pattern.
- This is the technical analysis tool section that enables the trader to use various tools by clicking on the tool and can access other tools too.
Let us now focus on how to trade the bearish harami candle pattern with other strategies that would increase the profitability of a trader.
Using Seasonality
It is important to understand that the market moves in cycles or phases. As such, strong seasonal tendencies mean certain market cycles perform better during some periods. These seasonal tendencies could also be applied to some crypto assets such as Bitcoin (BTC) and others. BTC tends to perform better after its halving as most traders believe there is more surge in demand for these assets. These seasonal tendencies could last for days, weeks, and months depending on the demand for this asset.
Seasonal tendencies on a daily level can not be overlooked. Sometimes the market performs badly or ranges on such days, including weekends, as there is less volatility leading most traders to sit out not trading during those periods.
Sometimes we would need to test and backtest these strategies to be sure they work well for our trading plans, such as combining another trading with the bearish harami candle pattern for a better risk-to-reward ratio.
Watch The Ranges Of The Candles
The range of candles for some traders can be convincing evidence that the market could be exhausted. When surrounded by relatively bigger candles, the market gains more strength to rally either up or down.
Applying the use of the bearish harami candle pattern with two distinct candles. The first candle is a bullish candle with a great move, followed by a small bearish candle signaling a potential change in trend from bullish to bearish. Meaning the formation of the harami candle pattern signals an exhaustive move.
Use Volume
Good knowledge of candlestick patterns can tell you how the market has moved, but sometimes it cannot be very clear because there are so many candlestick patterns.
For a more conviction of the market, we would need to use a layer with our harami candle pattern and the would-be volume. Although the use of volume differs, the market volume gives us more data entries regarding the market performance.
Backtesting different strategy is the best way to convince yourself of what works best for you and increases your profit margin.
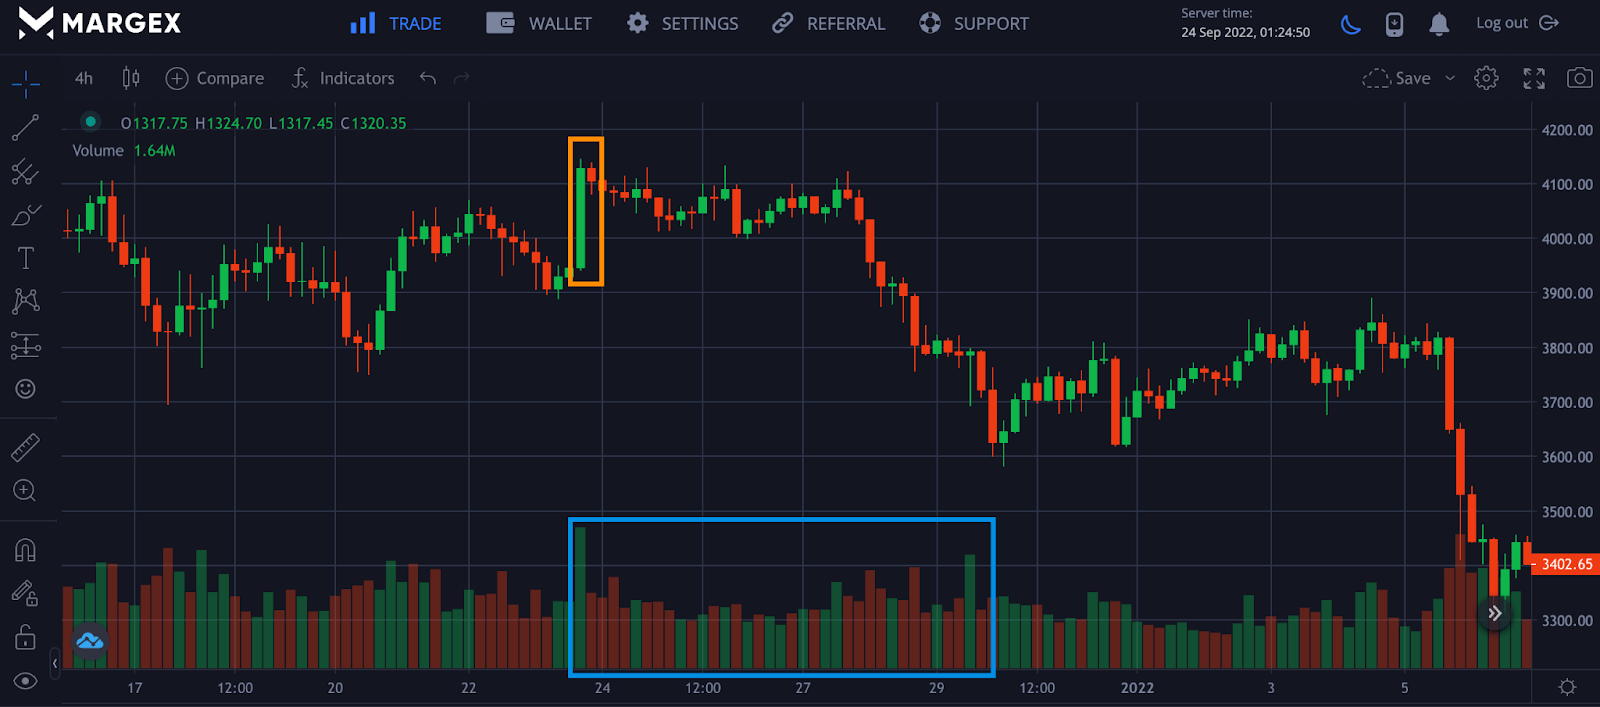
The image above shows a bearish harami pattern combined with volume. The volume indicates more sell orders as compared to buy orders. The confirmation was followed by a decline in price for the ETHUSD pair after forming a bearish harami pattern indicating a shift from bullish to a bearish trend.
Conclusion
Traders in the financial market, including cryptocurrency, trade candlestick patterns, including the harami pattern. The harami pattern is a frequent technical analysis strategy most traders employ to spot bullish or bearish reversals. As previously discussed, trading these patterns can be straightforward, especially when combined with price actions and volume.
Like all technical analysis tools and strategies, the harami pattern can be exposed in a highly volatile market and should not be traded in insolation. Trading chart patterns with other strategies, indicators, or oscillators will produce better and more efficient results.


