
As the markets unravel on the back of rate hikes by the largest central banks, Bitcoin’s price has surprisingly been rather resilient and has not broken below its May low of $17,620 yet.
This has left experts in the crypto space split into two camps. One camp is very bearish and thinks that the price of Bitcoin has a long way to fall. For instance, Robert Kiyosaki has famously predicted Bitcoin to fall to $1,000.
The bullish camp, however, thinks that Bitcoin has bottomed and the upcoming possible breakdown in the stock and bond markets would lead to a banking crisis that could send the price of Bitcoin surging higher. The extreme opinions of both camps has left many investors confused as to which is more likely to happen.
History is the Best Guide
While we are not able to predict the future, we believe that there could be a statistical method to shed some light on what a possible outcome may be, and below is the method we use to base our prediction – history.
As the saying goes, history never repeats, but it often rhymes. Since markets move in cycles, and especially for Bitcoin, which in its history, has followed its four-year halving cycle to a tee, wouldn’t tracing back what Bitcoin did at which stage and day of its history be able to give us a hint of what is to come next?
With this logic in mind, we decided to count the number of days Bitcoin took to find its bottom in the past to predict when Bitcoin will find its bottom in this cycle.
Days Bitcoin Took to Find Bottom
Let us take a look at how long Bitcoin took to reach its bottom previously now that we have hindsight in our favour.
In the 2014 bull run, Bitcoin hit a high of $1,200 and started falling for 385 days before reaching its bottom at $150 for a fall of 88%.
Similarly, following the 2017 bull run, Bitcoin took 365 days to travel from its peak at $19,200 to reach its bottom at $3,100, clocking a fall of 84%.
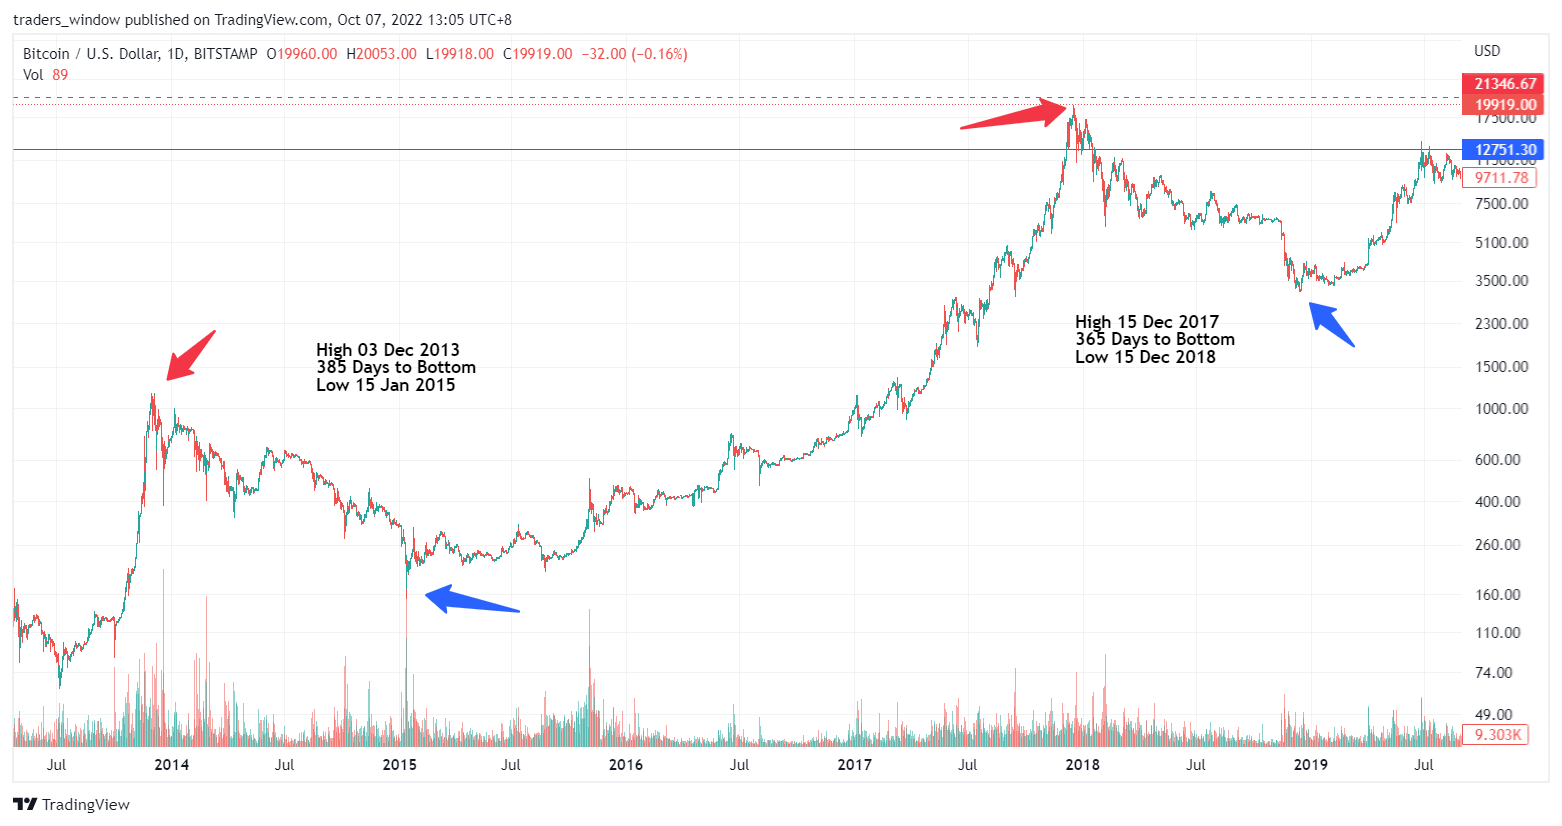
In the previous two cycles, Bitcoin took 385 and 365 days respectively to find its cyclical bottom. However, in the second cycle, Bitcoin took 20 days sooner to find its bottom than the first cycle, which may mean that in this cycle, Bitcoin may take 20 days less than the 2019 cycle to find its bottom. This would translate to 345 days from the peak for Bitcoin to reach its bottom this round.
Bitcoin Could Bottom on 21 October 2022
In this cycle, Bitcoin topped out on 10 November 2021. 345 days from 10 November would give us a date of 21 October 2022, which is just around the corner. Could Bitcoin really bottom on 21 October?
Since this sounds so near yet unimaginable, let us assume that the reduction in number of days does not take place. Even so, following the number of days it took in the previous two cycles, this would put the bottoming at between 10 November to 30 November 2022.
In other words, we could be nearing Bitcoin’s bottom very soon regardless, and this may come in a matter of days, or within a month!
What Price Could the Bottom Be At?
Using the same methodology to estimate when a Bitcoin bottom could be, we derived a price of $13,800 for a probable Bitcoin bottom. How did we get this price? We followed the percentage declines during the 2014 and 2019 bear market. In 2014, Bitcoin fell 88%, while in 2019 Bitcoin fell 84%. Following the same pattern, Bitcoin ought to fall by 80% this cycle as the percentage decline reduced by 4% from 2014 to 2019.
What Is Bitcoin’s Chart Saying?
Now that we have some dates and a probable price in mind, let us look at Bitcoin’s chart to see where its current trajectory could bring us, and whether they match up with our above conclusions.
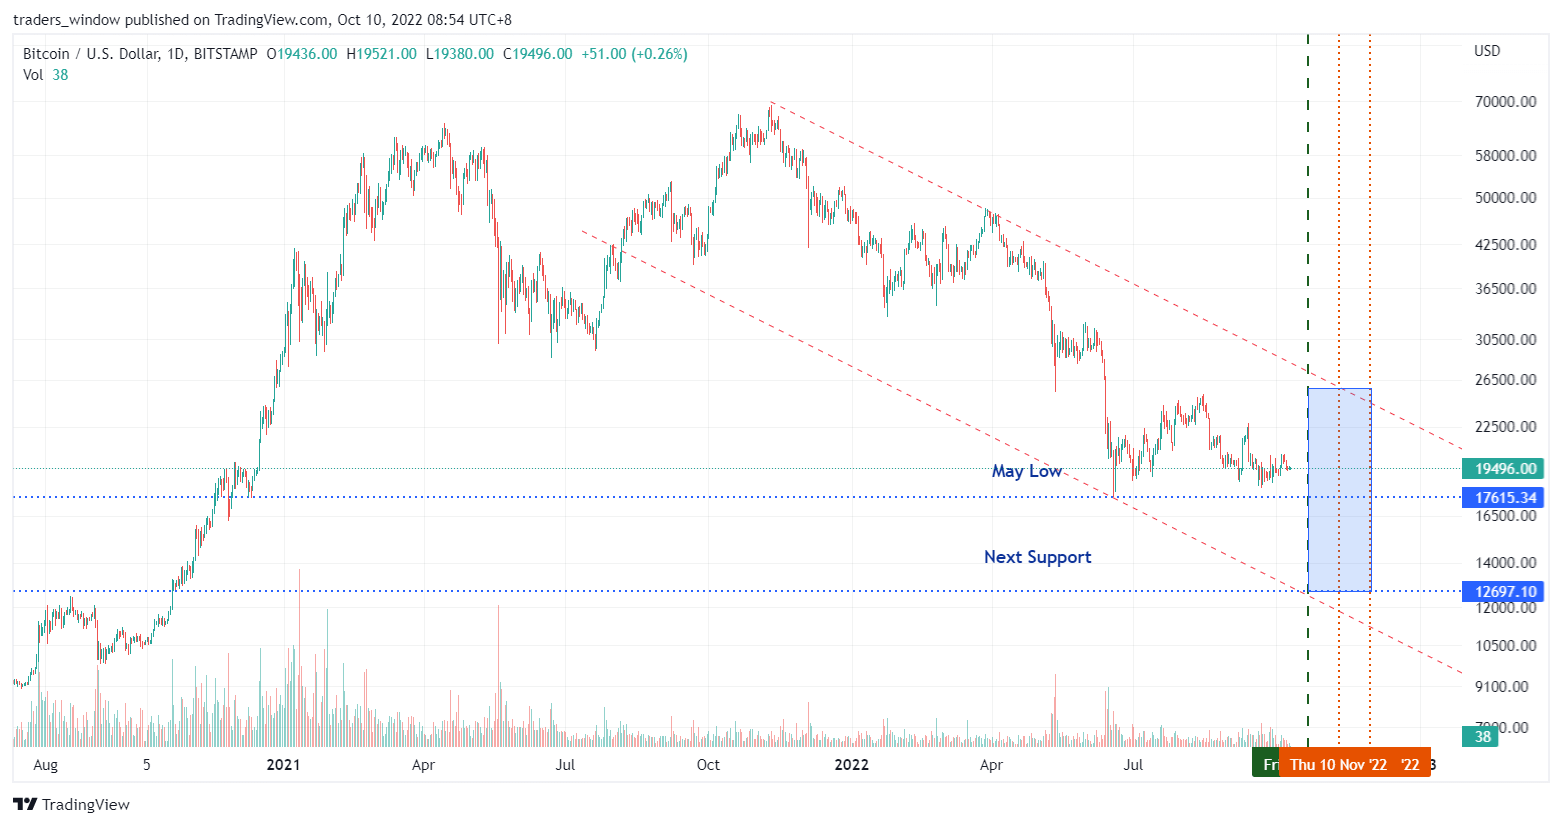
Bitcoin has been travelling down the trend channel that has been mapped out in the red dotted line in the diagram above, where it has been consolidating around $19,000 instead of falling through May’s low of $17,620. This seems to show that Bitcoin is showing strength at current levels and it is not easy to get Bitcoin to break below the May low of $17,620.
For your easy reference, we have put in Bitcoin’s May low of $17,620, its next area of support at the bottom of the trend channel, which is at around $12,700, as well as mapped out the important dates where Bitcoin could bottom. These are 21 October in the green dashed line, as well as 10 November and 30 November in yellow dotted lines. Please feel free to use your imagination to perceive where you think the price of Bitcoin would be on those dates.
For us, we would think that with no major macro news from now till 21 October, with only the 13 October release of US CPI figures the major risk event, it seems unlikely that Bitcoin would fall through $17,620, although nothing is certain in the trading world.
We believe another probable bottoming date could be between 21 October and 10 November, as it will coincide with the Fed meeting on 2 November, where the central bank is expected to raise rates by another 75-bps. However, it is hard to imagine that Bitcoin will fall by another 30% from a rate hike that has already been priced in by the market, unless of course, the hike is by a larger than expected magnitude.
In the aftermath of the 21 September 75-bps rate hike, Bitcoin merely lost 9%. Unless a major black swan event occurs, it is hard to picture Bitcoin losing another 30% from here.
Given the above information, we are inclined to think that Bitcoin could revisit the level of $17,620 again for a successful retest which would make it a double bottom. Should $17,620 be the bottom, Bitcoin would have lost around 74.5% in this cycle, which isn’t too far off 80% either.
In the event a black swan occurs and a large fall really comes, we do not think that it would go below $12,700, which is the bottom of the trend channel. Regardless of where Bitcoin would go from here, no one would deny that we are currently nearer to the bottom than we are from the top since history is suggesting that a bottom could be only a month away.
With this in mind, aiming to get in at the lowest possible price may not be the best method to buy Bitcoin right now. Setting a DCA strategy to buy at regular intervals over the coming month may work out better for an investor.
Please note that the above views and illustrations are the personal opinions of the author and do not represent Margex’s official opinion on the market. The article is written for informative purposes and should not be construed as a solicitation to trade, nor is it financial advice. We recommend that you do your own research before trading and to never trade more than what you can afford to lose. When in doubt, please speak with your personal financial advisor.


