
Trading Bitcoin (BTC) and other crypto assets in the financial market come with a lot of practice and technical analysis tools to stay profitable in the crypto market. Most traders, investors, and institutions employ different approaches to help them carry out BTC technical analysis to determine the uptrend and downtrend and when to trade, buy, and sell these assets to stay profitable.
Over the years, Bitcoin’s price action and market structure have seen major advancement and growth. Hence, most people need to be grounded in technical analysis of the financial market, market trends, and even chart patterns in other to spot the right moments when the market presents itself for the best returns.
The volatility and price action that comes with Bitcoin have made many find the best strategy for trading this asset. With the necessary knowledge in technical analysis coupled with the right psychology, there are many opportunities that come from trading BTC.
This guide uses BTC technical analysis to your advantage, using chart patterns, indicators, and oscillators to determine the best time to open a trading position, either long or short, for Bitcoin (BTC).
What Is Bitcoin
Bitcoin is the first and most widely recognized digital cryptocurrency that enables peer-to-peer exchange of value in the crypto space or industry with the help of decentralized protocols, cryptography, and consensus mechanism to achieve an up-to-date periodic transaction ledger called a blockchain.
Bitcoin is also known as digital money that exists independently and is not controlled by the government or financial institutions. It can be transferred globally without the help of an intermediary or middle organization to facilitate the transactions.
Bitcoin was launched anonymously in January 2009 by a small group of technologists led by Satoshi Nakamoto ideas as regards BTC was based on a whitepaper in 2008 titled “Bitcoin: A Peer-to-Peer Electronic Cash System.” Satoshi released the initial Bitcoin software as open-source software, and users can install it to begin using Bitcoin.
The utility of Bitcoin was a big motivating factor that drove the mass adoption of digital currency as a means of transacting value to the digital easily and at a very fast rate. Many are becoming interested in cryptography and privacy-enhancing technologies as political and social change push Bitcoin’s adoption and significant growth.
The price and mass adoption of Bitcoin rose with significant growth after a few years of knowing this great technology. This led to a break out of many exchanges making conversion of local currency to Bitcoin easy. Other entities, businesses, and El Salvador are adopting Bitcoin as its primary currency.
Technical Analysis: An Overview (Show Examples From Margex)
Technical analysis is the use of chart patterns, price actions, oscillators, market structure analysis, and other tools by traders to forecast the price movement of Bitcoin and other crypto assets while executing trading strategies that increase profitability and return on investment (ROI)
Although technical analysts use chart patterns and other trading tools to determine an asset’s current trend, strength, support, and resistance, this information may appear insufficient with the evolving trends in the crypto space; there is a need to use more advanced techniques to predict price movement better. As a result of their belief that market variables are always reflected in their price, technical analysts use technical analysis to forecast the price movement of digital assets.
As a result, traders who believe the market moves in trend and combine market phases with their technical skills have better opportunities than traders who trade based on technical analysis because they need to improve their ability to adjust strategies to fit the market.
Identifying the market’s phases would aid in risk management and getting the best results from the market. The common phases of market structure are divided into distribution, accumulation, uptrend, and downtrend phases.
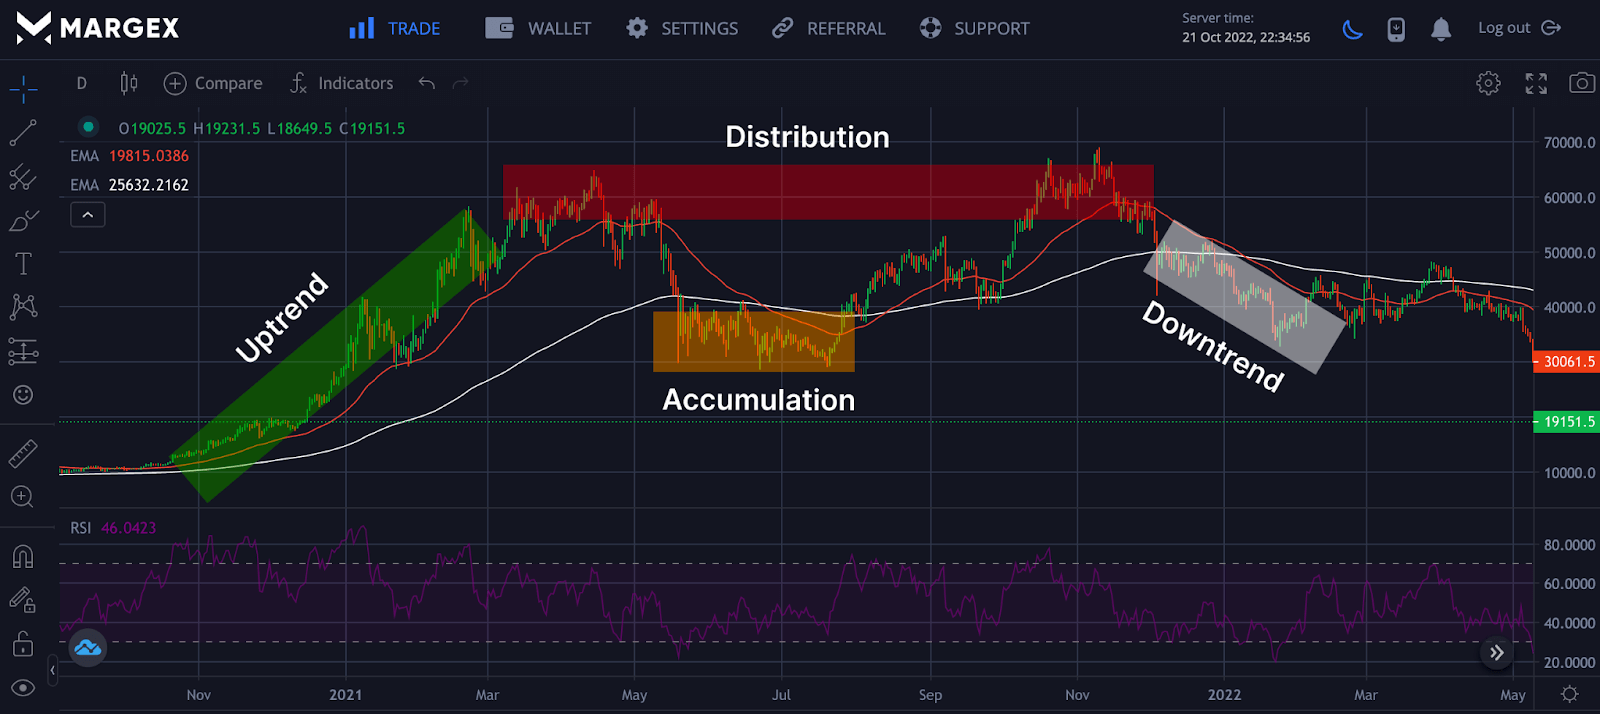
The image above shows BTC’s technical analysis showing the different phases of market cycles. The green region shows BTC maintaining an uptrend from a region of $10,000 to $55,000 before going into its distribution phase. The distribution phase can sometimes last months or weeks, depending on market factors. After the distribution phase, Bitcoin price declined, followed by accumulation before starting a rally. Understanding the Bitcoin analysis, volatility, price actions, and market trend give you a better advantage than regular traders.
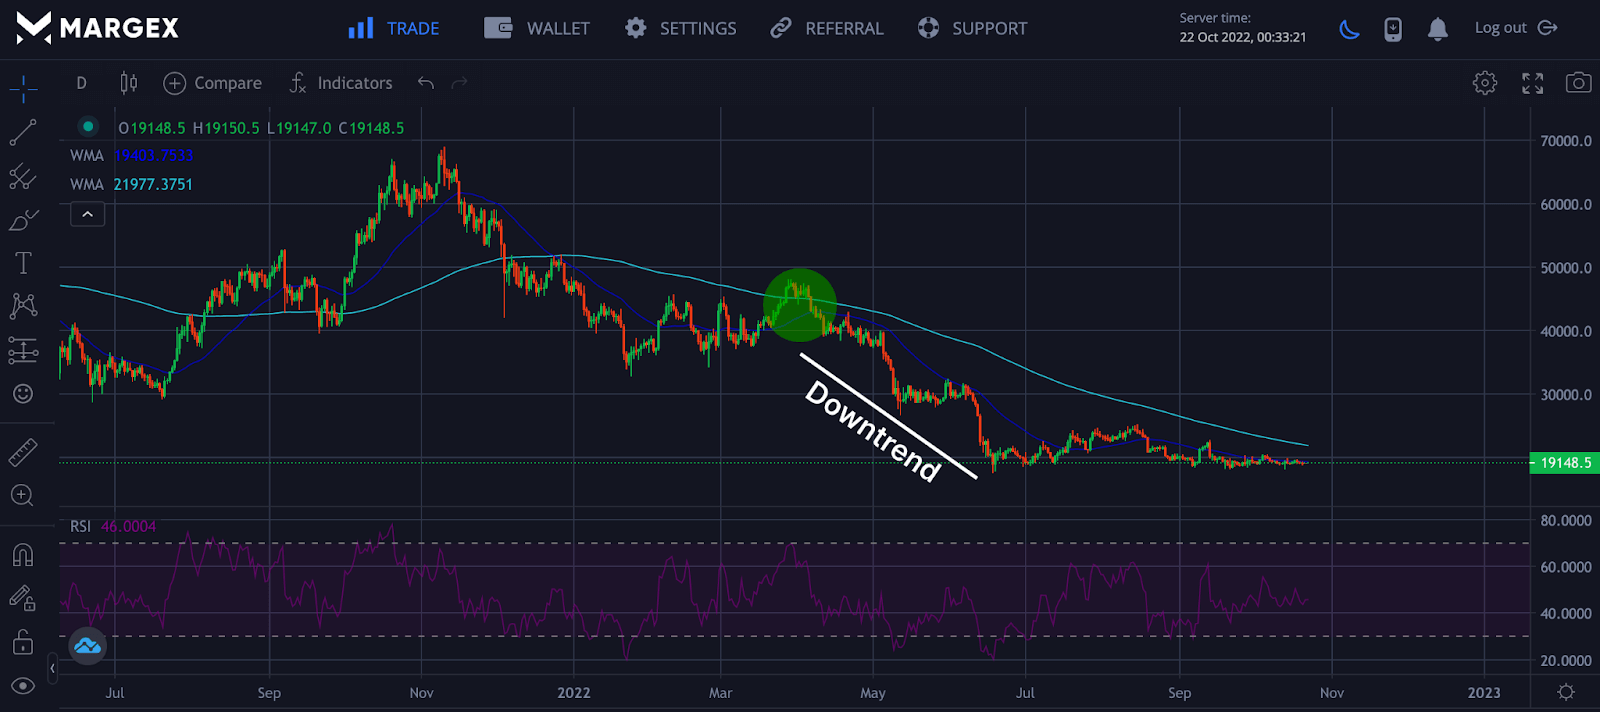
Different tools and indicators can be used to determine the current trend of Bitcoin; we will focus on using 50 and 200-day Exponential Moving Averages (EMA) to predict and forecast the current market trend for Bitcoin prices.
When the price of candlesticks closes below the 50 and 200-day EMA, that signals a potential price reversal to a downtrend; this can also be confirmed with other indicators like the Relative Strength Index (RSI). And when these prices close above these EMAs signals a potential price reversal to an uptrend. Using this indicator in isolation can be tricky during a ranging market and would be best used with other strategies for confluence.
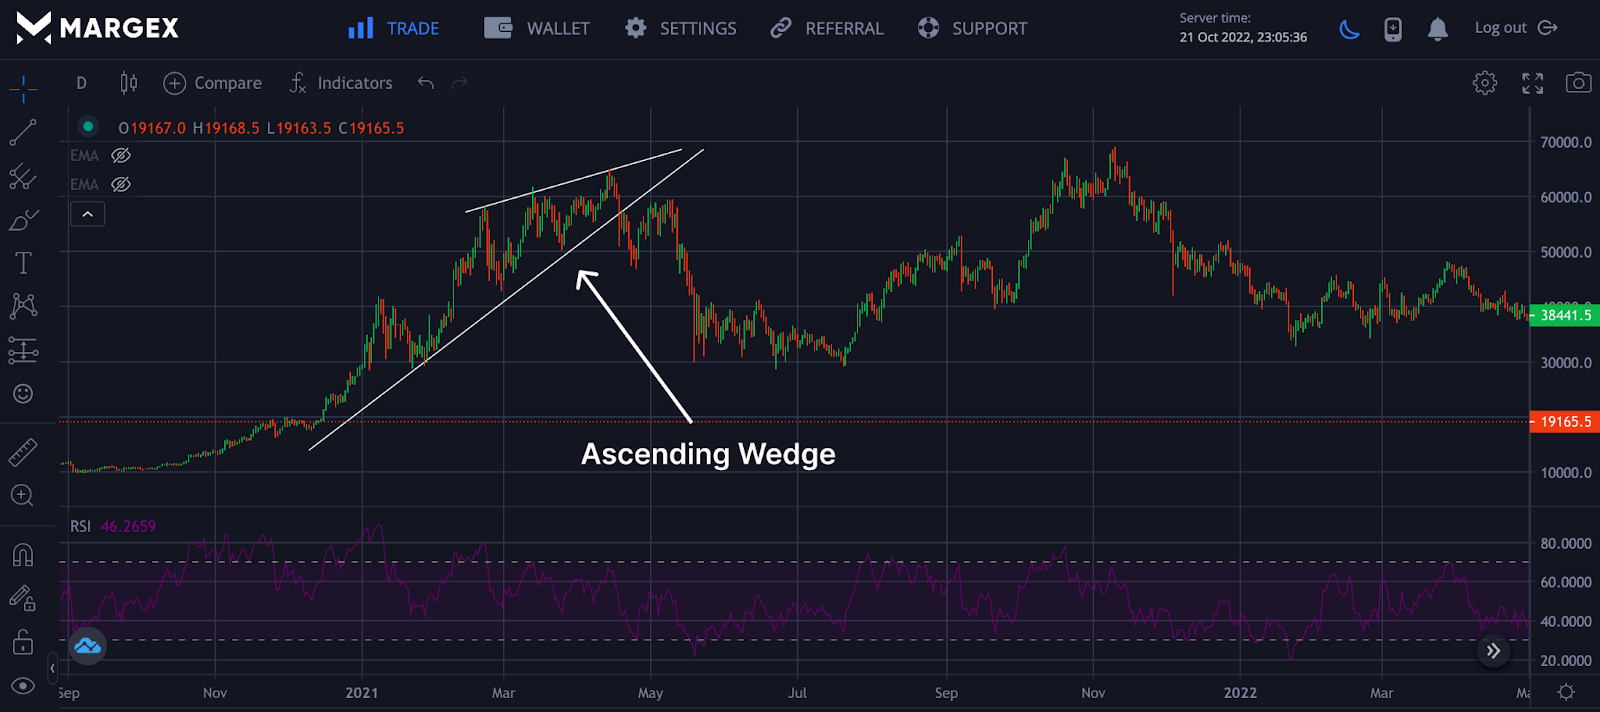
Using chart patterns like the ascending wedge gives traders more confirmation if an uptrend is coming to an end, with a breakout downtrend of the wedge indicating a strong sell signal as sellers have overpowered the market. BTC technical analysis is a strong tool to forecast and predict the price direction of Bitcoin, altcoins, and other cryptocurrencies, helping the trader find the best position for more market opportunities. Let us see how we can use other technical analysis tools in-depth.
Getting Started With Bitcoin Technical Analysis Indicators
Technical analysis indicators are chart analysis tools traders use to understand price action best and predict and forecast the price of an asset. There are different technical analysis indicators on the Margex platform that can help traders analyze trends, trend reversals, measure volatility, and much more. This article will explore the Relative Strength Index (RSI), Moving Average Weighted, and William Fractal. We reveal how to use them and effectively combine them with other strategies for better profitability.
Margex is a Bitcoin-based derivatives exchange that allows you to trade Bitcoin and another cryptocurrency with up to 100X leverage. At the same time, you can stake your tradable crypto assets to make up to 13% APY. Margex allows everyone to own a Bitcoin wallet address without any stress. With the help of the Margex automated system, staking rewards are distributed daily without lockup periods.
Margex unique staking feature and Bitcoin technical analysis tools can be accessed on Margex if you have an active account; if not, you need to open an account on Margex to access all of these features. Let us find out how to use the technical indicators on the Margex platform if you don’t know how to do so.
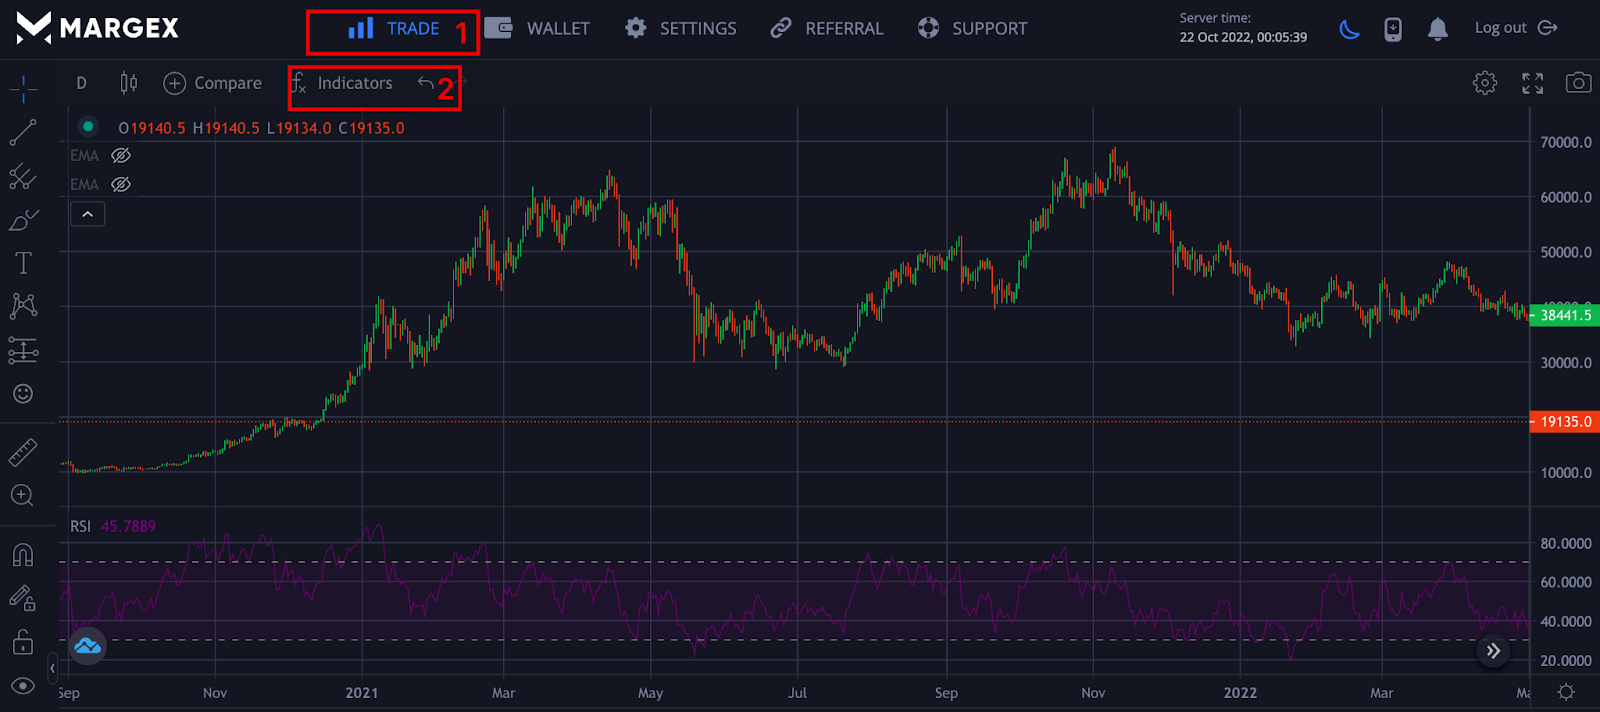
- Trade: On logging into the Margex platform to trade, you need to click on the trading symbol represented by 1 to enable you to access all technical analysis tools.
- Indicators: You will get access to so many indicators free of charge by clicking on the indicators. One needs to search for your preferred indicator and click to trade with it to use it.
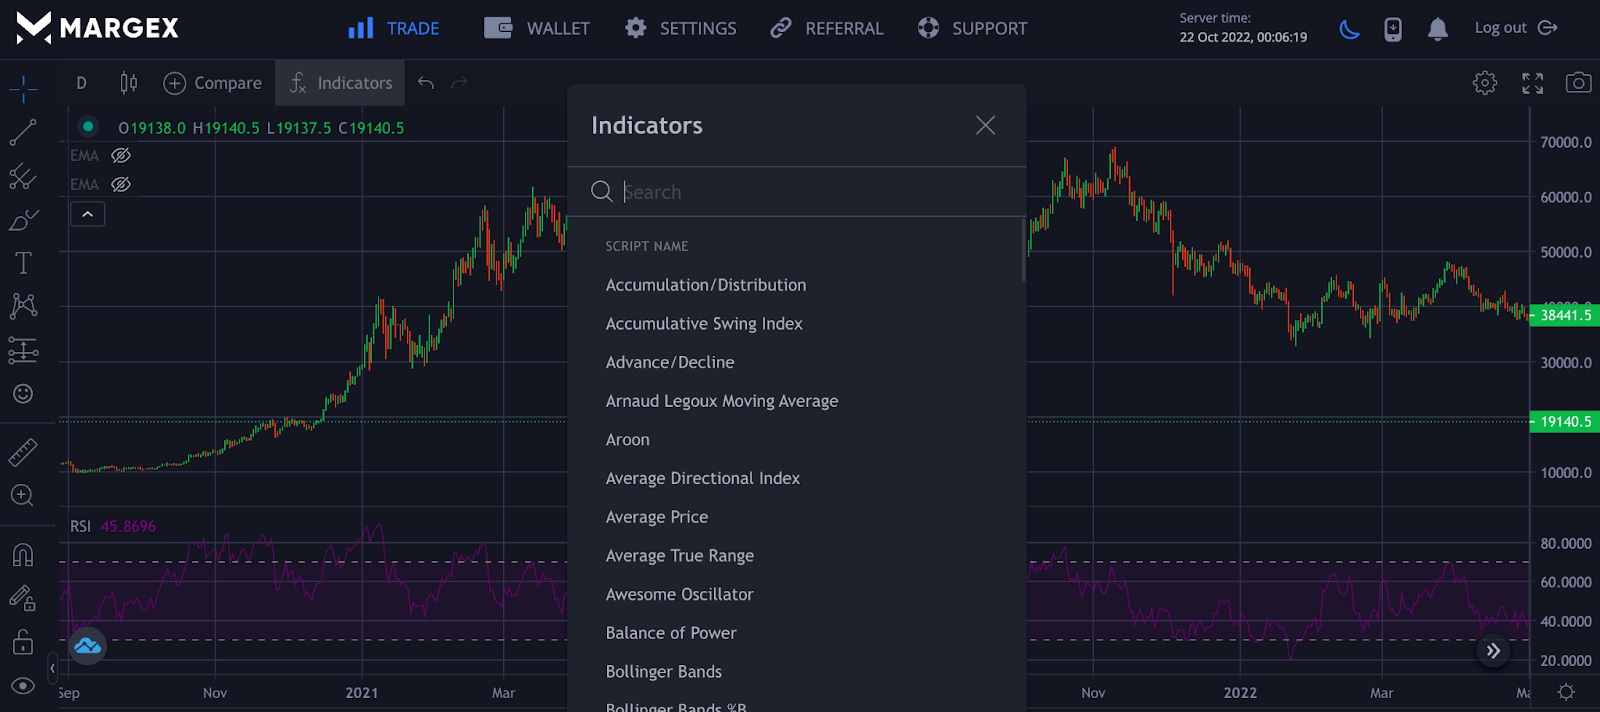
Technical analysis indicators are divided into trend following, oscillators, volatility, and support/resistance indicators. Let us turn our attention to the common and mostly used.
Moving Average Weighted (MAW)
The Moving Average Weighted (WMA) is a technical analysis indicator used by traders to generate accurate price directions and decide whether to buy or sell. Moving Average Weighted places more emphasis on recent data points and less on past data making it preferable to Simple Moving Average.
Traders use this analysis tool to generate trade signals for Bitcoin; for example, when prices close above the Moving Average Weighted, this could indicate a potential price reversal from a bearish trend to a bullish trend. However, if the price closes below the moving average, this could indicate a downtrend price movement, and a trader could look to go short on Bitcoin assets.
From the chart above for the BTCUSD pair, after the BTC price closed below MAW, there was a sharp price decline indicating bears taking control over the market, and a trader could look to open a short position for BTC.
Relative Strength Index (RSI)
The Relative Strength Index (RSI) is a momentum indicator used by BTC technical analysts to spot overbought or oversold scenarios when trading BTC and other crypto assets.
RSI calculates the high and low bands during and sells assets over time. Due to the high volatility of the crypto market, the RSI indicator provides a good opportunity for entry and exit for traders, thereby becoming one of the widely used indicators for both beginners and advanced traders.
J Welles Wilder Jr. birthed this tool to evaluate price change over a 14-period. Despite how reliable it has been for many traders, it shouldn’t be used in isolation as this tool is not 100% guaranteed for trading and can sometimes be exploited, producing false signals.
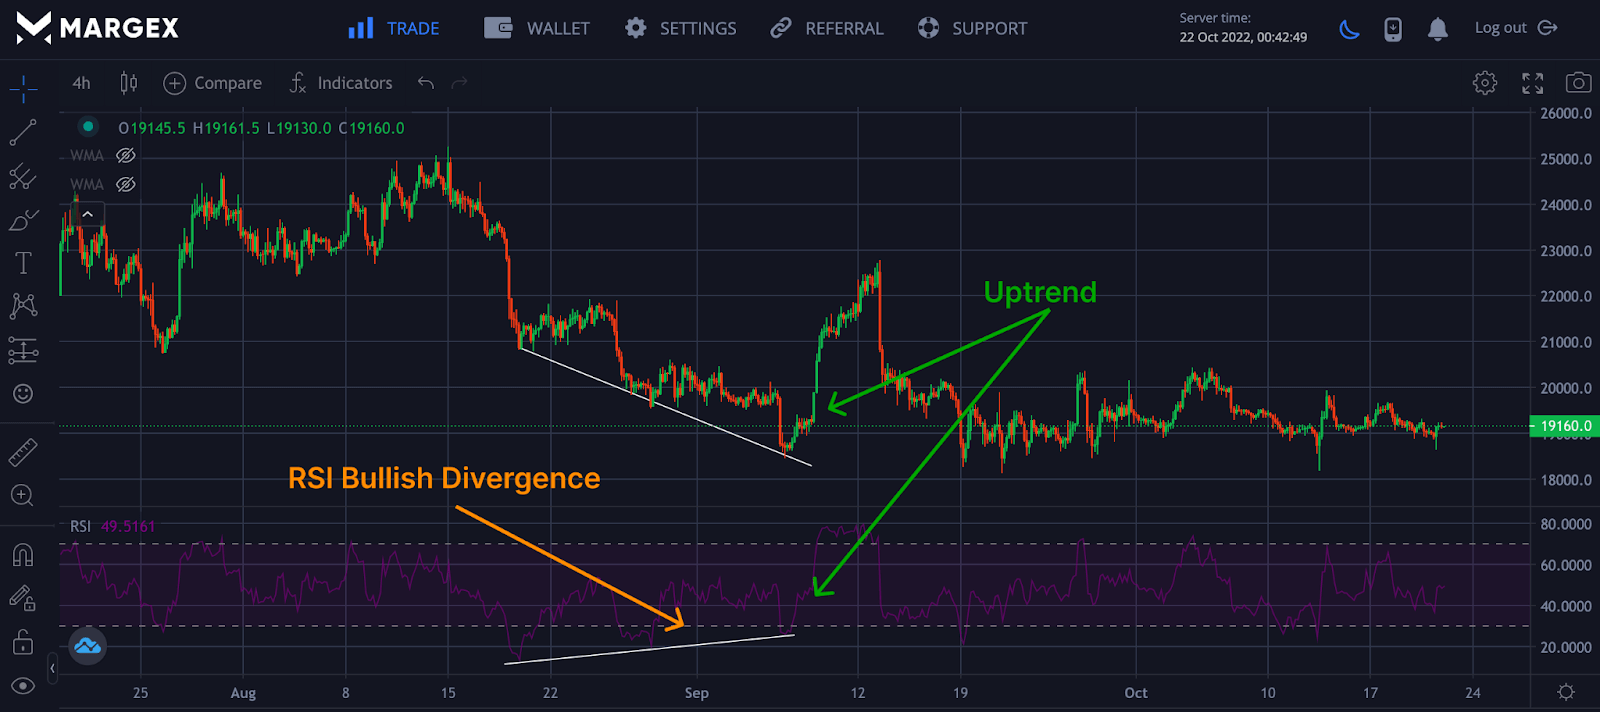
From the chart of the BTCUSD pair, the Relative Strength Index dropped to an oversold region as the price bounced off from that region. RSI formed a bullish divergence confirmed as the price rallied from low to high in the four-hourly timeframe.
RSI divergences are reliable when identified and can be used to trade BTC technical analysis to predict the next price direction; with other strategies used with RSI, a confluence can be achieved.
Williams Fractal
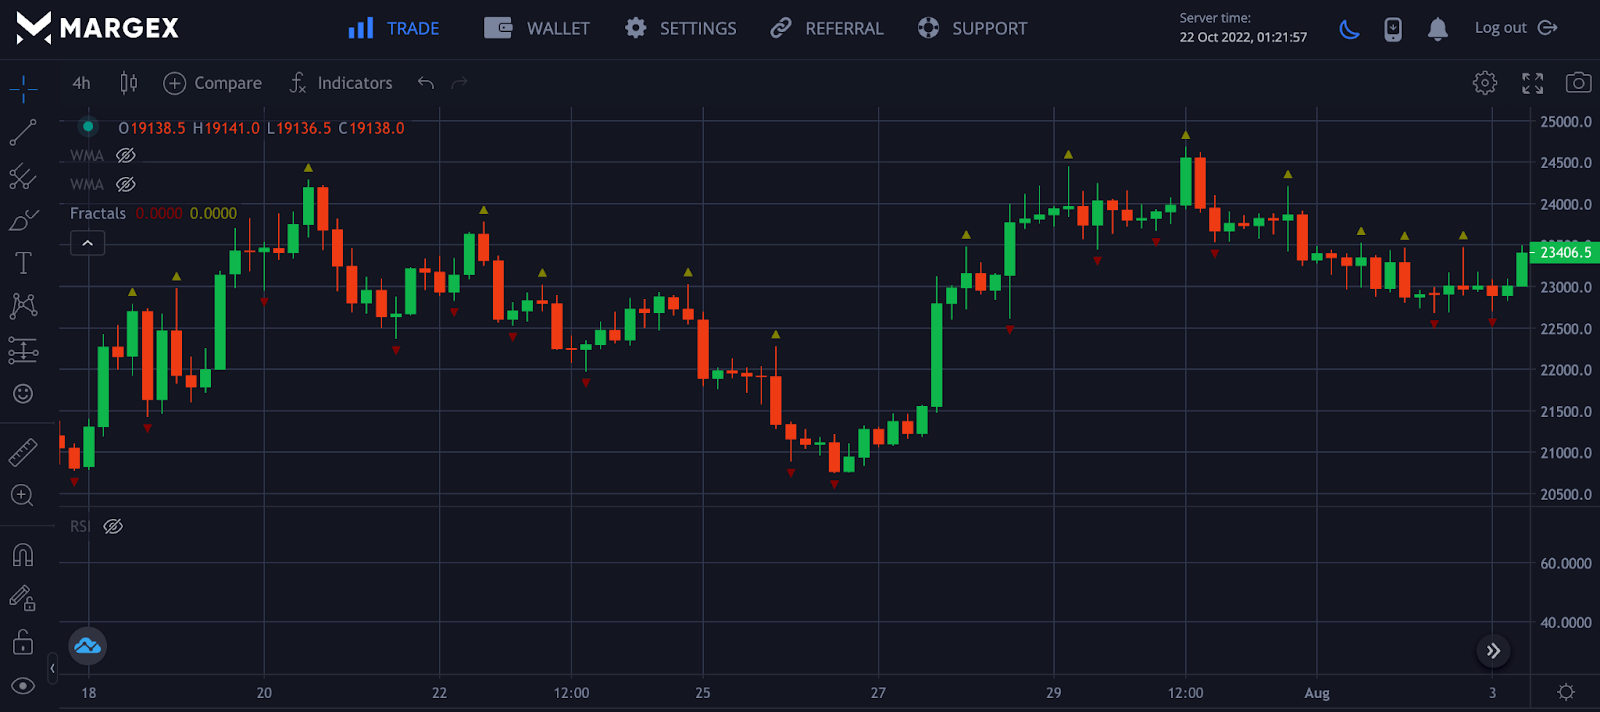
Williams Fractal is a Bitcoin technical analysis indicator traders use to spot trend reversal. The Williams Fractal indicator is based on small triangles that appear below or above candlesticks. Red fractals are identified as a bullish uptrend, while orange fractals are seen as a bearish downtrend.
This indicator was produced by Bill Williams and used the triple Simple Moving Average for its calculations. This trading indicator is sometimes considered outdated because of how often it produces false signals and would best be used with other trading strategies or indicators for better results.
Fundamental Analysis VS Technical Analysis
Technical analysis and fundamental analysis are the two major ways of predicting and forecasting the crypto market. Still, they are in a different world as traders drag, which should take more precedence ahead of the other. Institutions, traders, and investors conduct research considering these two factors.
Bitcoin Technical Analysis
BTC analysis differs from fundamental analysis in that traders predict and forecast the price movement of BTC and other crypto assets with the help of price actions and price trends to help spot opportunities to trade these assets.
Bitcoin Fundamental Analysis
Bitcoin and other crypto assets are measured by their intrinsic value, considering the overall economy and industry conditions that affect the price and strength of the asset.
Frequently Asked Questions (FAQ)
Technical analysis of BTC is a topic that need to be learned for one to become a successful trader in the crypto market as BTC prices affect other cryptocurrency. Here are commonly asked questions from traders like you.
How To Do Bitcoin Technical Analysis
Different technical tools and indicators can be used to conduct technical analysis of Bitcoin and other cryptocurrencies in the global financial and cryptocurrency markets.
The first step to accurate technical analysis on Bitcoin is to gain expert knowledge and insights on the various technical indicators and tools used in technical analysis.
Thorough research on Bitcoin’s price performance and history can be a support tool in addition to other technical indicators used for technical analysis.
Traders may use multiple technical indicators and tools to validate and aid confirmations on possible Bitcoin trade entries in the cryptocurrency markets.
What Is Bitcoin Doing On Technical Analysis Now
Bitcoin is a top cryptocurrency traded and analyzed by the majority of traders on trading platforms and cryptocurrency exchanges.
According to trade and market experts on cryptocurrencies, Bitcoin may currently be trading in a downtrend. Different experts and beginner traders apply a wide range of technical and trading tools in the technical analysis of Bitcoin.
However, some traders and investors may look to and consult from the technical analysis made by cryptocurrency market experts on the future price directions of Bitcoin.
Traders and investors need to conduct personal research and build applicable knowledge of technical analysis on Bitcoin and other cryptocurrencies.
What Are The Benefits Of Technical Analysis?
The advantages and benefits of applying technical analysis to cryptocurrency trading are numerous.
Applying and adopting technical analysis to trading in the cryptocurrency markets enables a trader to be strategic about trading and achieving positive trading goals.
Traders who leverage technical analysis gain full insights into market prices of individual cryptocurrencies, past price performances, future price directions, and opportunities for trade entries.
Many traders utilize technical analysis of various cryptocurrencies on renowned trading platforms and cryptocurrency exchanges at no cost.
Globally recognized cryptocurrency exchanges and trading platforms such as Margex offer a free platform for traders to perform technical analyses of their favorite cryptocurrencies.
What Technical Indicator Is Best For Trading Bitcoin?
A variety of technical tools exist and are utilized by many traders on cryptocurrency exchanges for trading Bitcoin and other cryptocurrencies.
Some traders may choose one or multiple technical indicators that suit their trading strategy and with which they are comfortable trading.
Traders should gain full knowledge of applying technical indicators and choose what works for them in trading Bitcoin and various cryptocurrencies.
Margex is a renowned trading platform and cryptocurrency exchange that offers traders a wide array of effective trading tools and technical indicators for seamless trading of favorite and general cryptocurrencies.
Is Technical Analysis Of Bitcoin Effective And Reliable?
Technical analysis, which involves using technical tools and indicators in trading, may be an effective guide to becoming profitable in trading Bitcoin and various cryptocurrencies.
However, traders may need to get hands-on experience and knowledge of technical analysis to apply it effectively and successfully and become profitable in the cryptocurrency markets.
Traders who leverage technical analysis skills may become highly successful and have a positive win-loss ratio trading in the financial and cryptocurrency markets.
Traders should constantly put in the work in adequate learning of technical analysis and conduct personal research on various cryptocurrencies, including Bitcoin.


