
When it comes to the cryptocurrency market, there are several staples that technical analysts swear by. This basket of trading indicators include the Relative Strength Index, MACD, Ichimoku, and the Bollinger Bands. Each of these tools offer the analyst a unique way of interpreting the market, which when combined can increase the probability substantially for a successful trading setup.
In this Bollinger Bands crypto trading guide, we’ll teach the aspiring cryptocurrency traders how to effectively use the tool to trade crypto. The guide will also discuss various Bollinger Band trading strategies, top and bottom patterns, and how to use the tool to measure price volatility and find dynamic support and resistance levels.
What Are The Bollinger Bands? The Popular Technical Indicator Explained
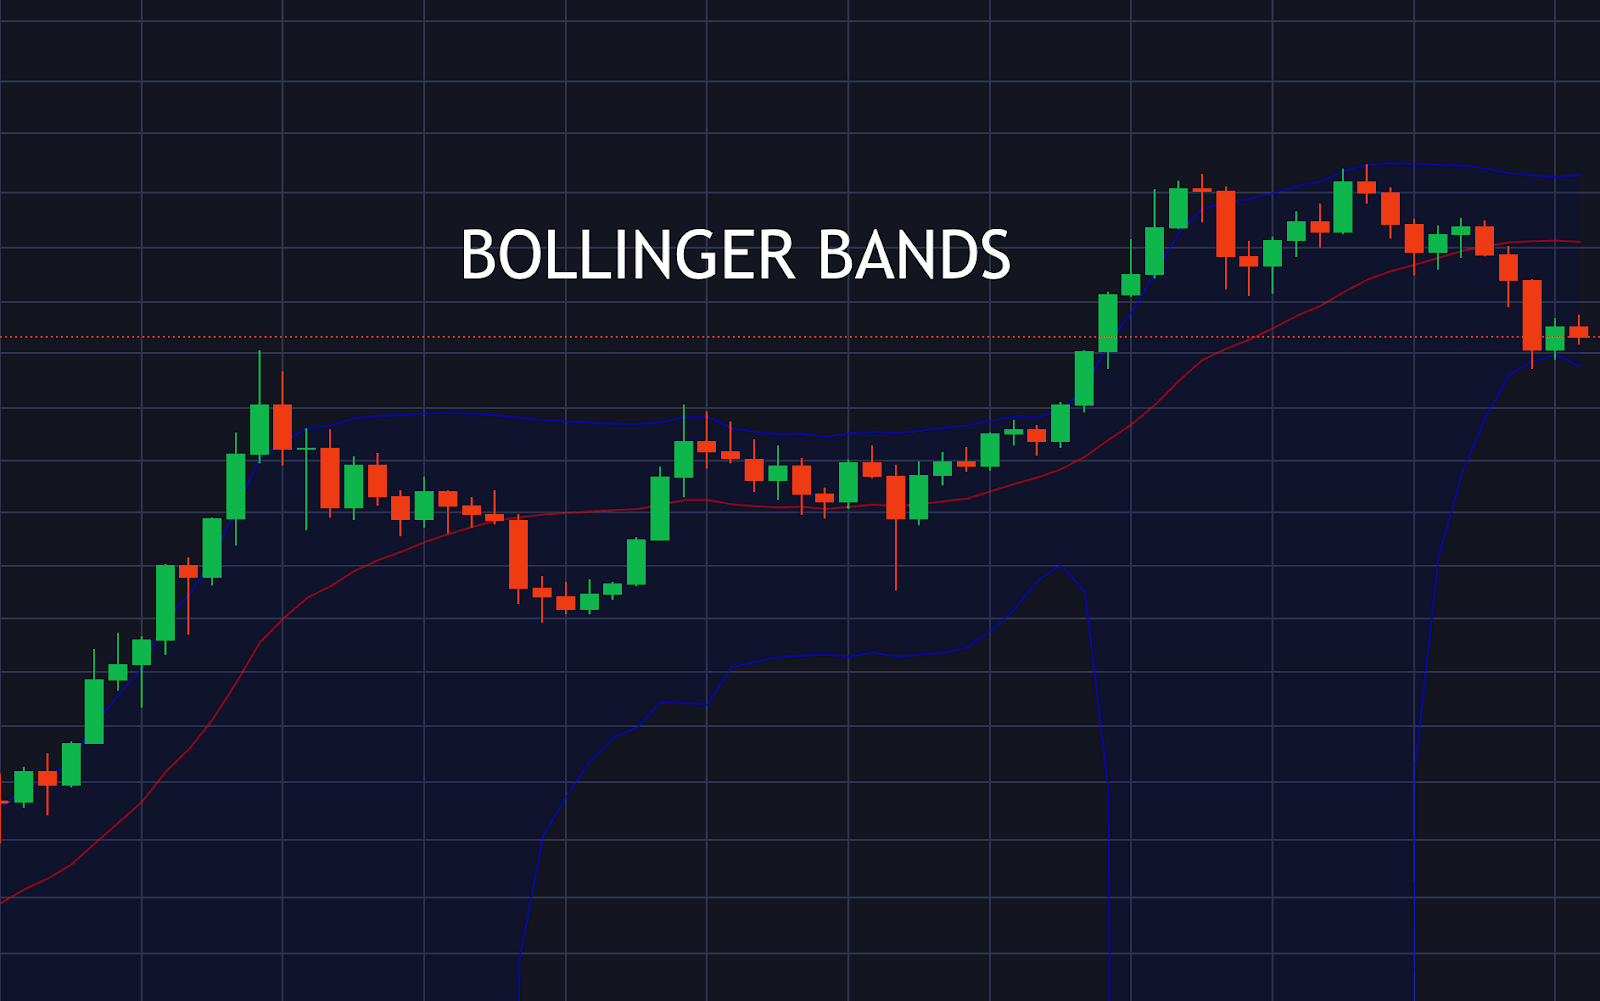
The Bollinger Bands are a popular technical indicator developed in the 1980s by market analyst John Bollinger. Bollinger trademarked the technical tool and has developed a list of 22 rules for how to use the tools to read the market.
The Bollinger Bands are a visual price chart overlay of a 20-period simple moving average within a price envelope set at two standard deviations. John Bollinger claims that as much as between 88 and 89% of all price action takes place within the bands. A tag of the upper band or lower band can often lead to a trend reversal.
The Bollinger Bands are a trend-following indicator, yet work well within a trading range by signaling when an asset is oversold or overbought. Because the distance of the bands from the moving average are based on standard deviation, they narrow or expand based on price moves and can be used to measure volatility. It can also be used to trade breakouts or as part of a mean reversion strategy.
What Do The Bollinger Bands Tell The Crypto Market?
The Bollinger Bands are an envelope of the middle band SMA. Price reaching the top band signals that prices are high relative to historical price action. In contrast, price reaching the lower band signals that prices are low relative to historical price action.
How narrow or wide the Bollinger Bands are at any given moment can also tell the cryptocurrency trader a lot about what is going on in the market and how volatile the trend is. When the upper and lower bands tighten, it suggests there is a lack of a trend and a low volatility phase. During this time, range trading is preferred. However, after a phase of low volatility, the bands will expand to signal a trending market returning to a high volatility state.
Bollinger Bands Crypto Market Example
Believe it or not, John Bollinger is an active crypto trader and often speculates on Bitcoin publicly via his Twitter account. He will tell traders when it is “time to pay attention” or if a “head fake” is forming. Occasionally, he calls attention to specific Bollinger Band patterns and trading setups.
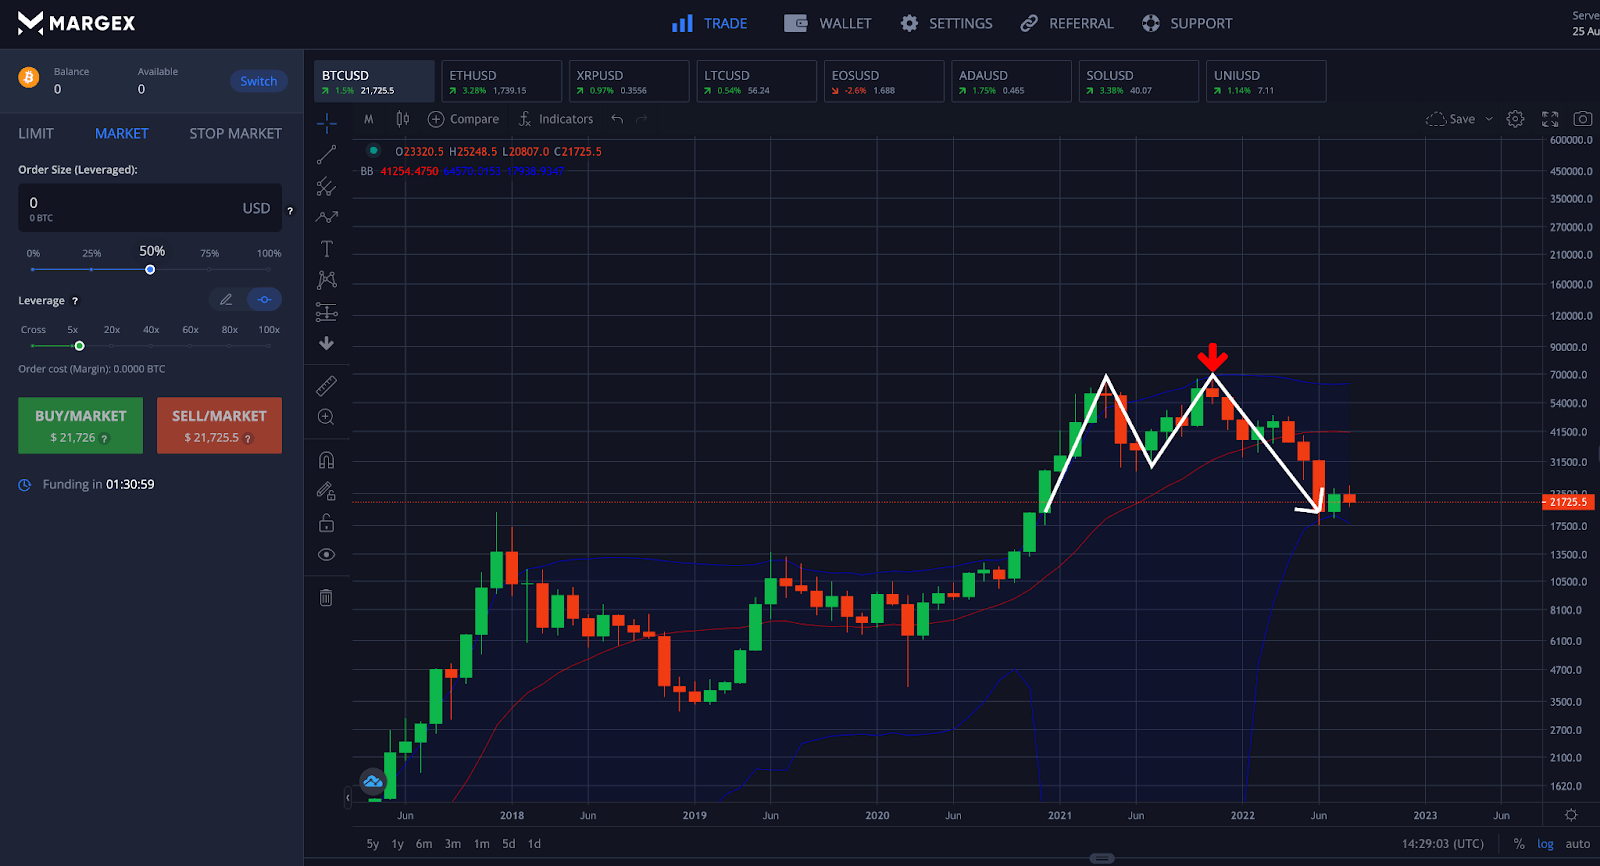
In a real-time crypto market example using Bitcoin (BTC-USD), we can see that the Bollinger Bands were used to confirm an M-top pattern when the top cryptocurrency set its current all-time-high.
We can see that Bitcoin rides the upper bands during a bear market breakout, and rises to a high in April 2021. The strong uptrend reverses temporarily with a bearish candlestick toward the middle band, but doesn’t quite make it. There was another rally head fake to the upper band in mid-November 2021 which presented a potential short-sell setup. An investor or trader would place a stop-loss above the upper band.
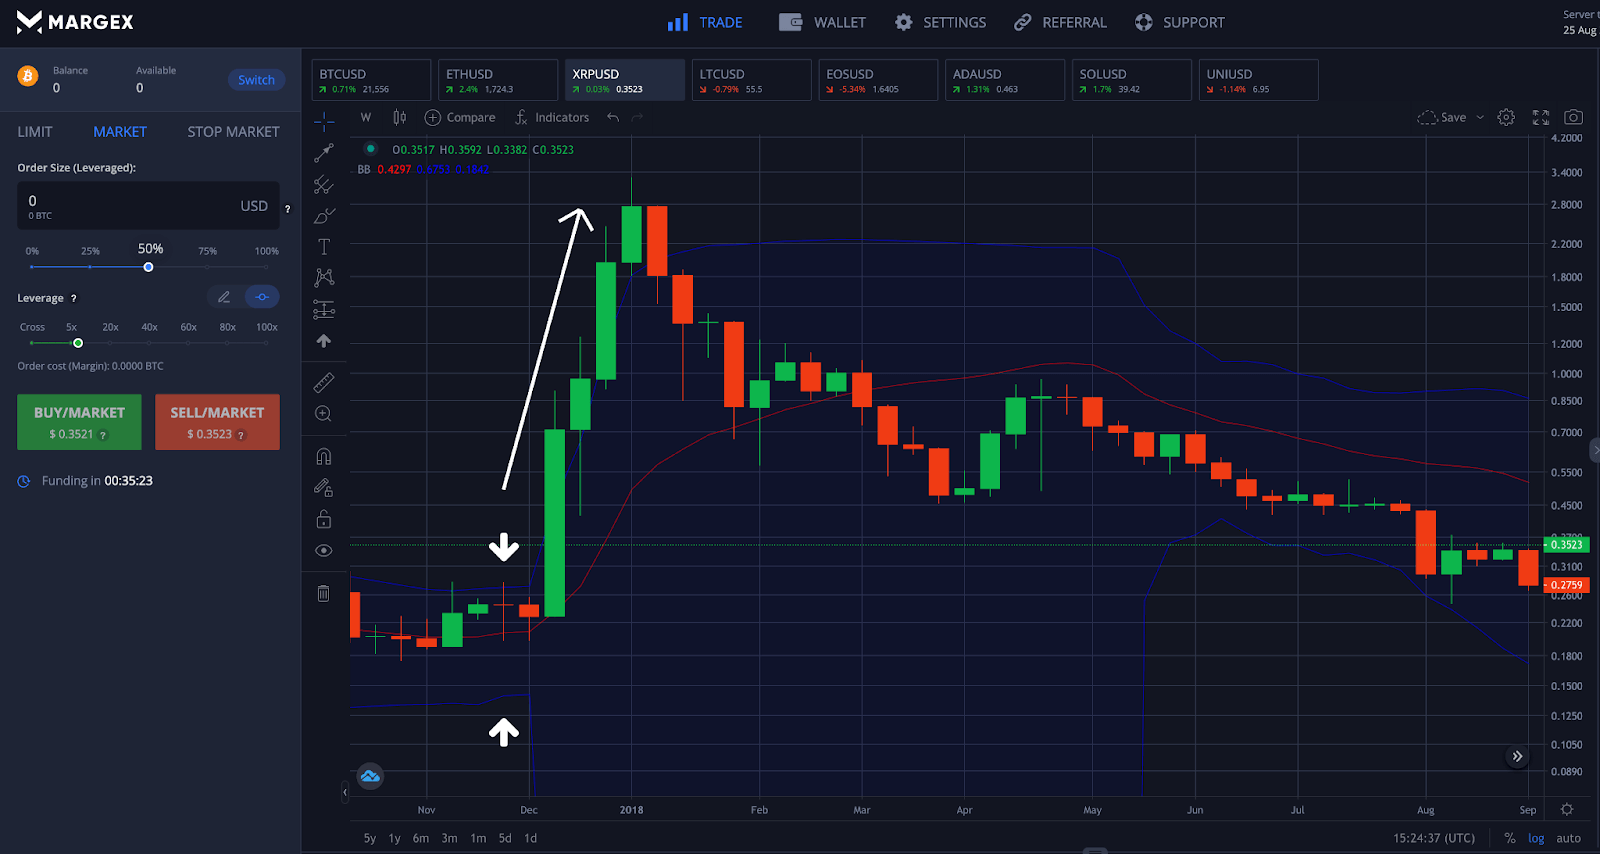
In another crypto market example using Ripple (XRP), we can also see a situation where a Bollinger Bands squeeze led to a massive breakout and price action began to ride the upper hand to incredible new all-time highs.
It takes a lot of strength to break out of the upper or lower band, which is a signal to the market of a very strong trend. XRP price climbed by more than 1,000% to its all-time high set in January 2018.
How Are The Bollinger Bands Calculated?
The Bollinger Bands calculation is as follows:
Middle Band = n period simple moving average (SMA)
Upper Band = n period SMA + (n period standard deviation of price x 2)
Lower Band = n period SMA – (n period standard deviation of price x 2)
Where:
N = 20
Note: The SMA period is set to 20 by default but can be modified.
Custom Bollinger Bands Settings For The Cryptocurrency Market
There are no agreed upon custom settings for the Bollinger Bands that make trading cryptocurrencies easier or better reflect the always-on crypto market that trades 24/7 and 365 days a year.
However, crypto traders are encouraged to experiment with a variety of settings. Both the SMA period and standard deviations can be altered depending on the timeframe.
The default settings are set at a 20-period moving average, and the default standard deviation is set at 2. Crypto traders can lower these settings to 15 and 1.5 for a lower timeframe or increase to 25 and 2.5 for longer timeframes.
What Does The Bollinger Band Squeeze Indicate? Using The Upper Or Lower Band For Breakout Trading
The Bollinger Bands are known best for two things: the Bollinger Squeeze and the Bollinger Bounce. The Bollinger Bands narrowing is a signal that a volatility squeeze is coming after a period of low volatility. Low volatility occurs due to a lack of general direction. When the market picks a direction, volatility returns and creates an entry opportunity for a breakout trade.
Although most of the price action takes place within the Bollinger Bands, a squeeze setup is an ideal time to look for an opportunity to “walk the bands,” or “ride the bands” if the breakout develops into a strong uptrend or downtrend.
What Does The Bollinger Band Bounce Indicate? Using The Upper Or Lower Band For Breakout Trading
Although the Bollinger Squeeze is far more famous, the Bollinger Bounce is not to be underestimated. John Bollinger states that as much as 88 to 89% of price action takes place between the upper and lower band. Prices also tend to gravitate back toward the middle line 20-period SMA.
Because the upper and lower bands can act as dynamic support and resistance, they also act as an area where prices can bounce off the bands and snap back toward the lower band with an elastic band like effect. This type of Bollinger Band trading strategy works best during ranging markets.

What Other Indicators And Oscillators Are Based On The Bollinger Bands?
John Bollinger also developed some supporting tools based on the Bollinger Bands, which include %B and Bollinger Band Width. Here is a deeper explanation of what each supporting tool entails.
Bollinger Bands Width (BBW)
The Bollinger Bands Width formula is:
BandWidth = (Upper Bollinger Band – Lower Bollinger Band) / Middle Bollinger Band)
Although the Bollinger Bands themselves help to provide a visual read on price volatility, the Bollinger Band Width tool makes it a lot easier to interpret readings and analyze behavior. Like the name implies, the tool measures the width of the band, essentially providing an indicator that interprets volatility.

%B
The B% formula is:
%B = (Price – Lower Band)/(Upper Band – Lower Band)
%B quantifies the price of a cryptocurrency in relation to the upper or lower bands. %B will read below 0 if price is below the lower band and above 1 if price is above the upper band. Otherwise, %B will read between 0 and 0.5 when between the lower and middle bands, while reading between 0.5 and 1 when between the upper and middle bands. %B will give a 0.5 reading at the middle band exactly.

Bollinger Bands Versus Keltner Channels
Both the Bollinger Bands and Keltner Channels often are confused visually due to both tools featuring an upper and lower band separated by a middle band based on a moving average.
However, while the Bollinger Bands are an envelope of price action set at two standard deviations of a 20-period SMA, the Keltner Channels are calculated using an Exponential Moving Average (EMA) and an upper and lower band based on an Average True Range (ATR) set two times above or two times below the middle EMA.
The two tools provide similar, albeit different signals due to the different methods used in the calculation. Both can be used to measure volatility and can signal a possible trend reversal when the upper or lower band is touched.

Bollinger Bands Crypto Trading Strategies
There are many ways to trade cryptocurrencies using the Bollinger Bands. Here are some of the most common yet effective Bollinger Band crypto trading strategies:
Middle-SMA Buy And Sell Signals
The simplest Bollinger Bands trading strategy involves (no pun intended), the simple moving average that acts as the middle line the upper and lower bands are based on.
Traders would want to place a buy order or sell order once price passes through the middle-band, and then close the trade when price touches the next closer upper or lower band depending on which side of the middle-line the order is taken on.

W Bottom Pattern
W-bottoms are bottom-like patterns with a pullback in the middle that forms a W-shape. A W bottom forms at the bottom of a downtrend and indicates a potential bullish reversal.
To confirm the setup, a first low will form outside the lower band. Price will bounce toward the middle band before making a second low. If price breaks up past the neckline after it re-touches it, the pattern is confirmed.

M Top Pattern
M-tops are top-like patterns with a throwback in the middle that forms an M-shape. An M top forms at the top of an uptrend and indicates a potential bearish reversal.
To confirm the setup, a first high will form outside the upper band. Price will bounce toward the middle band before making a second high. If price breaks down past the neckline after it re-touches it, the pattern is confirmed.

Riding The Bands
The majority of price action takes place within the Bollinger Bands. Therefore, it takes an extremely powerful move to close outside of the upper or lower bands, and is a strong breakout signal.
Traders can take a position after price closes above the upper band or below the lower band and ride the bands higher or lower. The strategy is also called walking the bands.

Head Fakes
Head fakes are a phenomenon where price action begins to cause the Bollinger Bands to squeeze and volatility to expand. This pushes prices to either the upper or lower band. However, the head fake quickly sends prices to the opposite band, creating a strong move that stops out any traders attempting to profit from the breakout.

How To Use The Bollinger Bands To Trade Cryptocurrencies Using Margex? A Step-By-Step Guide
The user-oriented Margex cryptocurrency trading platform offers short and long positions with up to 100x leverage, and advanced chart tools. The platform also includes access to powerful technical indicators like the Relative Strength Index (RSI), Average True Range (ATR), Accumulation-Distribution, Ichimoku Cloud, and the Stochastic RSI.
Using the built-in technical analysis tools provided by Margex, the following steps will walk you through using Bollinger Bands to trade any cryptocurrency like a pro:

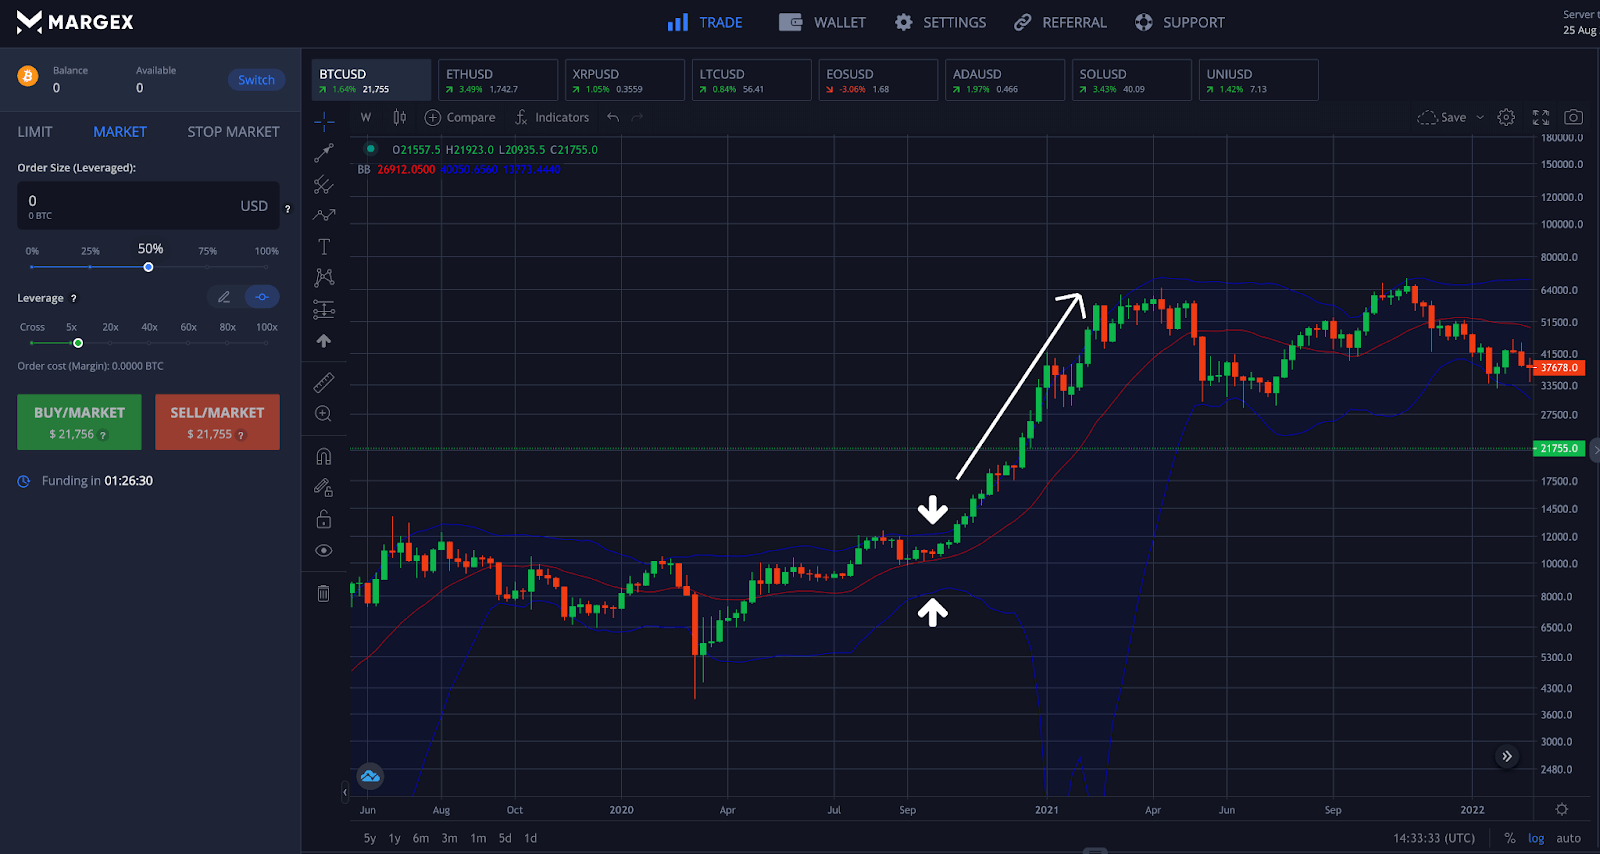
Step 1 – Open up the Bitcoin (BTC) price chart and turn on the Bollinger Bands across any timeframe. Look for failure to breach the upper band after a retest of a strong trend.

Step 2 – Place a sell order or go short after prices fail to make it outside of the upper Bollinger Band, signaling rejection and a Bollinger Bounce.

Step 3 – Place a stop loss order above the wick of the local swing high and above the upper band of the Bollinger Bands. Where you place your stop-loss should also be defined by your risk management strategy and position sizing.

Step 4 – Consider taking profit at either the middle band or the lower band. Using Margex, orders executive at the price level you want fast, and without slippage. Congratulations! You have now traded crypto using the Bollinger Bands.
The Margex margin trading platform also offers crypto staking on idle crypto assets and an all-new, innovative trade while staking feature.
Bollinger Bands Crypto FAQ: Commonly Asked Questions About The Popular Technical Analysis Tool For Crypto Trading
The Bollinger Bands are an easy to use visual trading tool and technical indicator, with a variety of complex signals. The tool can measure volatility, call out a trend or lack of one, provide dynamic support and resistance, or give buy or sell signals depending on the behavior of the bands.
To help clear up any remaining questions, we have prepared this list of commonly asked questions about the Bollinger Bands and related crypto trading tools.
Why are they called the Bollinger Bands?
The Bollinger Bands are an envelope of price action based on a 20-period simple moving average. The envelope creates an upper band and lower band set at 2 standard deviations of the SMA. The upper and lower band have an elastic-like effect when price reaches either level of dynamic support and resistance. The tool is named specifically after its creator, a famous trader named John Bollinger.
How to use Bollinger Bands in crypto trading?
There are many ways to use the Bollinger Bands for crypto trading. Traders can watch for the bands to squeeze and get ready to trade a breakout, or look for the Bollinger bounce and trade a range. The Bollinger Bands also help to call out M top and W bottoms very clearly with a set of specific rules to follow. The Bollinger Bands also tell a trader when price is high or low relative to historical price action, which can also be a sign that an asset is overbought or oversold.
Are Bollinger Bands any good?
The Bollinger Bands are among the most popular technical analysis tools today. The fact that it is widely used should tell you a lot about how reliable the indicator can be in certain situations. The Bollinger Bands provide a variety of signals, eliminating the need for traders to turn on dozens of indicators just to measure volatility, follow a trend, pick out turning points, and much more. Their versatility makes them one of the best tools around.
Which indicator works best with Bollinger Bands?
The indicators that work best with the Bollinger Bands are other Bollinger Band-based tools that were created by John Bollinger – the famous trader in which the tools are named after. These tools include the %B and Bollinger Band Width. However, the Bollinger Bands can also be used in conjunction with other technical indicators like the Relative Strength Index (RSI), Moving Average Convergence Divergence (MACD), Ichimoku, Parabolic SAR, Average Directional Index, and more.
What time frame is best for Bollinger Bands?
The Bollinger Bands work well across any timeframe, but according to the tool’s creator and experience with the tool, the tool is most effective across the highest timeframes. In the majority of examples throughout the guide, weekly or monthly timeframes were used. Higher time frames are typically more indicative of the primary trend and therefore provide the most reliable signals regarding reversals and major market turning points.
Are Bollinger Bands good for scalping?
The Bollinger Bands on lower time frames can be used effectively for scalping trading systems. Scalping involves getting into a trade and getting out of it practically just as fast, taking profit with steady returns versus big wins. Scalpers can use the Bollinger bounce signal on lower time frames when price is locked in a well-defined trading range.
What are the 3 Bollinger Bands?
The three Bollinger Bands that make up the technical indicator include the middle band, which is a simple moving average set at 20 periods. The upper band and lower band are then set at 2 standard deviations of the SMA. As prices fluctuate, the bands expand and tighten based on price volatility.
Where to use the Bollinger Bands?
The Bollinger Bands are available as part of the free technical analysis tools provided by Margex. In addition to the Bollinger Bands, Bollinger Band Width, and %B, there are plenty of other trading indicators to experiment with.
Are there any tips for trading Bollinger Bands?
The tool’s creator is always tweeting from his personal Twitter account discussing the tool’s signals and he often responds to questions from the community about how to use it properly. John Bollinger has many secrets up his sleeve and often will warn when it is time to pay attention. When he calls this out, it is important to watch the way the Bollinger Bands behave and react around price action.


