
Technical analysis for traders seems to be underrated for most new beginners due to its technicality and how it requires consistent practice and patience to acquire this knowledge. This skill can prove very important for traders, especially during a bearish run, as there seems to be little liquidity to trade, and it requires good technical background to make a profit consistently.
Trading during a bearish market is so difficult that you would be giving the market exit liquidity without proper knowledge of the market coupled with technical analysis. Knowing tools, strategies, chart patterns, indicators, oscillators, and price actions are ways traders ensure they have an edge and stay ahead of the market.
Most traders who trade the market consistently try to find the best profitable strategy for trading; this involves identifying trend shifts from bearish to bullish, combining candlesticks or candle patterns to stay profitable and manage risk accordingly.
This guide extensively discusses how traders can identify candle patterns, such as the bullish engulfing pattern, as one of the many technical analysis candlestick patterns for determining trend reversal. Engulfing patterns are used by traders to identify early trends or to find trend reversals in the financial markets. Engulfing patterns can be two types; the bullish engulfing candlestick pattern and the bearish engulfing candlestick pattern.
What Is A Candlestick
A candlestick is a price chart used in technical analysis by traders and technical analysts of the financial market to determine the high, low, open, and close prices in a particular timeframe. In times past Japanese rice merchants and traders used candlesticks to track and monitor prices. The candle is made up of the body and wicks. In most cases, the body tells traders and investors if the closing price is higher than the opening price. The candlesticks could be bearish candles (red/black) or bullish candles (green/white).
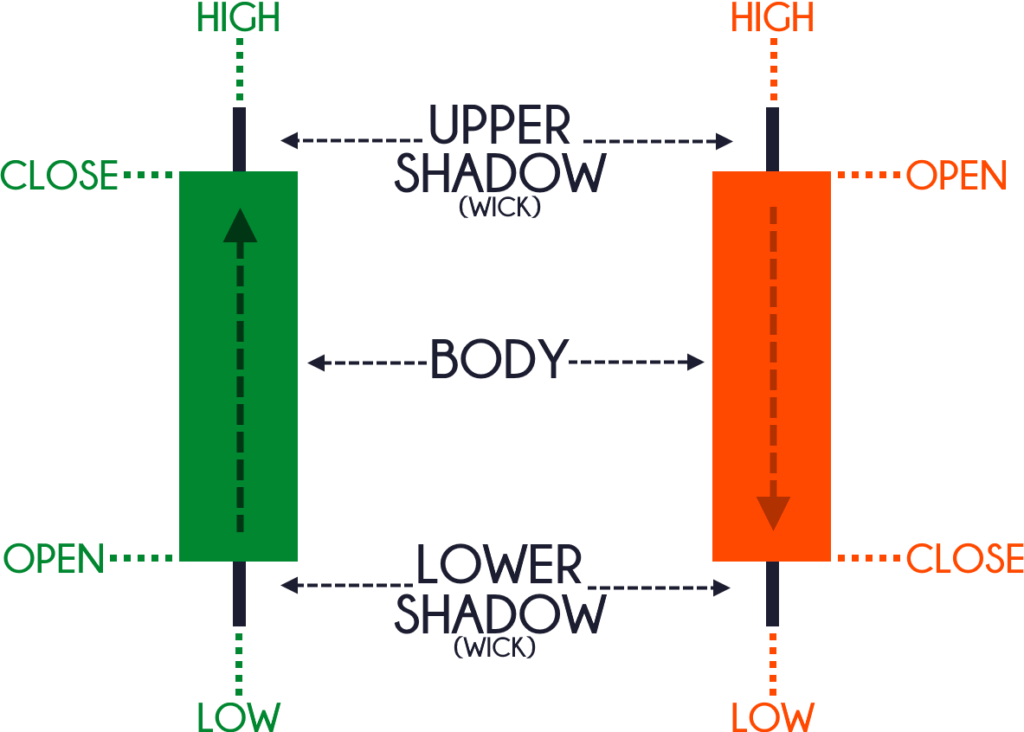
The bullish candlestick (green) is made up of body and wicks, also called shadows; prices open below and close above within a particular timeframe specified by the trader. For a bullish candlestick closing price is greater than the opening price.
The bearish candlestick (red) is made up of body and wicks, also called shadows; prices open above and close below within a particular timeframe. The opening price is greater than the closing price for a bearish candlestick.
What Is A Bullish Engulfing Candle Pattern?
A bullish engulfing candle pattern is formed by two candlestick patterns when a bullish white/green candlestick engulfs or overlaps a smaller bearish candlestick. This means the bullish candle closes above the bearish candle creating a price gap. The bullish engulfing pattern is made up of a bearish candle being the first, followed by a second candle being a bullish candle where the body engulfs the first candle without considering the wicks of the candlesticks.
For a bearish engulfing pattern, the bearish candle engulfs or overlaps the bullish candle. This is formed for a price reversal from bullish to a bearish trend where the small bullish candle is followed by bearish candlesticks that overlap the first candle creating price gaps.
Engulfing patterns are not just bullish and bearish candlesticks indicating where price ought to go; they represent traders’ sentiments in the market. Traders pay close attention to the formation of these candle patterns to decide if they will go long or short for a trade.
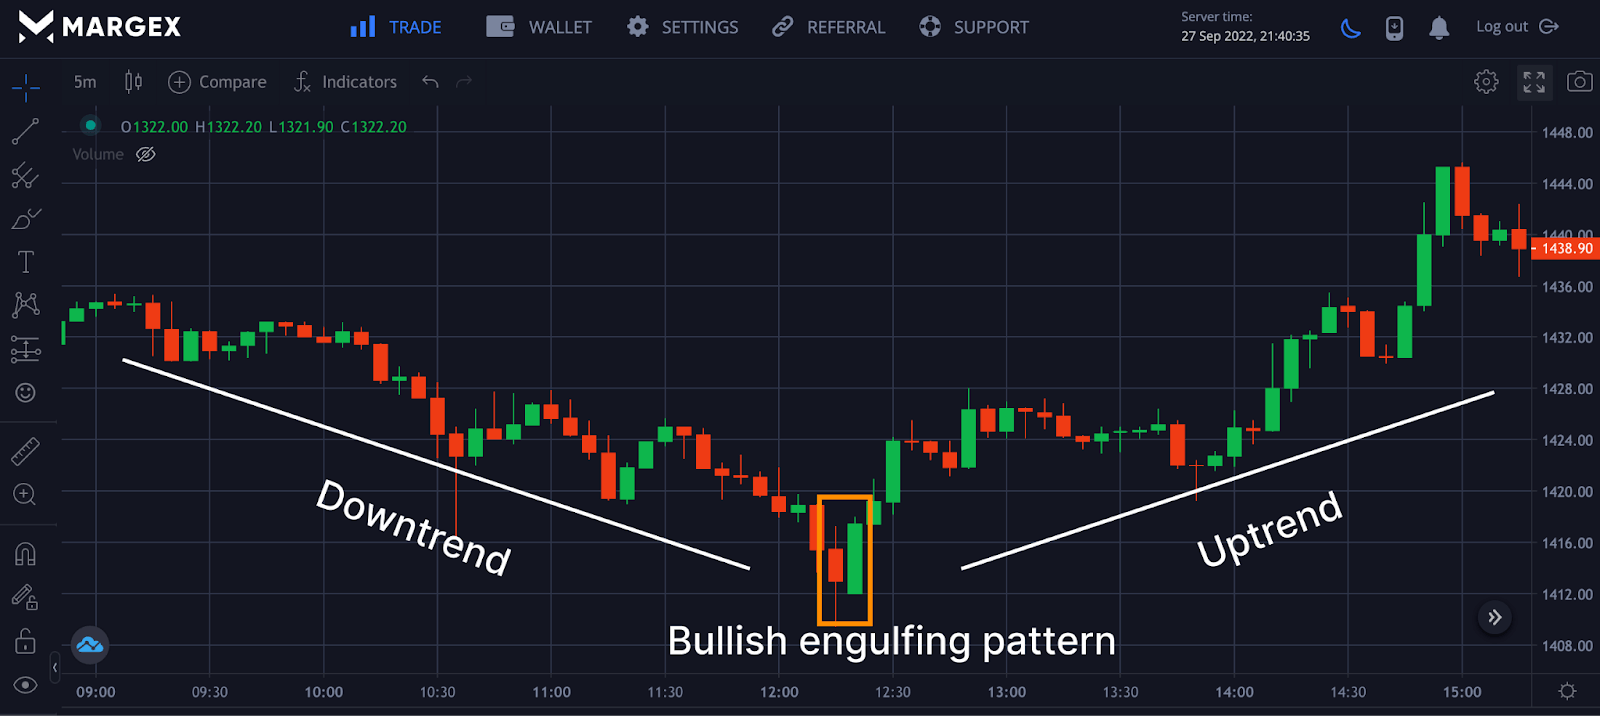
The chart above shows the BTCUSD pair; on the 30mins chart, the price maintained a downtrend followed by the formation of a bullish engulfing candle at a support area, signaling a trend reversal with the price rallying to the upside. The chart signifies the bears were in charge of prices as they pushed prices lower, but bulls overpowered them, pushing the price high with a trend reversal from bearish to bullish.
Characteristics Of The Candlestick Formation
The bullish engulfing pattern is formed by two candlesticks, a bearish candle followed by a bullish candle. Let’s have a clear description of how this formation is gotten.
- The first candle: the first candle is formed at the end of a downtrend representing the end of a bearish run with a red candle.
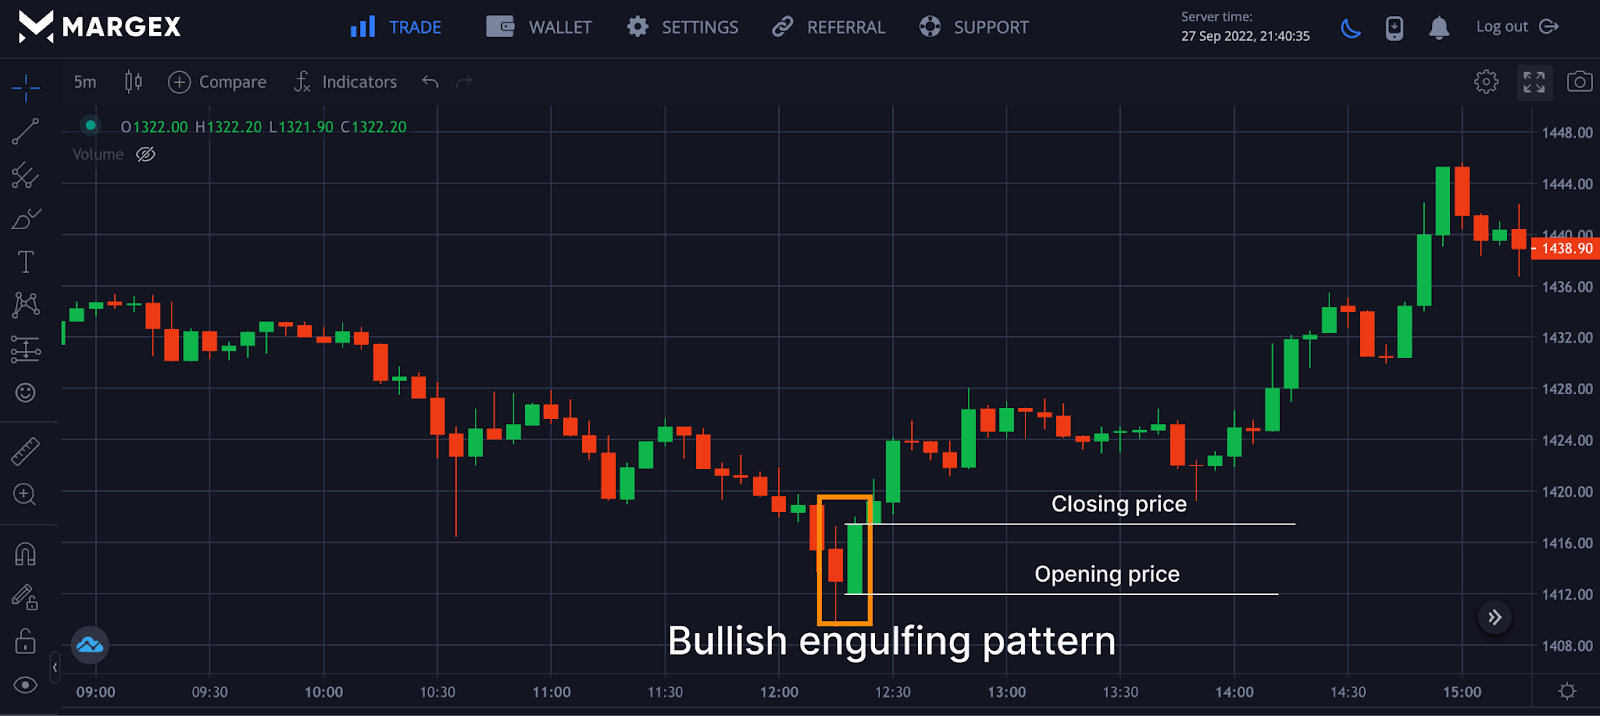
- The second candle: the second candle formed is a bullish candle that engulfs the bearish candle. The opening price of the bullish candle should be below the bearish candle’s close and close above the bearish candle’s opening price, completing the bullish engulfing pattern. The trick behind this pattern is that the bullish candle must engulf the bearish candle for a potential price reversal.
How To Use The Bullish Engulfing Pattern?
Most traders lose money or get caught up in a terrible position because of their decisions when proper trading strategies and price actions have not been considered. The bullish engulfing pattern appears after a downtrend. Traders are too quick to take a short position, thereby finding themselves at the opposite end of the trade when prices make a reversal from a downtrend to an uptrend. A bullish engulfing pattern gives a trader more conviction to open a long position as bulls are in control of the market.

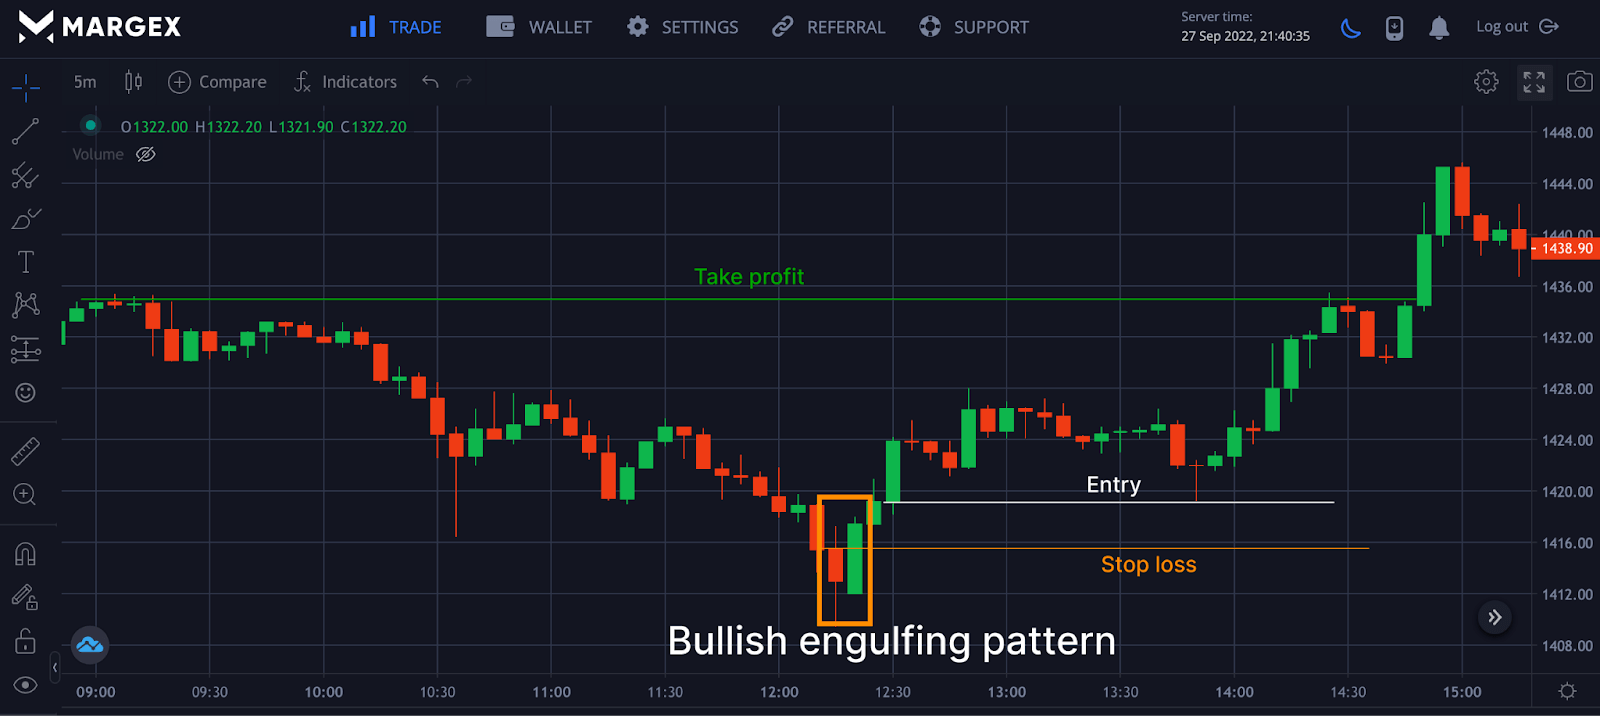
Most traders who spot this bullish engulfing pattern would enter a trade at the close of the bullish candle, while other traders would wait for more confirmation of the bullish trend. As prices reverse with a bullish structure, a trader could open a long position with stop loss and set a stake profit accordingly.
Example Of A Bullish Engulfing Pattern

To illustrate the bullish engulfing pattern strategy, we would look at the example of ETHUSD on the 5mins timeframe to understand how to trade engulfing patterns.
From the chart above, the price of the ETHUSD pair dropped from a region of $1,432 to a region of $1,408, with the price of ETH holding up strongly with what seems to be a support area for prices as more buy orders have been placed in this region. The sellers controlled prices as the price maintained a downtrend, but prices began to weaken as buyers started pushing the price higher. With the close of the bearish candle, a new candle opened with a price below the bearish candle as the buyers took full control of prices, pushing the price to close above the bearish candle signaling a change in trend could be initiated with the bullish engulfing pattern formed.
Following the formation of the second candle overlapping the first bearish candle indicating the formation of a bullish engulfing candle, the price rallied to a high of $1,444, forming swing highs after a valid bullish engulfing pattern.
Limitations Of Using Bullish Engulfing Pattern
Like other technical analysis strategies, the bullish engulfing pattern has its limitations when it comes to application in the financial market. Traders must avoid seeing a bullish engulfing pattern as a tool that gives 100% return and can not be faultless or produce false signals during trend reversal.
During macroeconomic events, fear of uncertainty, regulatory event, and news can negatively affect the bullish engulfing pattern due to high volatility and price actions that come with the market. It would be unwise to trade this strategy in isolation.
Despite a trader seeing a bullish engulfing pattern formed during this time, it can be short-lived. Still, a bullish engulfing pattern has higher chances of maintaining an uptrend if crypto assets have a hard, longer downtrend.
A trader shouldn’t depend solely on the strategy as the crypto market is very unpredictable with price movement. Knowing this fact would help a trader employ risk management tools such as stopping loss and taking a profit. The most decision you make as a trader is based on your risk tolerance, experience in the market, portfolio size, and goals. Always remember never to put the money you can never afford to lose.
How To Trade Crypto With A Bullish Engulfing Pattern On Margex?
Margex is a Bitcoin-based derivatives exchange that allows traders to trade crypto assets with up to 100x leverage size while also staking the same tradable assets to earn extra income. Margex unique staking feature is the first and one of a kind in the crypto space, helping even new traders who are learning to trade to stake those assets and earn up to 13% APY.
Staking does not have lockup periods, and staking rewards are withdrawn to staking balances daily with the help of the Margex automated system. Margex has been built to be the best exchange regarding user experience and security regarding the staking and transactions carried out on the Margex platform.
All you need to do is open a Margex account, and if you are an existing user, you can log in to access all of Margex’s features, including free trading tools.
Margex’s unique user interface allows even inexperienced traders to trade easily and use the technical analysis tools available to identify great bullish reversal trends, such as the bullish harami candle pattern.
Clicking on the trade section of the Margex platform, you can access all tools and charts needed to trade based on your timeframe.
The chart above shows the ETHUSD pair after a correction in price to a region of $1,408; the price of ETH bounced off as buyers reclaimed prices with the new candle opening below the previous candle close and the bullish candle closing above the previous open.
After clearly confirming a bullish engulfing pattern and successful breakout, a trader can open a long position as the price rallied to a high of $1,444.
Advantages Of Trading The Engulfing Pattern
Most traders use the bullish engulfing pattern because it is easy to spot after a downtrend. The bullish engulfing pattern is made up of a two-candlestick pattern, with the first candle looking bearish with a small body. In contrast, the second candle is bullish with a bigger body overlapping the first candlestick making it easier for most traders to spot.
When the bullish engulfing pattern is confirmed to have been formed and completed, it produces an attractive risk-to-reward margin while implementing stop-loss to ensure capital is preserved.
Bullish Engulfing Pattern Vs Bearish Engulfing Pattern
As discussed, a bullish engulfing pattern is formed in a downtrend. When the second candle is bullish engulfs, the first candle is bearish.
In the case of a bearish engulfing pattern, this is formed in an uptrend, with the second candle looking bearish as it envelops the small bullish candle.
Engulfing pattern signals a potential trend reversal, either a bullish trend or a bearish trend. Trading the engulfing pattern with other indicators, price actions, and market structure will improve and provide better profitability.
Frequently Asked Questions (FAQ) On Bullish Engulfing Pattern
Trading patterns can sometimes be challenging, so most traders ask questions that can help them understand this chart pattern better. Here is an example of frequently asked questions.
How To Find A Bullish Engulfing Pattern?
To find a bullish engulfing pattern, you need to look for a small bearish candle formed in a bearish downtrend followed by a long bullish candle that envelops the small bearish candle.
What Are Some Examples Of The Bullish Engulfing Pattern?
The price of ETHUSD saw a decline, but the price was held by support as a bullish engulfing pattern was formed, with the price rallying to the upside following the bullish engulfing pattern confirmation.
How To Trade Bullish Engulfing Patterns?
The bullish engulfing pattern encourages traders to open a long position. This pattern is formed when there has been a downtrend formation. The bullish engulfing pattern comprises two candlesticks, a bearish and a bullish candle, where the bullish candle engulfs the bearish candle.
How Reliable Is Bullish Engulfing?
The bullish engulfing pattern is reliable but could be exposed in a more volatile market with huge price action due to news media. It would be best to pair a bullish engulfing pattern with other trading indicators and oscillators for better profitability.
Is Engulfing Candle Bullish Or Bearish?
Engulfing candle can be bullish or bearish depending on where it was formed. A bullish engulfing candle is formed at the end of a downtrend, with the pattern making up two candlesticks.
How Accurate Are Engulfing Candlestick?
Engulfing candlestick patterns is reliable for many traders when appropriately applied. It has a success rate of 70%. With good confirmation and trading this strategy with other trading tools, a trader increases his chances of making better gains with proper risk management.
Which Time Frame Is Best For Engulfing Candle?
Traders have different preferences, so there are different timeframes to trade with based on what works best for you. The bullish engulfing pattern works for all timeframes. It would be best if you stick to the timeframe that works for you and apply your strategies accordingly based on the timeframe.


