
The cryptocurrency markets have developed exponentially to become a wealth transfer channel and a platform for traders to leverage trading skills and technical indicators to become profitable.
To fully leverage the life-changing trading opportunities presented in the cryptocurrency markets, traders must subject themselves to rigorous learning and understanding of technical analysis and the various applications of multiple trading tools and indicators.
Choosing a particular trading indicator and strategy from the vast number of indicators and tools may be challenging and daunting for some traders.
However, a broad understanding of multiple technical indicators and forms of analysis can be rewarding and help traders narrow down to fewer indicators and trade strategies best suited to their personality.
In this article, we will gain a full understanding and insights into the Coppock curve indicator, how it works, what it tells traders and the pros and cons of its application to trading in the financial and cryptocurrency markets.
What Is The Coppock Curve Indicator And How Does It Work?
The Coppock Curve indicator is a long-term cryptocurrency trading indicator based on arithmetic moving averages and trader psychology in the crypto markets.
The Coppock Curve indicator is utilized mostly by traders on the one-week (1W) and one-month (1M) chart timeframes to measure long-term cryptocurrency movements and direction.
However, depending on traders’ preferences, it can also be used on shorter timeframes, such as the 1D and 4H chart timeframes.
The Coppock Curve indicator uses mathematical measurements and calculations based on a 14-month low demand and bearish period, thereby predicting the approximate length and duration of a downtrend in the cryptocurrency markets.
This indicator aims to provide traders with near to accurate buy/sell signals of any cryptocurrency analyzed using its standards of measurements and calculations when it most likely has bottomed or topped.
The Coppock curve indicator is a less popular indicator when compared to other indicators utilized by many trades. Still, it can be as effective in validating buys and long position entries based on a cryptocurrency price history and previous chart pattern formations.
Example Of Coppock Curve Indicator
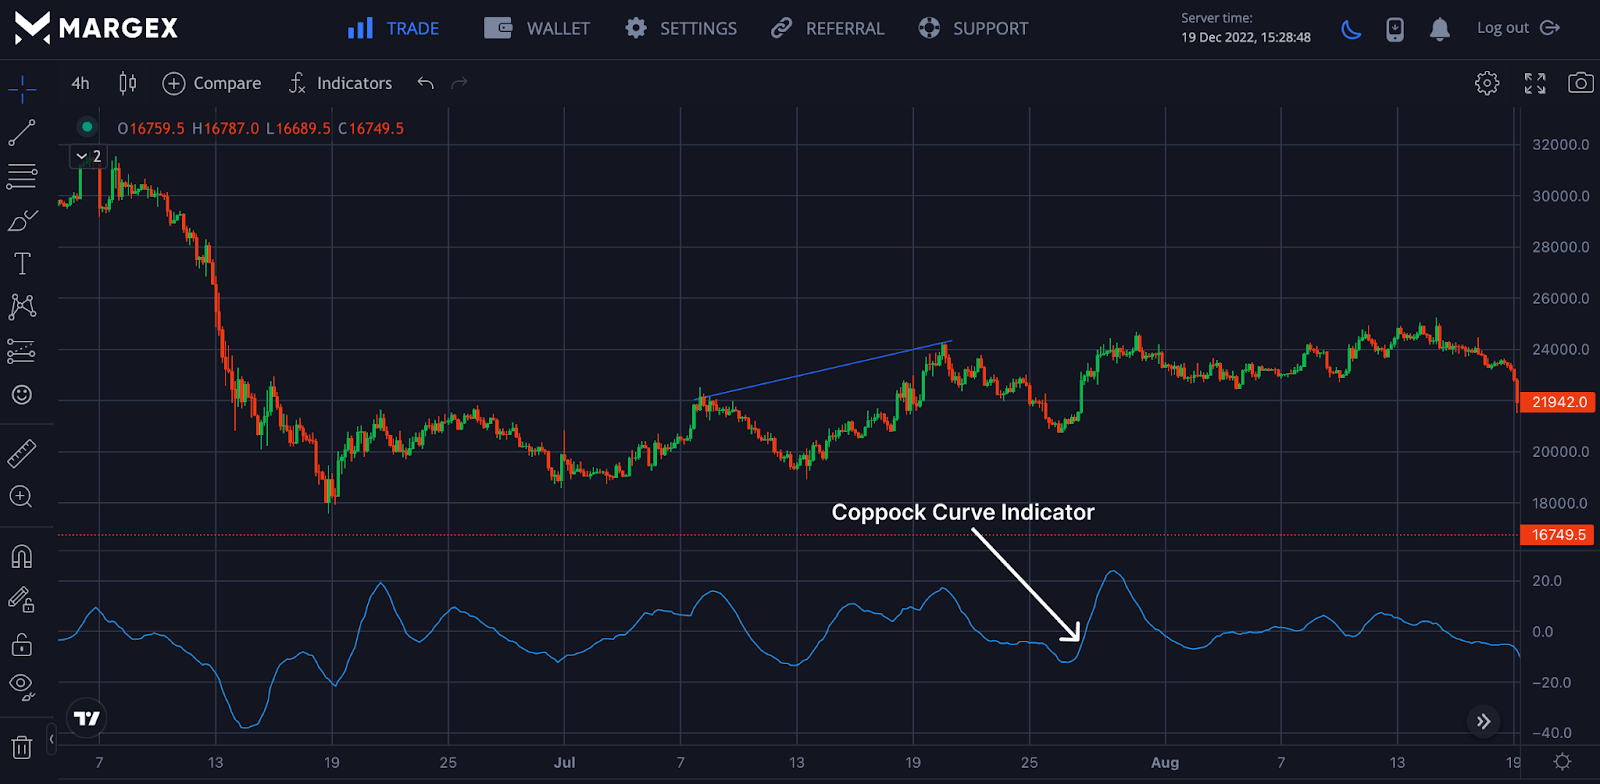
The image above shows an example of the Coppock curve indicator that shows long-term price momentum as it is used to identify uptrends and downtrends in a crypto market.
What Does The Coppock Curve Indicator Tell Traders?
The Coppock curve indicator is one of the various trade indicators utilized by traders and analysts in the financial and cryptocurrency markets.
It was created to give meaningful trade data and insights, which traders translate into trade signals that can be profitably applied to real-time trading of cryptocurrency pairs in the financial markets and trading platforms.
The Coppock curve indicator is a momentum oscillator where the momentum is measured by Rate of Change (ROC) and weighted moving averages.
The Coppock curve Indicator was designed to oscillate above and below zero when applied and used as an indicator for a particular cryptocurrency on a price chart.
When the Coppock curve displays a value greater than 0, this signifies potential buy entries and long position opportunities for traders trading cryptocurrency pairs using the Coppock curve indicator.
On the reverse, when the Coppock curve oscillates and falls below zero, it signifies a potential sell position opportunity and an indication of a downtrend and bearish reversal.
The Coppock curve indicator can be likened to the RSI indicator in functionality as it aims to provide traders with near to accurate buy and sell trade opportunities and recommendations.
How To Calculate The Coppock Curve Indicator?
Traders and market analysts who are new to the use and application of the Coppock curve indicator may find it technical and complex to calculate its usage successfully.
Calculating using the Coppock curve formula can only be straightforward if traders pay attention to learning how it works and is calculated. The Coppock Curve indicator is calculated as seen below;
Coppock Curve = WMA10 x (ROC14 + ROC11)
Where:
WMA10 = 10-period weighted moving average
ROC14 = 14-period rate of change
ROC11 = 11-period rate of change
Using this formula above, a trader can proceed to the following steps;
- Use the most recent monthly closing price in relation to 14 periods (months) ago to calculate ROC14.
- Use the most recent monthly closing price in relation to 11 periods (months) ago to calculate ROC11.
- Add up ROC14 to ROC11. Do this continuously for each period going forward.
- Take a weighted moving average of the most recent 10 values once ROC14 has been added to ROC11 for at least 10 further periods.
Do this each subsequent period going forward.
Pros And Cons Of Coppock Curve Indicator
As with every trading indicator available on price charts of globally recognized trading platforms such as Margex, the Coppock Curve has inherent pros and advantages to its application in trading and limitations and cons to its indicator application.
Here are some pros and cons every trader choosing to leverage the Coppock curve indicator should be aware of
Pros
- The Coppock curve indicator is well-suited for traders looking for buy/sell signal opportunities through the monthly chart.
- The Coppock curve indicator offers simple and direct signals from which traders can easily build a mechanical strategy.
- The Coppock curve indicator allows traders to identify and catch big trends.
Cons
- False signals occurring at intervals are one of the Coppock curve indicator’s biggest flaws. Traders leveraging the Coppock curve indicator might be victims of false entry signals, which might occur when the market is in a range, causing the indicator to go above and below the zero line concurrently.
- The Coppock curve indicator is based on moving averages and covers long periods in its calculations, which results in it lagging significantly.
- The Arbitrary settings of the Coppock curve indicator that allow traders to choose any setting that suits their preferences can result in curve fitting, where traders adjust settings to fit historical price data. This could lead to the indicator becoming ineffective when used to analyze real-time trades and price movement.
How To Use The Coppock Curve Indicator In Trading? (Step-By-Step Guide With Screenshots From Margex)
Margex is a crypto derivative platform that allows traders and investors to trade and simultaneously stake their tradeable assets with the help of Margex’s unique staking features.
With the help of Margex, traders and investors are protected with the help of Margex’s MP shield protection from price manipulation of assets and pumps and dump present in most trading platforms.
Step 1: Create A Margex Account

Creating a Margex account allows new and old users to easily access all of the trading features on the Margex platform.
Step 2: Deposit To Trade
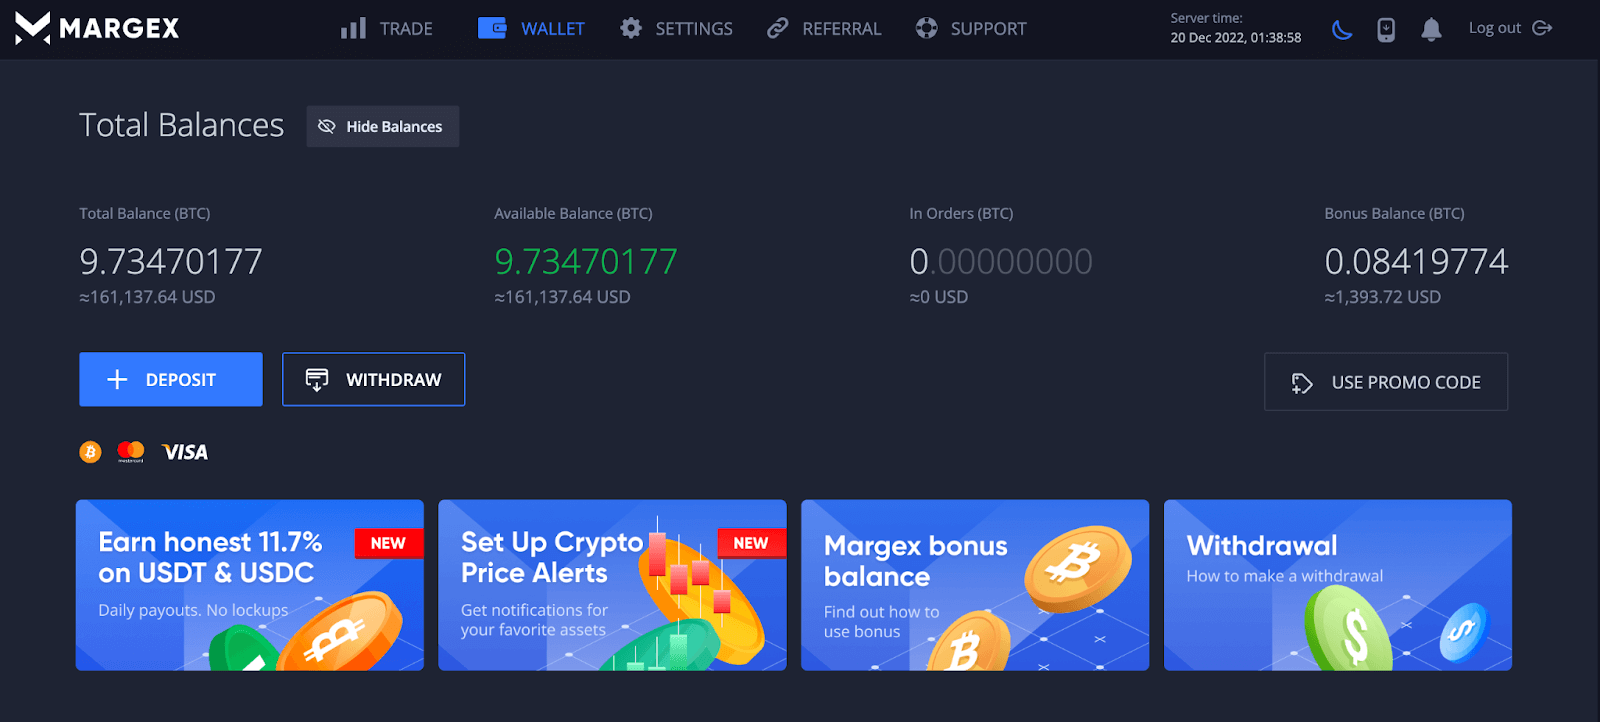
Depositing into your Margex account allows a trader to practice and implement all strategies learned and gives opportunities to use the Margex trading tools to the fullest.
Step 3: Trade The Coppock Curve Indicator
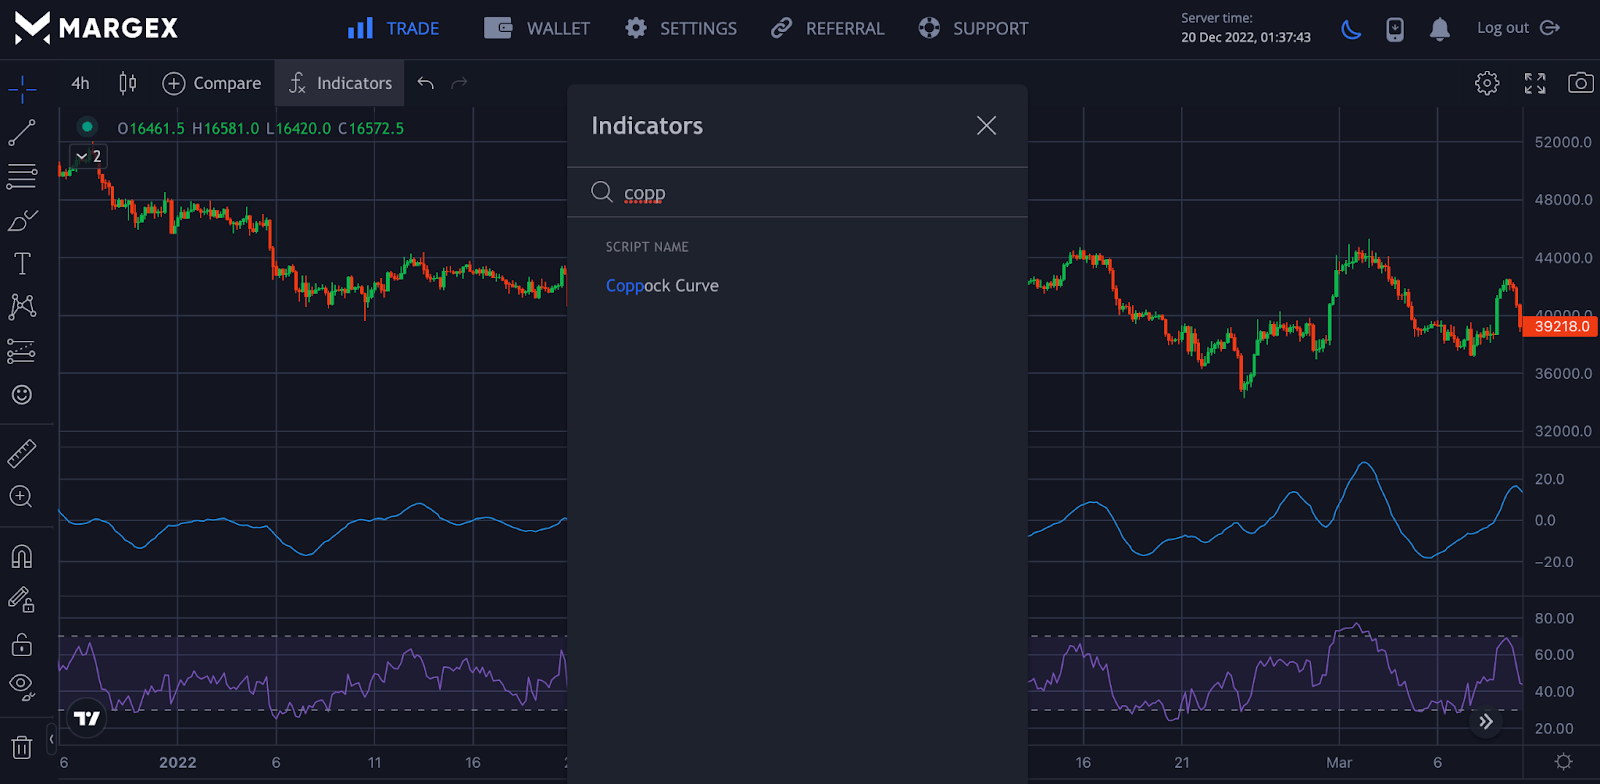
Click on trade in the trade section with the trade button labeled trade to access all Margex trading tools.
Click on the indicator icon to access all indicators and search for the preferred indicator to be used; in this case, we are using the Coppock Curve Indicator; apply this to the trade.
Best Trading Strategies With Coppock Curve Indicator
There are different strategies to be employed in trading the Coppock Curve Indicator; we will explore a few of them.
Coppock Curve Strategy
The movement of the Coppock Curve below and above the zero line indicates crypto assets want to make a bullish or bearish run, similar to other indicators like the Relative Strength Index (RSI).
Buying crypto assets above the 20 to 40+ region is usually not ideal as the asset has been trending for some time now and could face an imminent reversal. In contrast, a -40 means an asset has been in a downward price movement and could potentially reverse to an upside.
Waiting for the Coppock Curve to return to 0 or below, this rage is a range many traders use for either buy or sell potential. It is best always to combine these indicators for better confluence.
Coppock Curve With RSI
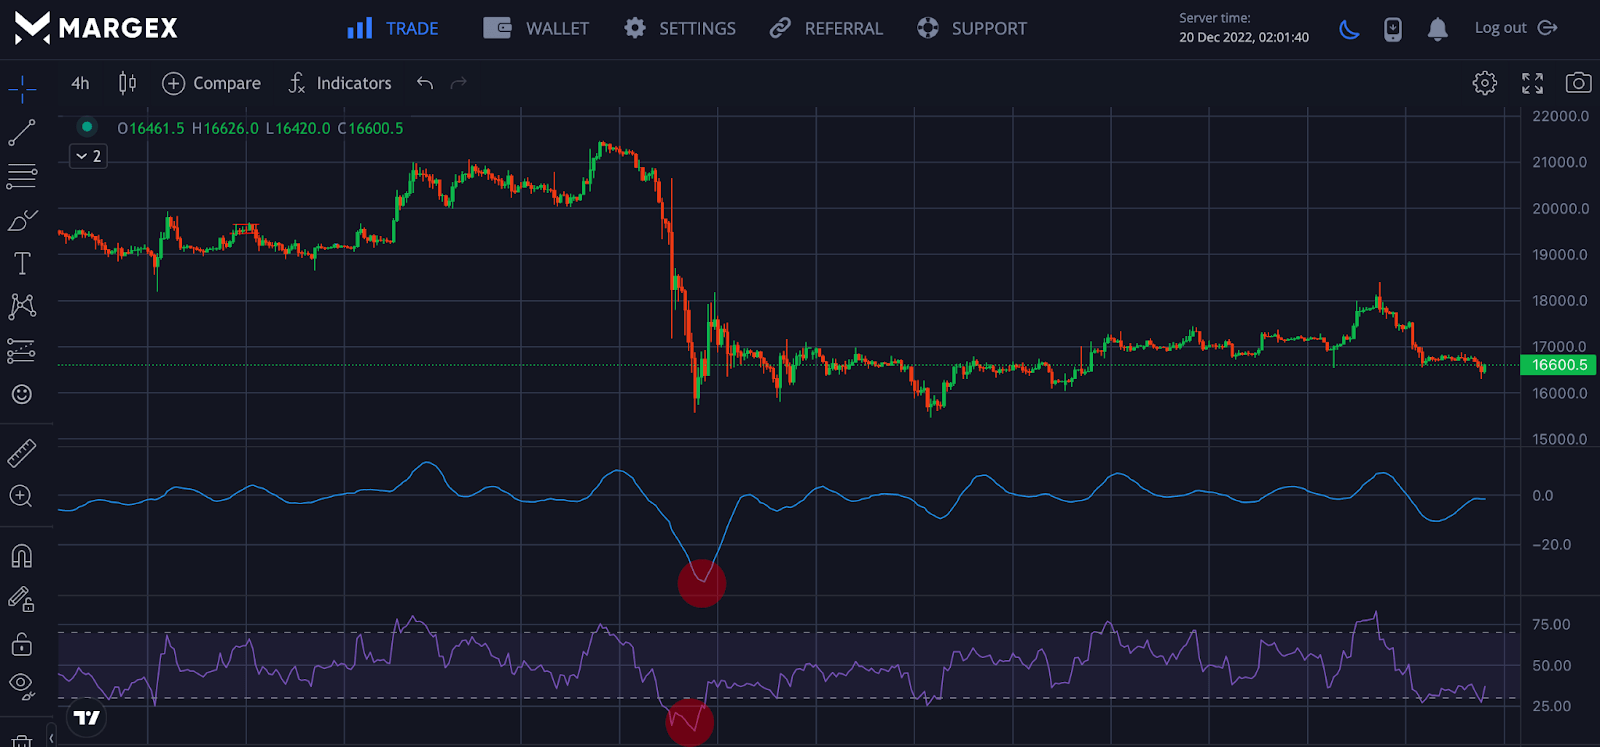
The Coppock Curve can be combined with RSI for better confirmation, showing oversold and overbought activities for traders trading a particular crypto asset.
Frequently Asked Questions On Coppock Curve Indicator
Is Coppock Curve A Leading Indicator?
The Coppock curve indicator is among the numerous technical indicators utilized and leveraged by traders and analysts in trading cryptocurrencies.
Although some traders utilize the Coppock curve indicator, it does not come close to the leading technical indicators overly utilized and leveraged in trading the cryptocurrency markets.
The Coppock curve indicator may give valuable trading data and signals if traders adequately utilize and calculate its usage and applications.
Cryptocurrency traders are advised to do due diligence and research on technical indicators such as the Coppock curve before deciding on it as a preferred indicator option.
How Do You Use Coppock Curve Indicators?
Traders’ usage and applications of the Coppock curve indicator can be pretty straightforward and seamless.
Firstly, traders should consider how the Coppock curve indicator is calculated using its formula.
Secondly, the Coppock curve is a momentum oscillator that gives potential signals on buy/sell entries when the curve moves above or below the zero line.
Traders are advised to conduct personal research into other technical indicators and forms of technical analysis that can be used alongside the Coppock curve indicator to validate its trade signals, as using it alone may result in bad trades when the signals are false.
How Do You Trade A Coppock Curve?
Integrating and applying the Coppock curve indicator to trading can be rewarding and profitable if used effectively and with multiple trading indicators for validations.
Traders can effectively trade using the Coppock curve indicator by paying attention to its curve movements on a price chart.
When the Coppock Curve moves above the zero line, a trade signal is triggered, which may signify bullish price action and opportunities for long position entries.
On the reverse, when the Coppock curve moves below the zero line, it signifies bearish and downward movements, which may be an opportunity for traders to enter sell positions of a cryptocurrency asset.


