Harmonic trading is a precise and quantitative trading method, but learning the patterns takes time, experience, and extensive study. The fundamental metrics are just the start. A pattern is invalidated by movements that do not correspond to the correct pattern measurements, which might confuse traders.
Technical analysis techniques like harmonic trading are often utilized in the forex, futures, and stock markets. Specific price patterns used in harmonic trading depend on the alignment of specific Fibonacci extension and retracement levels.
Harmonic trading pinpoints probable reversal zones in the investment under consideration based on the pattern’s structure and the Fibonacci ratios.
Contrarian reversal patterns, known as harmonic patterns, might indicate a shift in the price direction. This may be a brief correction or possibly a change in the trend. Trading harmonic patterns do not use technical indicators other than the Fibonacci extension and retracement tool.
The most well-known of Scott Carney’s books on harmonic trading patterns is “The Harmonic Trader.” This book, released in 1998, taught readers how to trade the convergence of specific price patterns and Fibonacci ratios. Any serious harmonic trader should read the book since it describes their extensive work in this field.
A harmonic pattern scanner, a program that can recognize numerous chart patterns based on the principles of harmonic trading, has been created by Carney and is available on his website Harmonictrader.com.
Numerous similar tools, scanners, and indicators have emerged as a result of the success of harmonic trading to help traders find harmonic pattern setups.
Several of the most typical harmonic patterns are as follows:
- The Gartley pattern
- The Bat pattern
- The Crab pattern
- The butterfly pattern
- The Shark pattern
Other minor variants exist in addition to the designs already discussed, such as the Deep Crab pattern, which we shall discuss in this article.
Although Scott Carney is often credited with creating the different harmonic patterns, H.M. Gartley is credited with introducing the Gartley pattern in his 1935 book “Profits in the Stock Market.” Because it was initially stated on page 222 of H.M. Garley’s book, the Gartley Pattern is sometimes referred to as Gartley 222. In his book, however, he did not go into great detail about the pattern, leaving many unresolved issues.
More crucially, H.M. Gartley’s early works lacked Fibonacci ratios. This trading strategy became a popular branch of pattern-based technical analysis when Carney introduced particular Fib ratios applied to harmonic patterns.
It is possible to compare harmonic trading and other technical analysis ideas, including trading the Elliott Wave. There is no usage of common technical indicators like stochastic oscillators or moving averages. Instead, the whole basis of market analysis is based on the structure of a pattern, which is confirmed by determining the duration of the price movements, particular to the ratios described.
One must have a good grasp of the components of harmonic patterns and the particular Fibonacci ratios that confirm these patterns to trade harmonic patterns successfully, and more specifically, the Crab and the Deep Crab pattern, the subject of this essay.
Occasionally, even a slight variation in the degree of retracement or extension may render a pattern invalid or even change it from one pattern to another.
This article will examine the functionalities of the crab pattern Read on to find out!
Recognizing The Crab Pattern
It is a four-wave and five-point (XABCD) harmonic chart pattern with a lengthy CD wave in the center. The long CD leg is a sharp move that chases retail traders’ stop losses before reversing to the primary trend.
Remember: A sudden move in the market following a period of sideways or consolidation is usually a trap. Large dealers or banks may move the market. They don’t want you to make money. They utilize a stop-loss hunting approach in conjunction with a sharp move in the market to remove retail traders. As a result, they may steer the market back in the right direction. The CD leg provides a stop-loss hunting signal.
Let us now describe the guidelines for identifying the crab pattern in the market. The Fibonacci ratios utilized in the crab design are included in the rules.
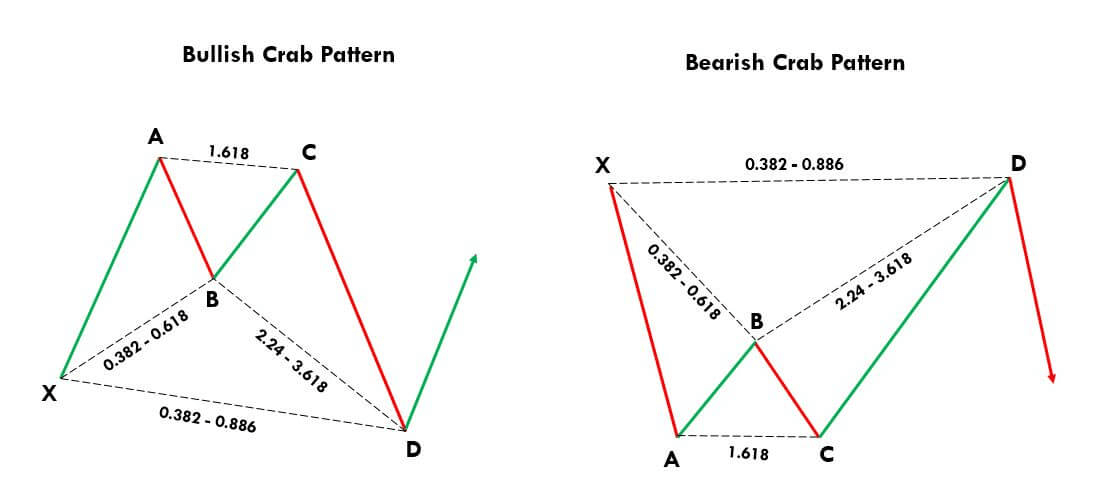
Bullish crab pattern
- It begins at point X and extends to point A. Point X may be anywhere on the price chart, but looking for a bull pattern under oversold circumstances is a smart practice.
- Wave AB must retrace downward to the XA wave’s Fibonacci levels of 0.382 – 0.618.
- Wave BC must retrace the AB wave’s 0.382 – 0.886 Fibonacci levels.
- The final wave CD is the longest and must reach the BC wave’s 2.24 – 3.61 Fibonacci levels.
Bearish crab pattern
- It begins at location X and finishes at point A. In overbought circumstances, this pattern should appear.
- Wave AB must retrace higher to the XA wave’s Fibonacci levels of 0.382 – 0.618.
- Wave BC must retrace the AB wave’s 0.382 – 0.886 Fibonacci levels.
- The final wave CD must reach the BC wave’s 2.24 – 3.618 Fibonacci levels.
The Deep Crab Harmonic Pattern
It is a crab pattern modification based on deep wave retracement. The retracements in this pattern are always deep to the 0.886 Fibonacci level. The extension levels will stay unchanged.
Bullish pattern
In technical analysis, use the following criteria to detect a bullish deep crab pattern on the chart.
- The first wave of the deep crab pattern is XA, which must be a bullish wave.
- AB must retrace to the 0.886 Fibonacci level of the XA wave, which signals a significant retracement.
- The BC wave must also return to the 0.886 Fibonacci level of the AB wave.
- The CD wave should reach the 1.618 Fibonacci extension level of the XA wave.
Bearish pattern
Except for the retracement of AB and BC waves, all of the elements in the bearish deep crab pattern will be the same as in the bearish crab pattern. In the case of deep crab, the retracement must be to the 0.886 Fibonacci level.
The Deep Crab Harmonic Pattern And Deep Crab Patterns: Differences
Traders are alerted to the Crab pattern’s exceptional quality by adding the term “Deep” to the pattern’s name.
The degree to which waves can retrace their paths is the primary distinction between the two structures. A Deep Crab pattern is formed when the price makes a significant retracement, maybe to the 0.886 Fibonacci level. Conversely, a Crab pattern will create if the retracement is not very deep, for example, just reaching the 0.618 or 0.382 Fibonacci levels.
This is the sole significant distinction between these patterns.
How To Trade The Crab Pattern
We’ll now look at how to trade the Crab pattern, using a bullish Crab as an example.
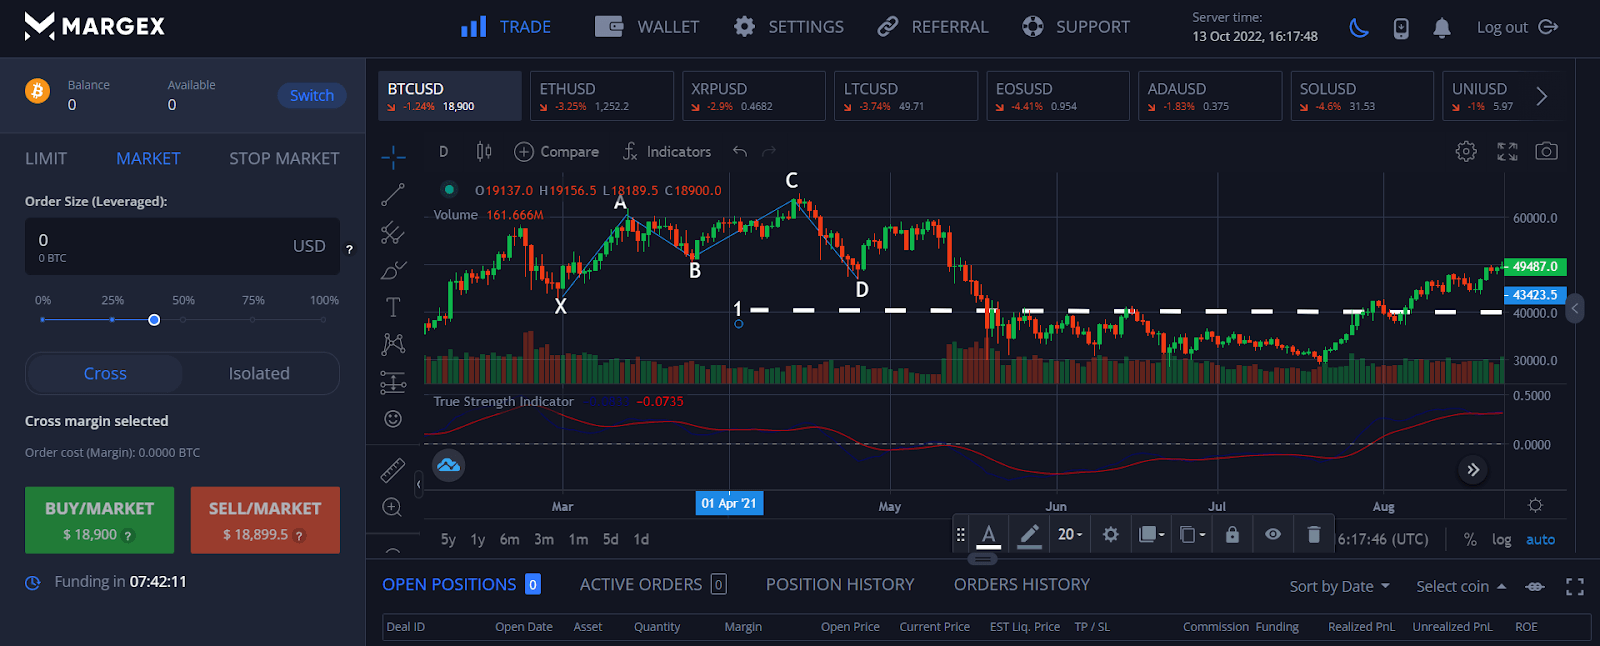
Entry
Determine where the pattern will end at point D, which will be the 161.8% extension of the X-A leg. Put in a purchase order here.
As an example, consider the chart below:

1- Long entry
Stop loss
Set your stop loss immediately below point D, as shown below:
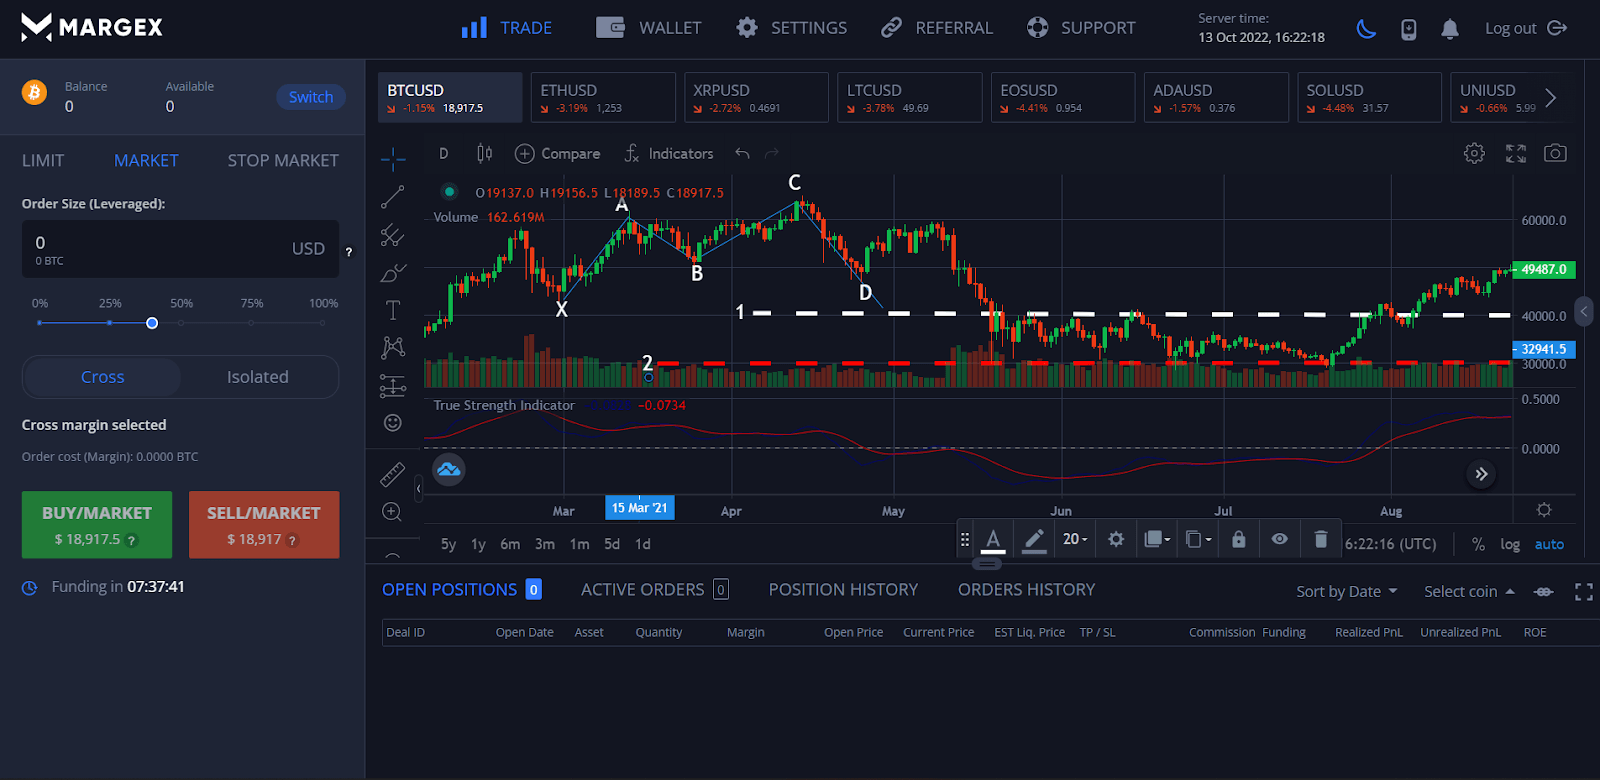
1 – Long entry
2 – Stop loss
Profit target
This pattern, where you position your profit goal is highly subjective and relies on your trading objectives and market circumstances.
If you wish to set an ambitious profit objective, position it at point A in the pattern. Place it at point B for a more cautious profit objective.
As an example, consider the chart below:
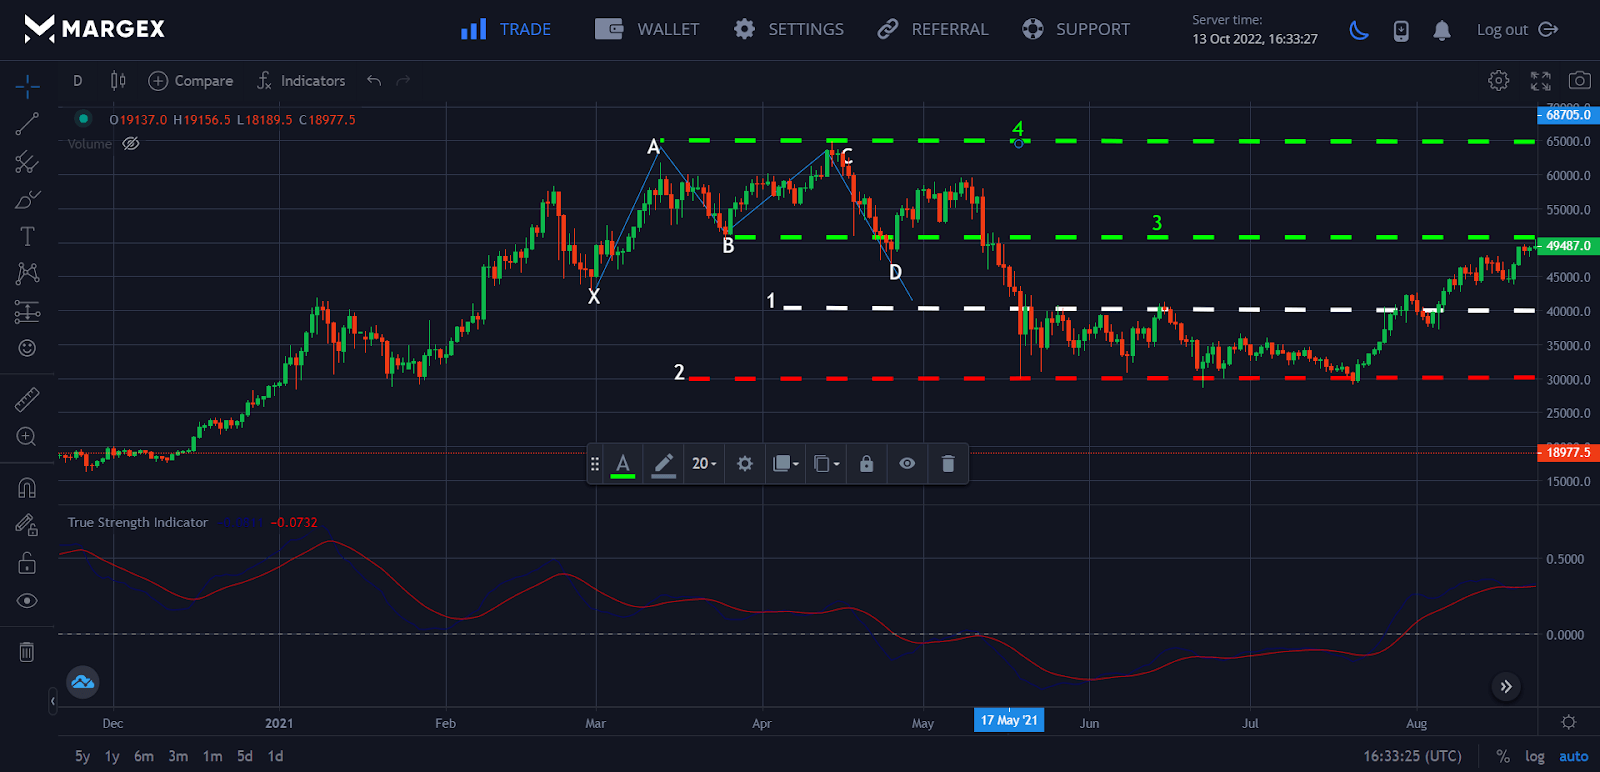
1 – Long entry
2 – Stop loss
3 – Conservative take profit
4 – Aggressive take profit
Best Strategies For The Crab Pattern Trading
Because it is a reversal pattern, the formation of a bearish crab pattern indicates a likely negative price movement. While there is no precise way to trade this pattern, here are some pointers that traders who use the crab pattern approach have found useful.
While there is no fixed strategy for trading the bullish crab pattern, it is generally known that a reversal pattern indicates a market countertrend move. This pattern typically shows an uptrend; hence it is utilized to determine a purchase order.
The Crab pattern needs patience on the side of the trader since it might take some time to emerge appropriately. Traders may search for the Crab pattern on any period that best suits their trading requirements.
Crab pattern buy strategy
- In an upswing, look for the pattern.
- Before entering, wait for the price bar to become bullish.
- Enter the deal at or after point D.
- Set a stop-loss order around the most recent low.
- Exit the position before the price falls.

Crab pattern sell strategy
- In decline, look for the pattern.
- Before entering, wait for the price bar to become bearish.
- Enter the deal at or after point D.
- Set a stop-loss order around the most recent high.
- Stop trading before the price increases.
TL/DR
Crab patterns occur less often in the market than other harmonic patterns. When it does, however, it often produces trades with a high risk-to-reward ratio. If you are new to this pattern, you will need some expertise and talent to spot and trade it on the price chart. Once you’ve mastered this pattern, more trade chances will present themselves, potentially massively growing your trading account. Finally, trade the bearish crab only in an upswing and the bullish crab only in a downtrend. Only then will the chances of your transaction succeeding rise.
FAQs
How do you trade crab patterns?
Trading the crab chart pattern is relatively simple once you have recognized it. The standard procedure is to start a position at point D and a stop loss order at point X.
However, as usual, we advise verifying the reversal using other technical analysis indicators and being aware of the precise locations of your stop loss and taking profit orders.
To validate the reversal, we will demonstrate how to trade the crab pattern using technical indicators in this part. The principles are the same for the bearish crab pattern, which is the opposite of the bullish crab pattern we use for this example.
What is a deep crab pattern?
Deep Crab came from invalid Bat patterns and a particular sort of Crab pattern that I created as a development of the fundamental structure. The Deep Crab pattern is identical to the classic Crab pattern in that it is a 5-point extension structure that uses a 1.618 XA projection solely for the defining level in the Potential Reversal Zone (PRZ). The difference may be established at the B point, which must be a retracement of 0.886.
What is bullish crab?
A bullish Crab pattern forms a possible bullish reversal setup at the D point, referred to as the potential reversal zone (PRZ). An upward XA wave, a descending AB wave, an upward BC wave, and a downward CD wave make up the pattern. It is often seen during an upswing.
What is bearish crab?
A bearish Crab pattern comprises four waves: a downward XA wave, an upward AB wave, a downward BC wave, and an upward CD wave. After a multi-legged upward retreat, the pattern provides a probable bearish reversal scenario at the D point (PRZ).