
Investors and traders of any market search for certain chart patterns, candlestick formations, or other signals that can help to predict future outcomes. When it comes to trading or investing in cryptocurrencies, some patterns are more reliable than others.
Few patterns are considered as reliable or as prominent as the cup and handle pattern in crypto. Although the pattern and its shape is easy to spot, trading it is no cup of tea. The common chart pattern can also appear upside down, forming an inverse cup and handle pattern.
This guide will teach you how to identify the cup and handle pattern, as well as the inverted cup and handle pattern, and how to trade them.
The Cup And Handle Chart Pattern Explained
In technical analysis, a cup and handle is a chart pattern which takes the shape – much as the description sounds like it would imply – of a cup with a handle. The pattern was first defined by author and analyst William J. O’Neil in his 1988 book How to Make Money in Stocks.
According to studies, the pattern duration ranges from seven weeks to more than a year to complete the formation. Therefore, these are commonly high time frame chart patterns. However, they can also appear with reliable results on the daily chart time frame or lower time frames.
Types Of Cup And Handle Patterns
There are two types of cup and handle patterns, each resembling a teacup, with a handle where the trend line of the handle tilts away from the primary trend direction.
The standard pattern is considered a bullish continuation pattern, while the inverse pattern is a bearish continuation pattern. The cup and handle pattern rarely forms as a reversal pattern.
Cup And Handle Pattern
The standard bullish cup and handle pattern forms first with a correction during an uptrend. A rounded bottom or U-shaped support forms as prices are unable to make new lows. With the rounded base established, the market begins to curve up to where the correction first began.
When price meets a resistance level, there is a short consolidation period and another minor correction. When price returns to this resistance trend line once again, bullish momentum helps push prices through, validating the pattern.
Typically, the handle of the pattern has a slight downward tilt, slant, or drift, similar to how a bull flag will trend downward after the flagpole is established. The handle will form between the upper half of the cup and upper third of the cup pattern.
Inverted Cup And Handle Pattern
The inverted bearish version of the cup and handle pattern forms first with a rally during a downtrend. A rounded top forms resistance as prices are unable to make new highs. With the rounded peak established, the market begins to curve down to where the rally first began.
When price meets support, there is a short pause and another minor rally. When price returns to this support level once again, bearish momentum helps push prices through, validating the pattern.
Typically, the handle of the pattern has a slight upward tilt or drift, similar to how a bear flag will trend upward after the flagpole is established.
How To Identify The Cup And Handle: All About Cup And Handle Characteristics
The cup and handle pattern has some clear identification guidelines according to the technical analyst who first discovered it, William J. O’Neil.
Prices must be increasing at the start of the cup. A correction forms a rounded bottom, taking the shape of a cup. A handle then forms on the right side of the cup pattern at about half of the cup’s height. Handles form with a minimum of one-week duration.
The pattern must be U-shaped and not V-shaped. The cup rim resistance line should be roughly the same on both sides, with some room for deviation. The depth of the pattern should not be extremely deep, retaining a shallow, teacup like shape.
Decreasing trading volume is common throughout the pattern. Increasing volume helps confirm the pattern as valid if trading volume kicks in after the handle is formed and throughout the bullish breakout, causing strong continuation.
A breakout above the resistance line following the handle signals that bullish continuation should follow, reaching the cup and handle target based on the measure rule. The cup and handle pattern target can be found by taking a measurement from the base of the cup to the rim of the pattern, then applied to the breakout point of the cup (which is also the breakout point of the handle).
Cup And Handle Crypto Market Day Trading Example
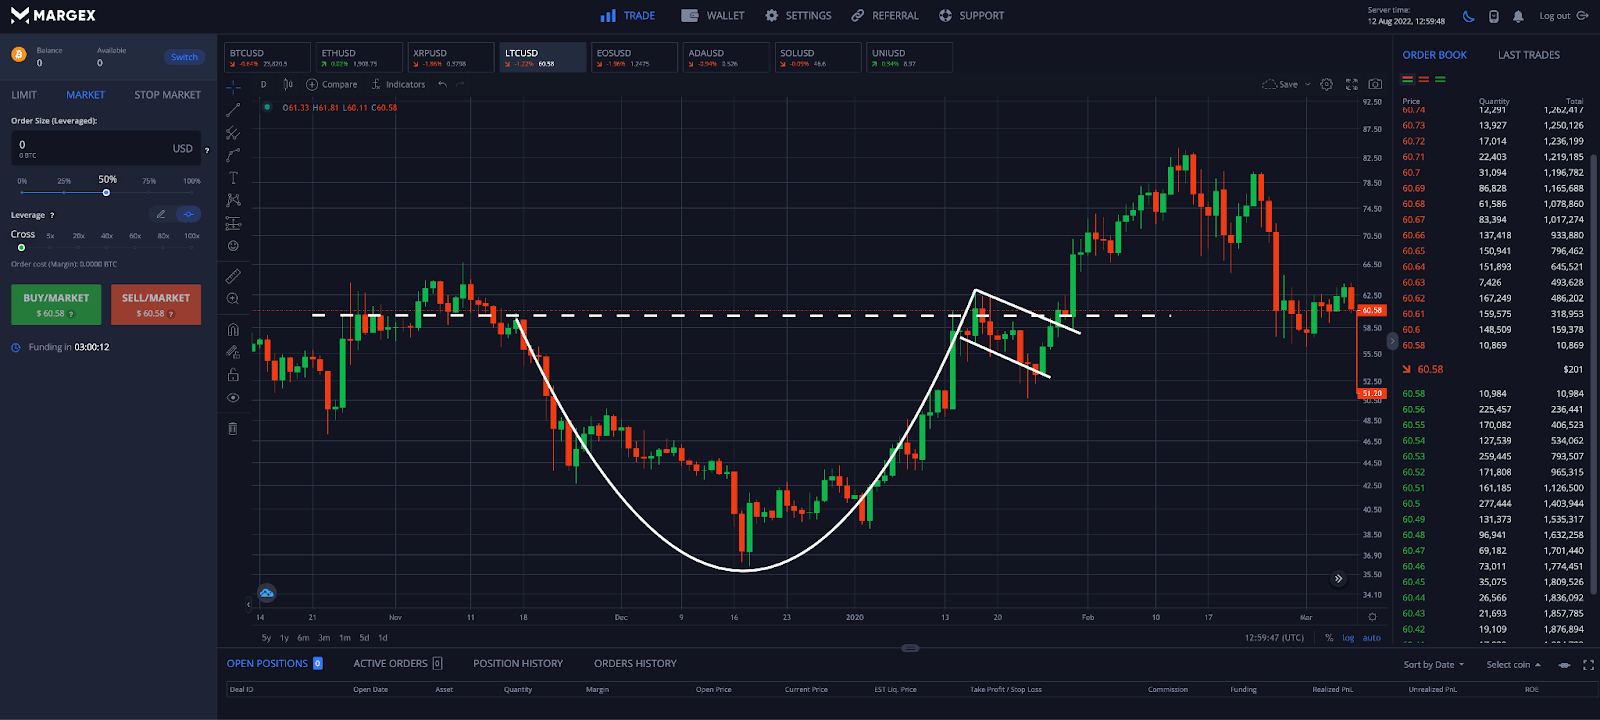
In the below example using the Litecoin intraday chart, we can see that the previous uptrend has begun to retrace, forming a sideways rounding trading range at the bottom of the cup. Slowly, the downside starts to reverse and rebound back to the previous high.
There is another pullback at the resistance trendline, creating the point of the handle on the right-hand side, which typically slopes downward. This resistance line acts as the breakout level at which the price target should ideally be projected from.
What Does A Cup And Handle Pattern Tell The Market?
The cup and handle pattern tells the market that although there was a pullback at resistance, buyers created a strong base of support to move up in the cup part of the pattern. The rounding support level takes price back to resistance, where there is yet another pullback forming the handle.
With only a shorter correction and support only further building, buyers become more confident and push prices through the resistance level. At the same time, because resistance has built up sell orders and short positions, when the pattern ultimately breaks upward and confirms, all of these orders are stopped out, which when combined with new buyers buying the breakout can lead to a fast move and powerful continuation for several bullish candles.
What Are The Limitations Of The Cup And Handle? Understanding Risk And False Signals
Like most chart patterns, cup and handle patterns are open to some interpretation. However, particularly steep or shallow cup and handle patterns can sometimes be false signals. V-bottoms must also be ignored. Also a too high handle could be a sign that the pattern is invalid.
Because the pattern is defined as taking weeks to a year to form, it might not be clear that the market is forming a cup and handle until much later in the pattern.
Cup and handle patterns can also fail, even if they fit all important identification guidelines. Failed or busted patterns can lead to a sharp move in the opposite direction that was expected.
As such, it is important to confirm cup and handle patterns with other technical indicators to increase the probability of success. Cup and handle patterns can be combined with tools such as Fibonacci retracement, Japanese candlesticks (like the doji), the Relative Strength Index, Moving Average Convergence Divergence (MADC), and many other technical indicators.
How To Trade The Cup And Handle Pattern In Crypto Using Margex Trading Tools
Cup and handle trading is easy thanks to the built-in technical analysis tools at the Margex margin trading platform. Margex offers up to 100x leverage and long and short positions on cryptocurrencies like Bitcoin, Ethereum, and Litecoin.
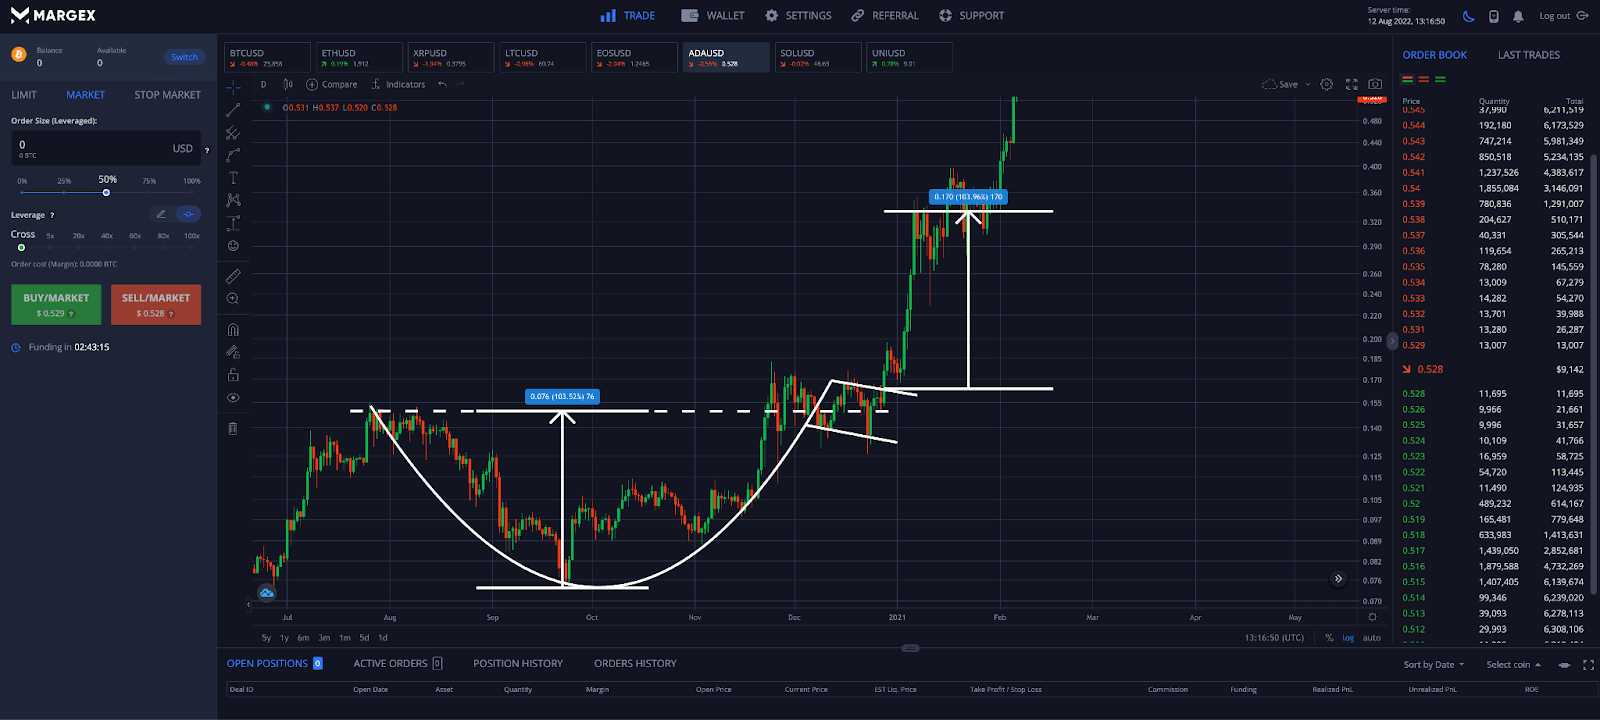
Step 1 – Scan the price chart of the digital asset of your choosing. In the above example, Cardano formed a large cup and handle pattern across several weeks. The handle formed near the resistance line. The pattern was later confirmed and met the price objective based on the measure rule and depth of the cup.
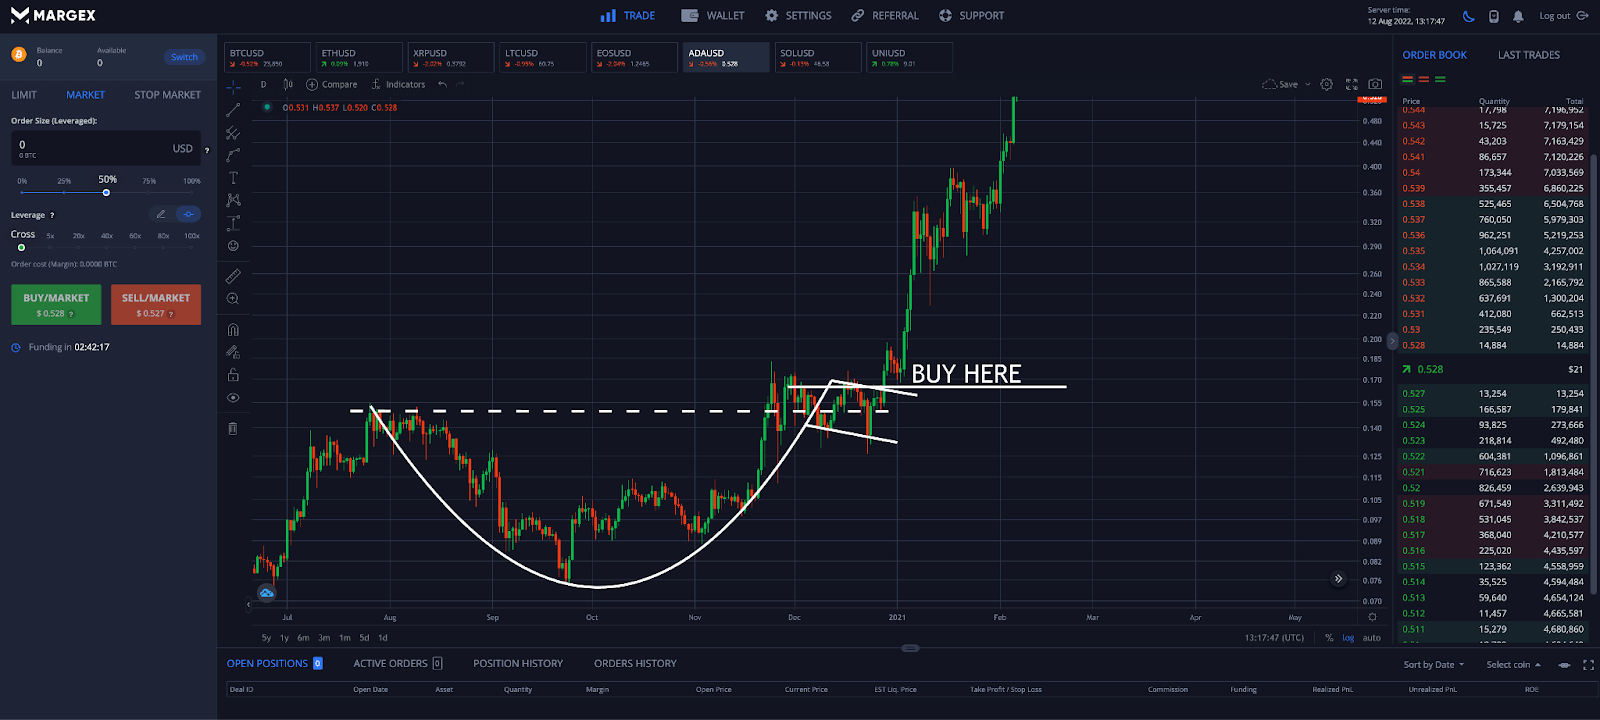
Step 2 – Based on how the pattern should be traded, traders will want to wait for a high volume breakout of the resistance level. This is also called the top or rim of the cup. A buy order or long position can yield great results if the pattern is confirmed.
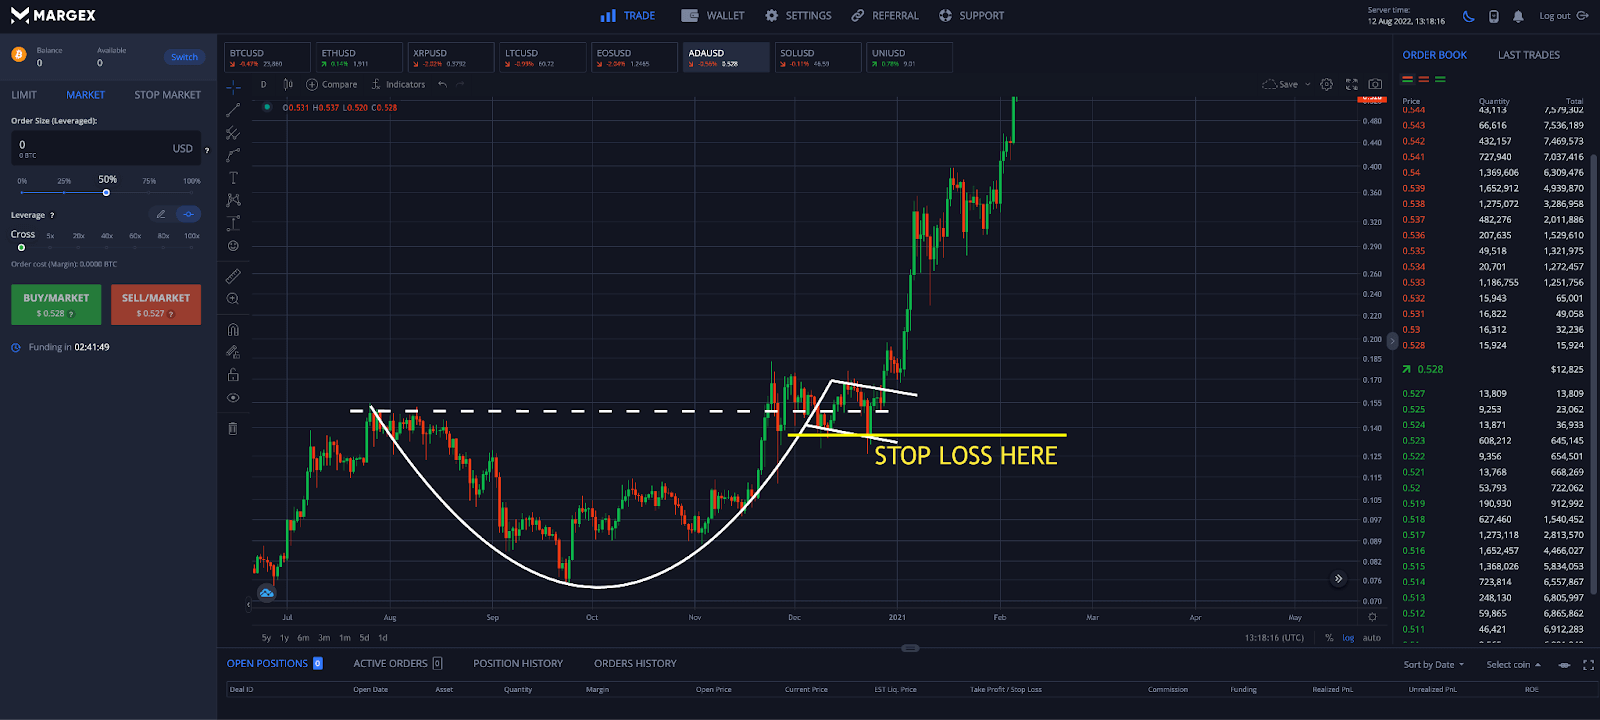
Step 3 – As part of a risk management strategy, set a stop-loss order below the lower trend line of the handle. If the pattern is invalidated and the market moves against you, you will have prevented a significant drawdown or large losses.
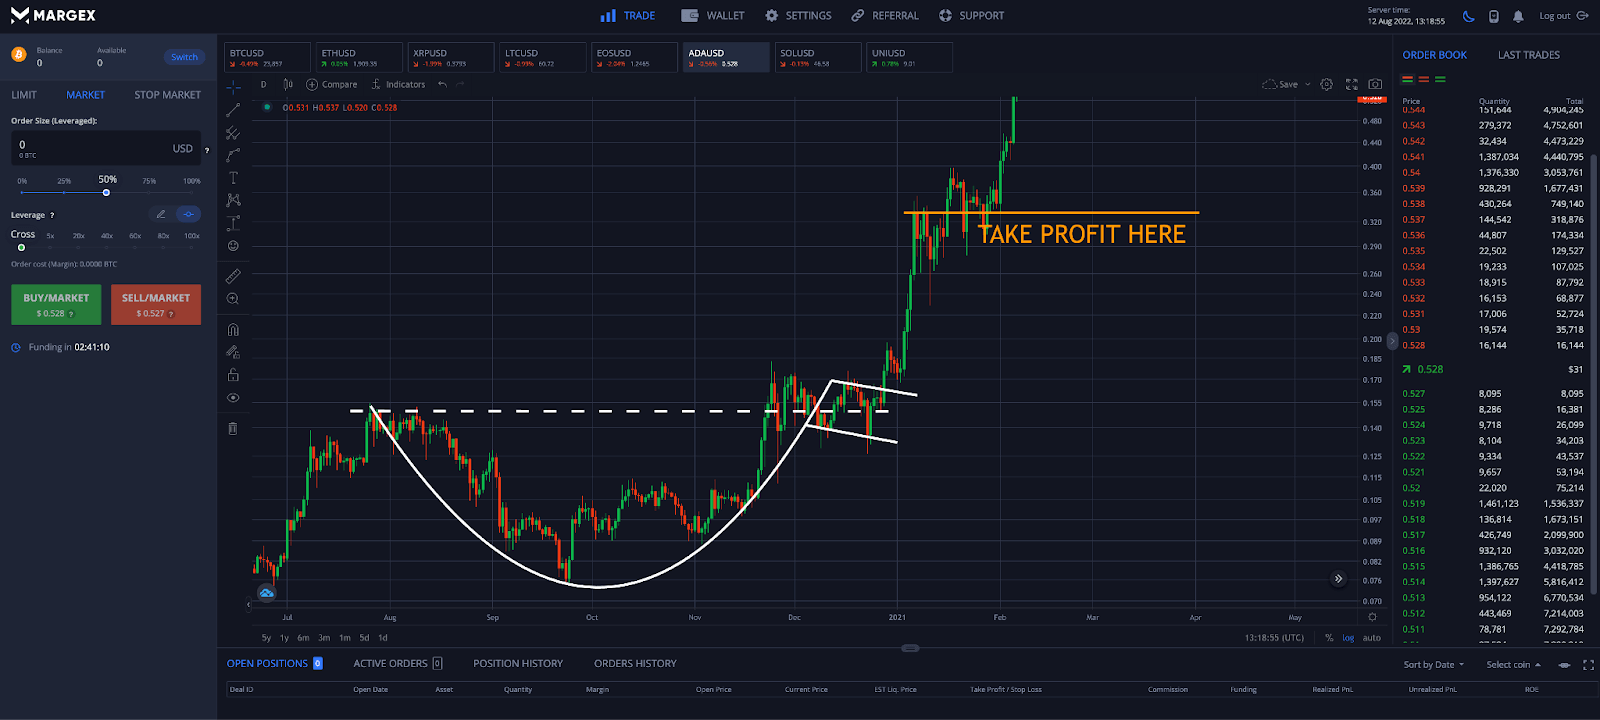
Step 4 – Using the target objective based on the measure rule, traders can get an idea of where to take profit. It is wise to measure and plan out these levels in advance. It helps traders stick to their trading strategy and follow a plan.
FAQ
This guide is designed so users takeaway tons of useful information. To ensure that all possible areas are covered and there are no questions remaining, we have gathered this list of the most frequently asked questions about the cup and handle pattern.
What is a cup and handle pattern?
A cup and handle pattern is a chart formation that resembles a cup with a handle. The pattern forms when price retraces its previous uptrend, and declines in a rounded, U-shape, forming the point of the cup. As price rises to resistance, another smaller pullback forms the handle. Once the resistance line is broken, a large continuation move should follow.
Is a cup and handle pattern bullish?
The cup and handle pattern is inherently bullish and is primarily a continuation pattern. The pattern also comes in an inverse version, where the cup and handle are upside down. In both cases, the handle is on the right-hand side of the pattern. The inverted cup and handle pattern is a bearish continuation pattern.
How do you scan for a cup and handle patterns?
Scanning for the cup and handle pattern in crypto is easy using the free charting tools offered by Margex. Users can draw trend lines, using the curve tool and horizontal resistance lines. Using the measure tool, users can also find the target of the pattern.
What happens after a cup and handle pattern?
After a cup and handle breakout, trading volume usually increases helping confirm the pattern and creating a strong continuation move above resistance. The pattern tells the market that support held after many tries and prices were more likely to move up in the future.
Can a cup and handle pattern fail?
Like all technical analysis patterns and signals, a cup and handle can fail. Busted patterns often result in an exceptionally powerful move in the opposite direction than what was expected. Meaning that a cup and handle that fails, would not produce the bullish results expected, and instead would produce a large bearish move instead.
How accurate is the cup and handle pattern?
The cup and handle chart pattern is a favorite in the cryptocurrency community because it can produce very reliable results during an uptrend. The pattern appears across multiple timeframes. It less commonly appears as an inverted pattern during downtrends, but even these when they appear produce reliable results.
How do you spot a cup and handle?
Spotting a cup and handle is among the easiest patterns to find in crypto. The pattern looks as common in appearance as the cup of coffee on your desk, or the average cup of tea. There is a rounded cup forming support, and a handle formed by a pullback just below resistance. If the pattern is V-shaped, it is not the correct pattern.


