
Diamonds are among the hardest substances in the world. Diamonds are forever. Diamonds are also said to be a girl’s best friend. But did you know that there is a classical chart pattern called the diamond pattern that can signal a powerful reversal in the crypto market?
The appearance of diamond patterns is even more rare than the precious gemstones themselves, making them a fairly unknown pattern among crypto traders. But once you learn how effective the pattern can be, you’ll understand why it has the potential to be a trader’s best friend, too.
The following in-depth guide will teach you how to identify the technical analysis pattern, how to measure a diamond for profit targets, and how to trade the diamond pattern effectively. You’ll also learn where to place a stop-loss, how the pattern compares to other reversal patterns, and so much more.

What Is A Diamond Chart Pattern? A Closer Look At One Of The Rarest Technical Analysis Patterns
The diamond pattern gets its name for its discernible diamond shape with four total trend lines forming diagonal support and resistance. Within these trend lines price action moves up-and-down in a volatile manner.
The diamond pattern shares so many similarities with the carbon-based mineral turned precious gemstone under high pressure and heat. Both are extremely rare.
As much as 50% of the diamonds mined from the ground aren’t of high enough quality to use for jewelry. Oftentimes when the elusive diamond pattern begins to take shape, it ultimately develops into another shape, like a rhombus, isosceles triangle, or even a head and shoulders pattern.
How To Identify The Diamond Chart Pattern? Diamond Chart Pattern Guidelines Explained
The diamond pattern chart should look very similar to a diamond structure with less symmetry than what you would see in a piece of jewelry. Price movements within a diamond top pattern or diamond bottom pattern will never be that distinct naturally so be sure to allow some deviation in the shape.
That said, the pattern must resemble a diamond and not a rhombus or other geometrical shape. The diamond formation is from the same family of classical technical analysis patterns as triangles, wedges, rectangles, and more. In fact, the best way to describe how the pattern develops is as a broadening symmetrical triangle that turns into a traditional-style symmetrical triangle that converges to an apex.
According to chart pattern expert Thomas Bulkowski who wrote The Encyclopedia of Chart Patterns, the diamond pattern should be sloping slightly off-center to one side of the diamond. The breakout point in the diamond formation occurs on the right side of the pattern. To draw the pattern, draw a trend line across each of the successive higher peaks and lower troughs which broaden at first. When the pattern begins to form lower highs and higher peaks, draw two new trend lines to form the diamond shape.
Prices must touch each trend line at least twice for the pattern to be valid. These rules are part of why the pattern is considered so rare. Prices will whipsaw and are allowed to slightly penetrate the trend lines, so long as the majority of price action and candle closes are within the boundaries of each trend line. Any significant closes outside the trend lines with volume or that remain outside the trend line for several candles is a breakout, a busted or failed pattern, or possibly another pattern entirely.
Trading volume will trend down during the pattern as it develops, showing indecision in the market and lessening demand or supply. When the sideways price action is finished, a powerful breakout will occur. Diamond chart formations are typically trend reversal patterns, so each of the two types of patterns will appear at the end of an uptrend or the conclusion of a downtrend. The two types of diamond patterns are called the diamond top formation and diamond bottom formation.
What Does A Diamond Pattern Tell The Crypto Market?
The diamond pattern is more complex in its inner workings in terms of market mechanics than the pattern might visually imply.
The diamond first begins to form at the top or the bottom of a large price movement or trend. As price action begins to consolidate and travel sideways, volatility first increases creating a broadening shape. Volume and volatility then begins to slow-down and there is a distinct lack of a breakout as the pattern converges in shape to an apex. In between the expanding and narrowing shape as prices stairstep upward and downward, there should be a sharp peak and a V-shaped trough.
The breakout point in the diamond should occur before the apex is reached. Ultimately, a diamond top formation or a diamond bottom formation both signal to the market that a potential reversal is coming. In rare circumstances, the diamond top can break up, and a diamond bottom can break down, but these situations produce weak results and are ranked last in performance. When the diamond pattern results in a price reversal as anticipated, the price move can be powerful making for a profitable trading opportunity.
Diamond Pattern Trading Targets: How To Use The Measure Rule To Find Potential Profit Targets
Another reason why diamond pattern is a powerful pattern is because it can produce predictable results in terms of profit targets. Classical chart patterns have price targets that can be projected on a price chart. To find the target of the potential price move, apply the measure rule to the diamond pattern.
To do this, measure from the recent swing high to the swing low point or vice versa, then apply the measurement on the price chart to find the minimum target level. Traders can take a market entry when the first wave begins and price starts to breakaway from the pattern with this target objective in mind.
Diamond Chart Pattern Examples In The Crypto Market
Although the diamond pattern should look roughly the same in both a diamond bottom pattern or a diamond top pattern, we have provided an example of the diamond pattern in both an uptrend and a downtrend to demonstrate its effectiveness as a possible reversal indicator.
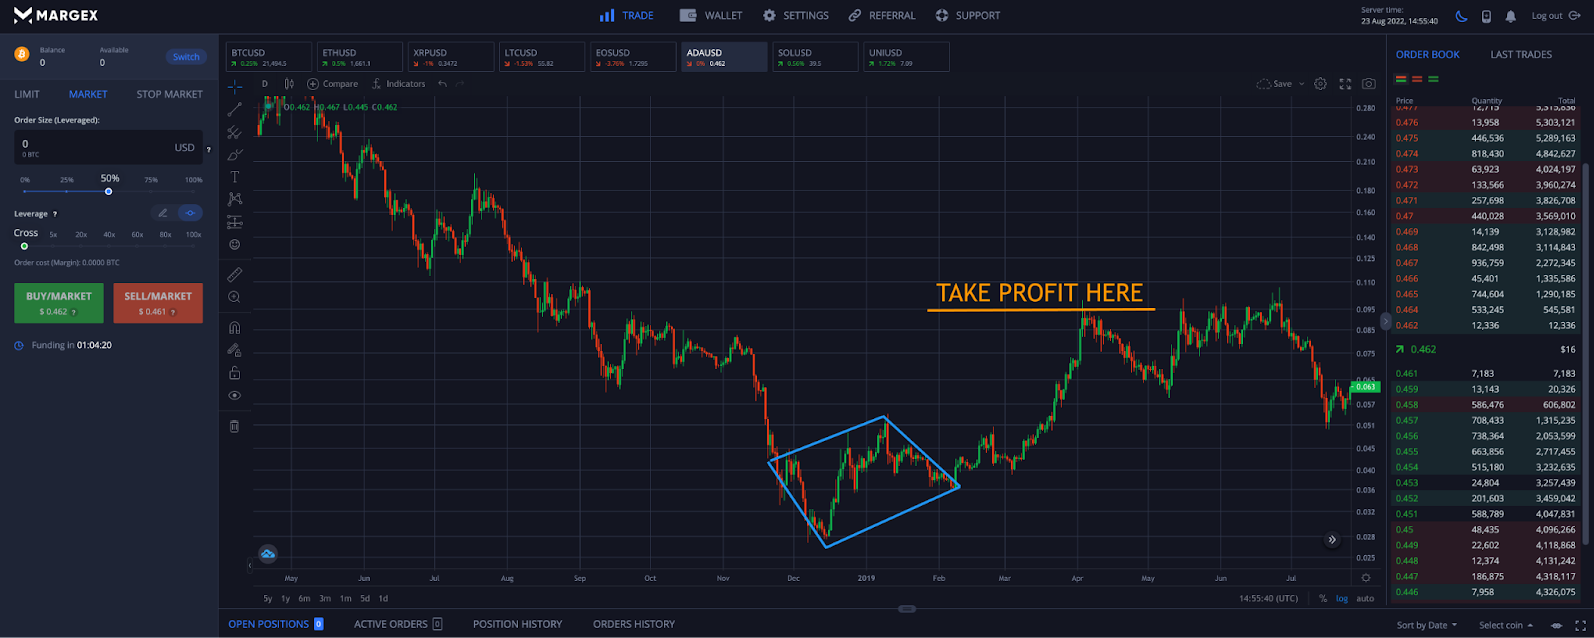
Bullish Diamond Pattern Example
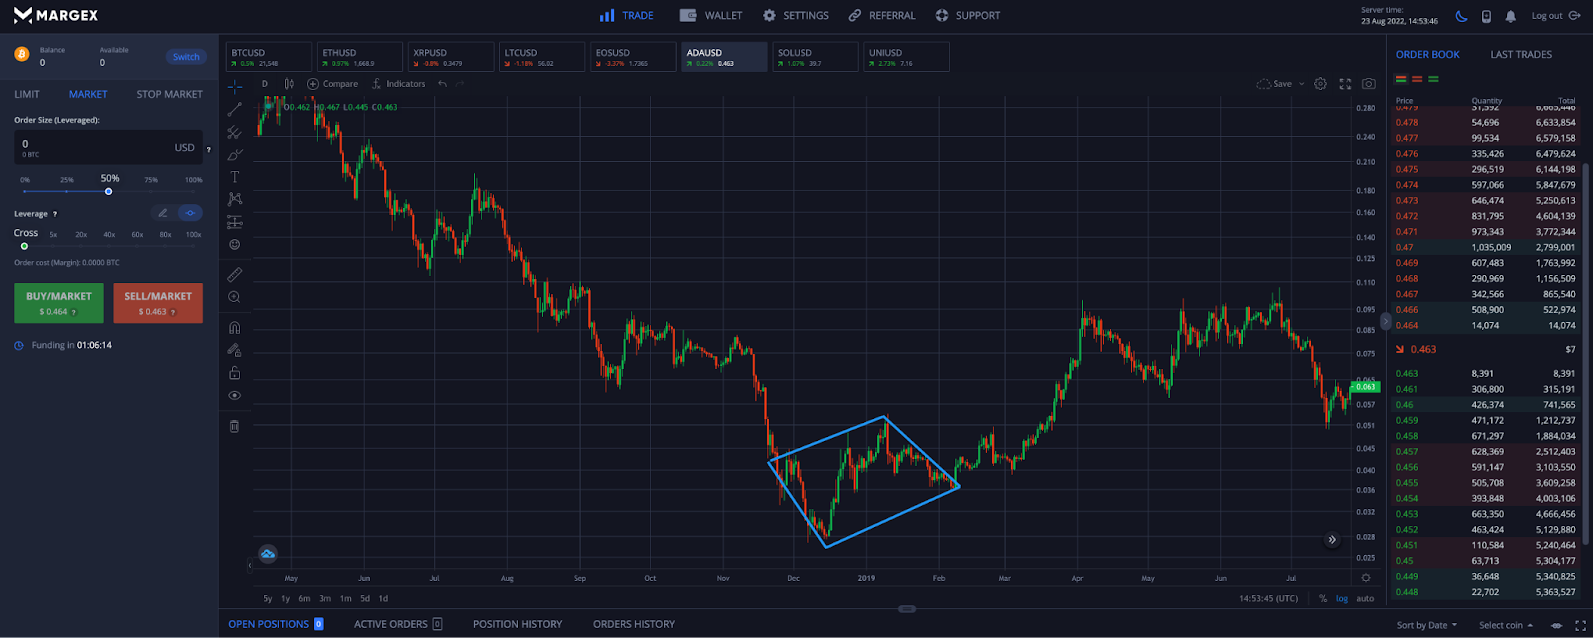
A diamond bottom pattern is a bullish reversal pattern. The bottom reversal pattern forms at the bottom of a downtrend and results in a strong bullish price move and follow-through.
Bearish Diamond Pattern Example
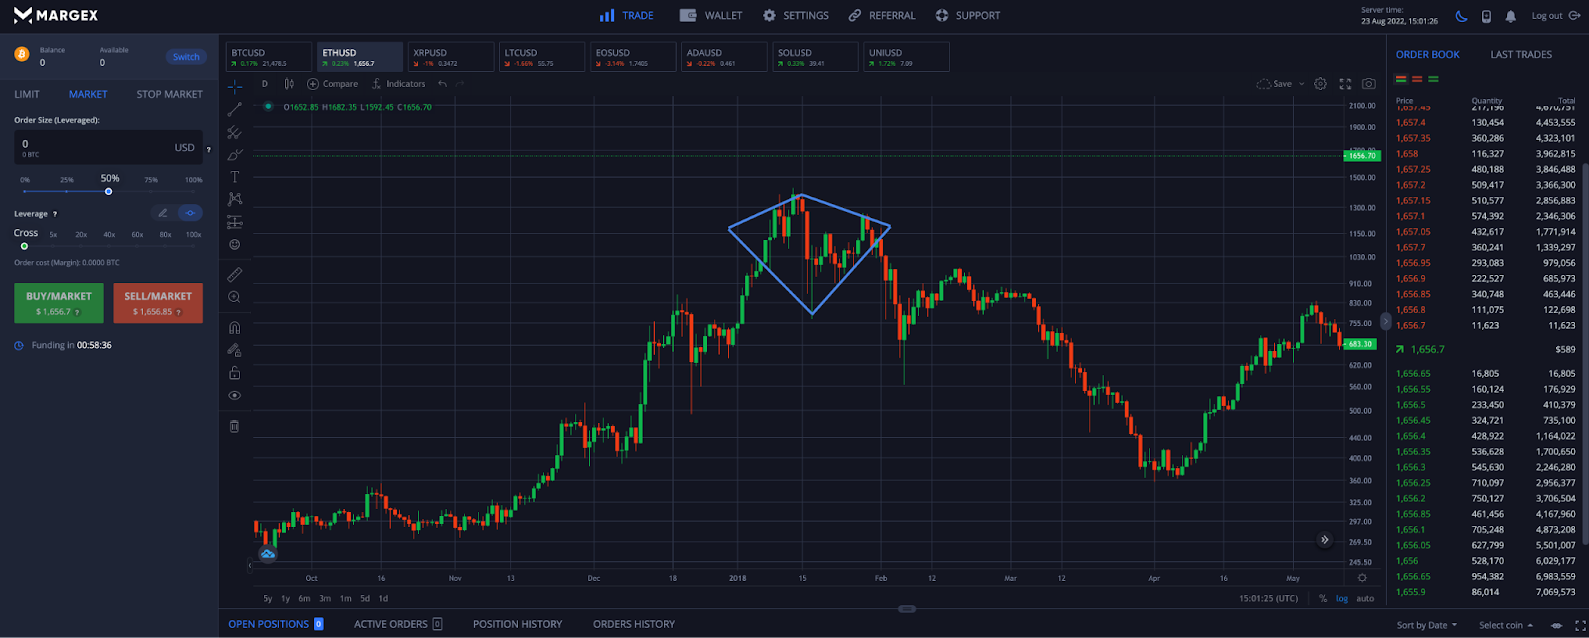
A diamond top pattern is a bearish reversal pattern. The top reversal pattern forms at the top of an uptrend and results in strong bearish price move and follow-through.
How To Trade Diamond Chart Patterns Using Margex: A Step-By-Step Guide
Using the built-in technical analysis tools provided by the Margex margin trading platform, anyone can trade the diamond pattern on any timeframe.
Follow these four simple steps with supporting examples.
Step 1 – Open a crypto price chart, and scan the price action for diamond patterns. Look for diamonds to appear at the top or bottom of a trend.
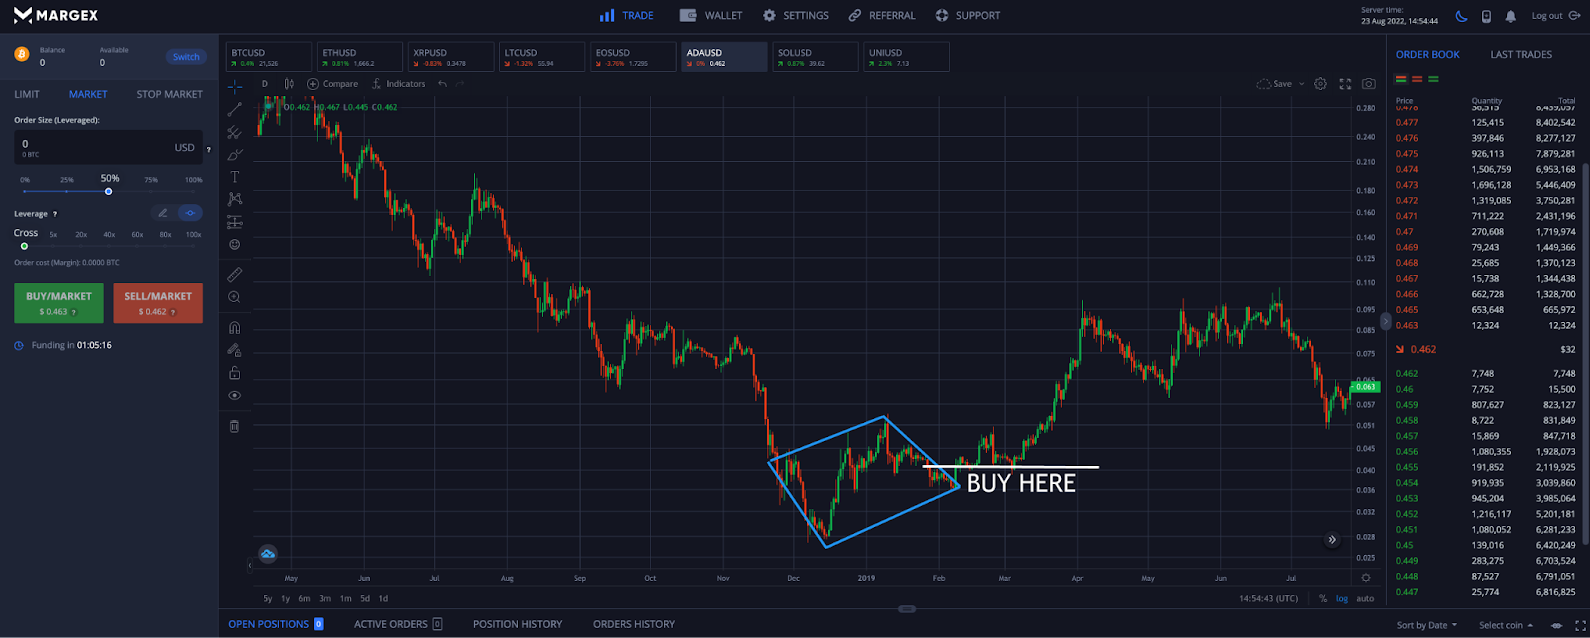
Step 2 – Wait for confirmation of a breakout before taking a position. The diamond pattern is valid once price closes outside the top or bottom trend lines. At this point, place a buy or sell order depending on if you are a bear or bull.
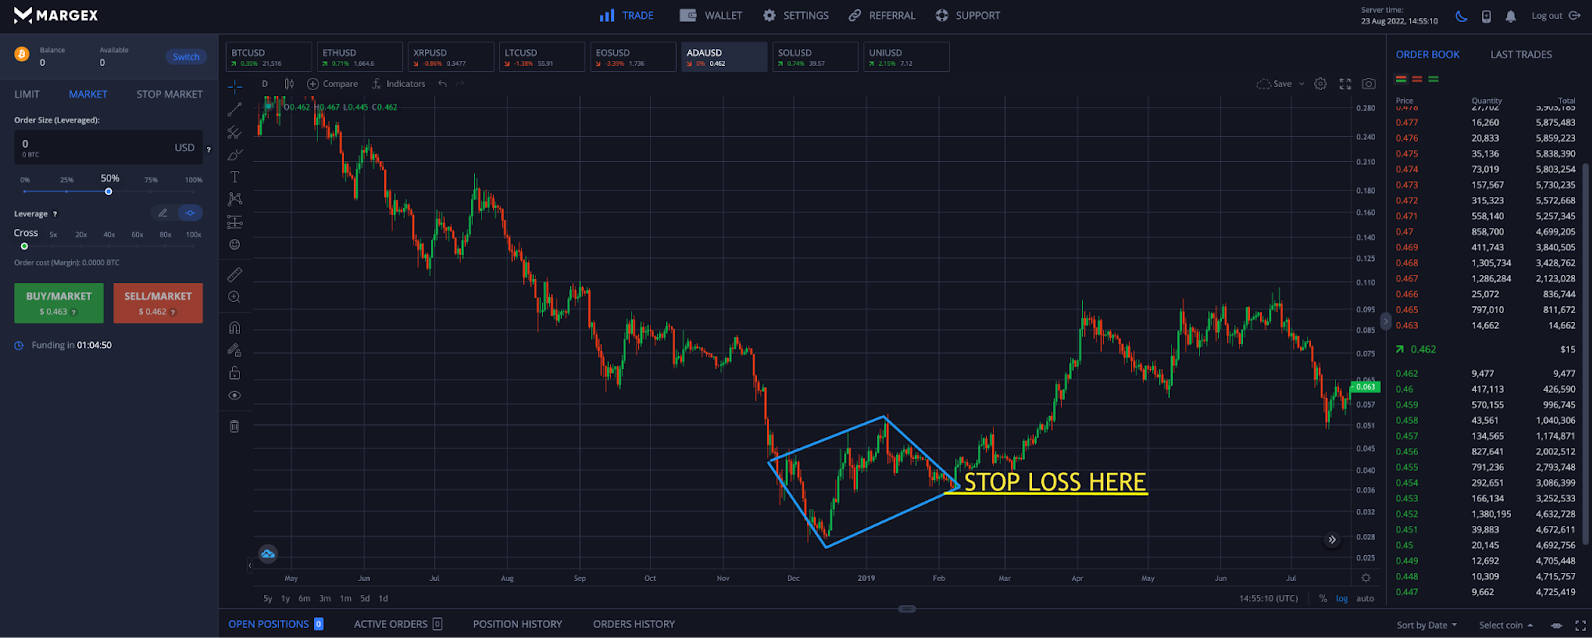
Step 3 – Place a stop loss order above or below the opposite trend line from the breakout point of the diamond pattern. This prevents significant drawdowns from occurring if the pattern fails or price action suddenly reenters the pattern. Never forget to set a stoploss.
Step 4 – Plan ahead to take profit at key resistance or support zones, based on measured move taken using the size of the diamond pattern. Congratulations, you have traded a diamond pattern chart!
If you don’t already have an account with Margex, sign up today with free registration and get access to world-class margin trading tools and built-in charting software.
Diamond Chart Pattern Vs. The Head And Shoulders Formation
The diamond pattern often gets confused with and compared to the head and shoulders pattern and inverted head-and-shoulders pattern.
However, these patterns only represent one half of a diamond shape, with a clear neckline acting as support or resistance. One side of the diamond therefore would have a flat shape and invalidate the pattern.
Due to the way both patterns develop, the pattern can first appear to be one or the other, then develop into the opposite pattern or something different entirely.
The Advantages And Disadvantages Of The Diamond Chart Pattern: Diamond Pattern Pros, Cons, And Limitations
Because the diamond pattern is rare, can develop into other patterns, and its sideways whipsaw can be downright confusing, the pattern has its limitations. Here are some of the pros, cons, and limitations of the diamond pattern.
Pro
The diamond pattern as it nears its completion is hard to mistake due to its diamond shape. Other ways to tell it is a diamond is the slight tilt and declining volume throughout the pattern.
Pro
As a reversal pattern the diamond produces a powerful move in the opposite direction that technical traders can anticipate in advance and profit from.
Con
The diamond pattern is extremely rare. Because of this, analysts aren’t often looking for it until it becomes obvious.
Con
The opposite can also occur, meaning that because an analyst is looking for it, their analysis could have a bias toward spotting the rare pattern. This could cause a trader to jump the gun and the pattern develop into something else.
Limitations
Because of the specific guidelines and structure in which a diamond pattern must form, identifying it and confirmation of a valid pattern occurs extremely late in the pattern and make it challenging to get well-positioned.
Diamond Chart Pattern FAQ: Commonly Asked Questions About The Diamond Pattern
The diamond chart pattern is one of the least common chart patterns, making it difficult to identify and a more challenging setup to predict.
As such, we have prepared this diamond pattern FAQ:
What is a diamond pattern in technical analysis?
The diamond pattern is a rare reversal pattern that can produce a powerful move in the opposite direction when confirmed. A key takeaway from the guide above suggests that the pattern is so rare because there is such a high possibility of misidentifying the pattern.
Why is it called a diamond pattern?
The ultra rare pattern is appropriately named the diamond pattern due to its resemblance to a diamond in its shape as it forms. The support and resistance trend lines first broaden, then converge, creating a diamond shape. A diamond pattern forming on a price chart is the sign of a possible impending reversal.
Is a diamond chart pattern bullish or bearish?
A diamond top pattern has bearish implications and a diamond bottom pattern has bullish implications. The difference is if the diamond pattern appears after an uptrend or downtrend. The pattern has a slight chance of breaking in the same direction if the prevailing trend, but this is even more rare than the pattern itself and the gemstone it’s named after.
How do you trade a diamond chart pattern?
Trading diamond patterns takes patience and a sharp eye since they are extremely rare. To trade the diamond pattern effectively follow the four steps listed by Margex above. The simple step-by-step will walk you through the process along visually with supporting examples.
How do I identify a diamond pattern?
A diamond pattern is somewhat easy to identify due to its diamond shape. However, they can be tricky as diamond patterns are rare and often develop into different shapes. Diamond patterns are characterized as beginning with a broadening sideways triangular pattern that eventually begins to converge into a symmetrical triangle to complete the second half of the diamond shape.
Where can I trade the diamond chart pattern?
Trading the diamond chart pattern is possible using the Margex margin trading platform. In addition to long and short positions with up to 100x leverage on popular cryptocurrencies, there are also risk management tools and built-in technical analysis software from TradingView.
What is the meaning of a diamond pattern?
The diamond pattern tells the market that prices were unable to push past a specific support level or resistance level and the trend is likely to reverse. As such, the sideways price action is indicative of indecision in the market. The fact that volatility first increases as the pattern expands and then both volatility and volume decrease during the pattern due to the ongoing confusion.
Are there any tips for trading diamond patterns?
Diamond trading performance can be improved by combining the chart pattern with technical indicators like the Relative Strength Index, MACD, Bollinger Bands, Stochastic, Fibonacci retracement, and more. It is also more effective if you look for specific candles to form at the top or bottom of the pattern, such as a doji candlestick.
What are diamond hands in crypto?
Diamond hands in crypto trading have nothing at all to do with the diamond technical analysis pattern and instead is in reference to the ability to HODL crypto without selling during corrections. During the 2020 and 2021 crypto bull market, diamond hands took HODLing to a whole new level. Unfortunately, both of these things are a mistake. Trade crypto with Margex instead!
Is there a way to become certified in technical analysis or finance?
If you enjoyed learning about the diamond technical analysis pattern and have further interest in becoming a technical trader, you can continue your education and become a CFA or CMT charterholder. In addition to making better price action-based decisions, you’ll learn about backtesting trading indicators and risk management strategies.


