
Cryptocurrency, indices, forex, and the financial markets present ample opportunities for skilled traders. Trading and consistently winning in the financial markets can be challenging, and when this skill is honed properly, it could become a goldmine.
This skill requires time, patience, and learning the technical aspect of the financial markets is peered into by traders from a fundamental and technical perspective.
Advanced crypto traders and newbies constantly look to adopt winning strategies in the financial markets. Several winning strategies may be utilized by traders trading currencies and instruments in the financial markets.
Identifying and choosing a strategy that works can be challenging and differs from trader to trader based on their personality and schedule. These are key factors that should be considered when choosing strategies for trading the financial markets.
Divergence as an analytical tool can be effective if properly utilized and applied as a strategy while trading on the financial markets
This article will focus on trading the financial markets from a technical perspective using divergence as an analytical strategy.

What Is Divergence
Divergence is a trading scenario where the current market price of an asset moves in a direction opposite to that of a technical indicator.
Technical indicators such as oscillators, Moving Average Convergence Divergence (MACD), Relative Strength Index (RSI), Moving Averages (MA), and traders use Oscillators as trading strategies in the financial markets. Divergence seeks to invalidate technical indicators such as oscillators, thereby signaling a possible reversal in price action.
Divergence as a technical trading tool gives traders foresight on potential trend reversals or weakened trendlines. Divergence can be either positive (Bullish) or negative (Bearish). A positive (Bullish) divergence indicates an upward momentum in the price of an asset.
Positive (Bullish) divergence occurs when the price of an asset is trading low, but somehow technical indicators such as oscillators show bullish signals. While a negative (Bearish) divergence, which is the opposite, indicates a possible decline or downward momentum in the price of an asset. It occurs when the price of an asset is trading high but applied technical indicators show bearish signs of reversals.
Traders pay particular attention to divergent occurrences as an insight into market conditions and entering into trades.
How Does Divergence Work
As applied to technical analysis, Divergence is a one-step signal for upward or downward price movements and trend reversals.
Traders, in general, leverage divergence patterns for two reasons;
- To assess the volume and momentum of an asset’s price.
- To get insights on possible reversals of an asset’s price.
The above insights and information enable traders to make key decisions such as trade entry points, exit points, take profits (TP), and setting stop losses (SL). Although Divergence as a tool provides traders with insights into market conditions and possible reversals, it should not be mistaken for trade confirmation; rather, it should be combined with other trading techniques for better profitability.
Divergence and confirmations are not the same. Confirmations are trade signals that occur when technical indicators point in the same direction where an asset’s price is at.
While Divergence occurs when an asset’s price momentum does the opposite of a technical indicator reading.
Divergence Cheat Sheet Types
The concept of divergence has a root deep in technical analysis when the price of an asset is moving in the opposite direction of the technical indicator. There are two types of divergences, namely regular divergence and hidden divergence.
Bullish Divergence Cheat Sheet
Traders using technical indicators utilize divergences to get insight into an asset’s current price action. A bullish divergence helps traders to spot potential price reversal to the upside thereby aiding trade decisions.
Traders may profit from oscillators, RSI, and MACD indicators, especially when indicator readings conflict with current asset prices. For instance, a bullish divergence occurs when a price makes a new low but the oscillator hints towards upward momentum.
To spot bullish divergence, traders need to keep an eye on the lower lows and bottoms on a price chart while paying attention to opposing indicator readings.
Traders using a line tool between bottoms and lows keep in mind that the bodies of candlesticks are connected and not wicks of the candlestick.
In contrast to trend-following indicators, which are more suited for identifying longer-term trends, oscillators effectively detect short-term price reversals in the financial market.
Traders looking to take advantage of bullish divergence are most likely to use higher timeframes to uncover potential bullish divergencies.
A strong bullish divergence with momentum would surface when an asset’s price reaches a lower low, but the indicator applied tilts towards a higher low.
In this scenario, traders with foresight listen as the market speaks. The markets, in this case, communicate in a way that points out to sellers not selling with the same price momentum moving downward. This points to a potential reversal in price action. In moments like these, price reversals are further validated with a trend reversal candlestick pattern following a bullish divergence.
It is important to note that traders pay attention to key resistance levels as prices would test those levels to validate full reversals.
Smart traders could go a further step to confirm a potential breakout of resistance levels by analyzing trade and buy volumes at the point of reversal.

Bearish Divergence Cheat Sheet
Divergence, previously discussed, refers to a scenario where the price direction of an asset does not correspond with the trend direction of a technical indicator.
A bearish divergence, in this case, would occur if the trend direction of technical indicators such as oscillators and RSI goes against rallies or upward movements of a particular asset.
Traders who utilize bearish divergences, in addition to technical indicators, may get informed decisions and signals on potential downward reversals and retracements.
Bearish divergences signal low momentum and loss of steam in an uptrend. Traders could use it to identify overbought regions on a price chart. Once identified, traders may enter short positions after validating entry points using multiple indicators.
A strong bearish divergence may occur if the price movements of an asset make a higher high as compared to the readings of an indicator making a lower high. In this case, oscillators or a relative strength index (RSI) indicator.
Skilled traders could translate this to mean a decrease in average price momentum even when an asset’s price is on a rally.
Bearish divergence as a tool in determining price level retracements and reversals should not be used solely as a yardstick in making trade decisions as a trader.
Key factors include areas and levels of support, false positives, or scenarios where bearish divergence appears but no significant reversal occurs.
Traders may also adopt other methods of analysis or indicators such as community channel index (CCI), moving average convergence divergence (MACD), stochastic, on balance volume (OBV) to identify and validate bearish divergences.
Regular Bearish Divergence
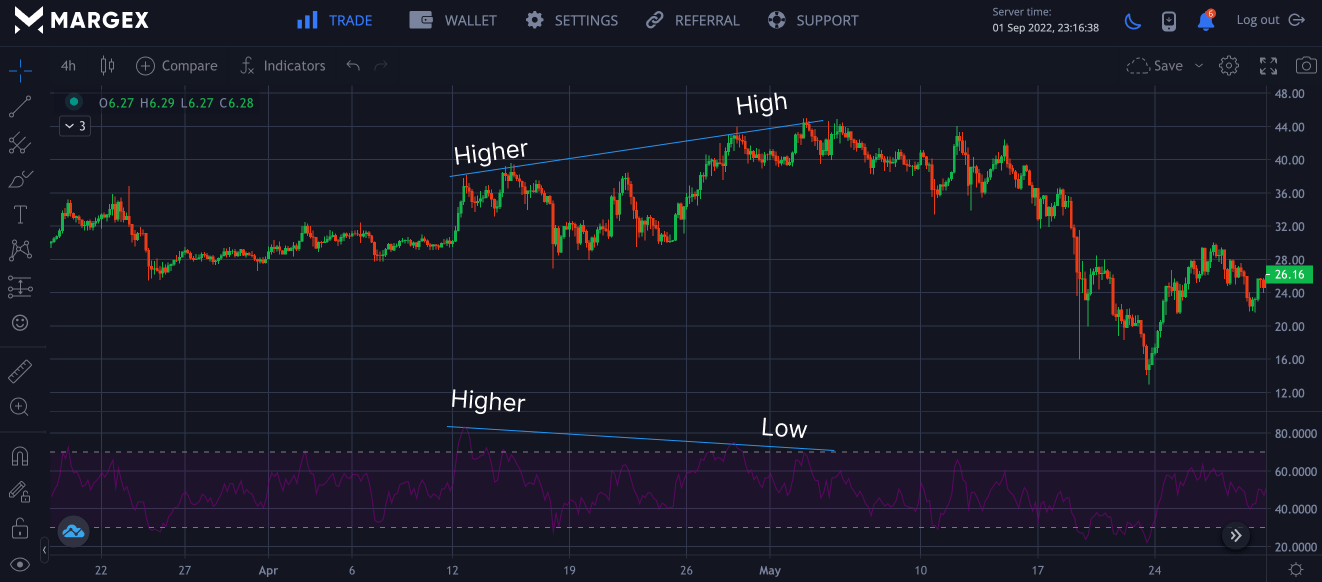
A regular bearish divergence occurs when an asset price indication forms higher highs (HH), but the oscillator forms lower highs (LH). This divergence occurrence is said to be a normal bearish divergence.
This type of divergence is usually spotted in an uptrend. After the price hits its second high and the oscillator hits a lower high, traders expect the price to reverse and move downwards more often than usual.
Hidden Bearish Divergence
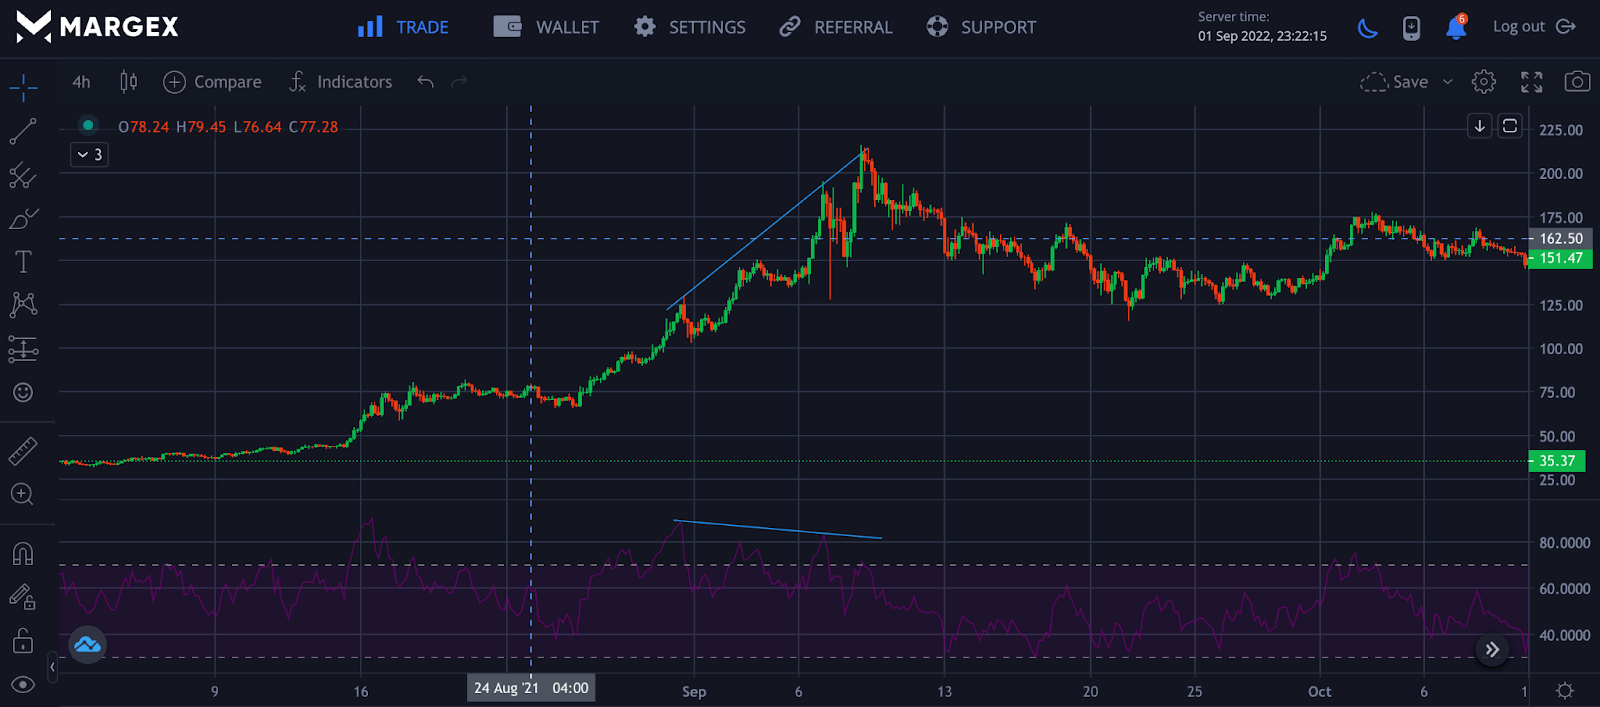
As the name implies, hidden bearish divergence is not easily spotted by traders. Its occurrence is evident when the trend patterns of an asset or currency pair appear to form a lower high (LH), but the oscillator creates a higher high (HH). If a hidden bearish divergence lurks, an asset’s price may drop further, and the downtrend may continue.
Skilled traders using multiple indicator confirmations may interpret hidden divergences on a price chart to be a signal for a potential trend continuation.
Hidden bearish divergence, when identified, can help traders identify trend patterns or movements and be on the right side of a trend. Trading against trend patterns may result in significant losses over time and many bad trades.
Every trader’s goal is to make profits, minimize losses and consistently build a trading portfolio for the long term.
How to Trade Divergences on Margex?
Margex, a Bitcoin-based derivatives exchange, enables cryptocurrency traders to trade a variety of crypto assets with up to 100x leverage.
The Margex exchange is designed to make trading simple even for newbies, and some of its built-in features are intended to assist traders in becoming more profitable.
Furthermore, Margex offers a very unique feature for traders and investors to trade while staking, which allows you to earn passive income despite how volatile trading can be.
Assets are not lockup, and rewards are paid daily through an automated system into your staking balance.
If you have a Margex account, you will have access to these unique staking features and technical analysis tools, which are designed with real-time prices to assist you in making money trading.
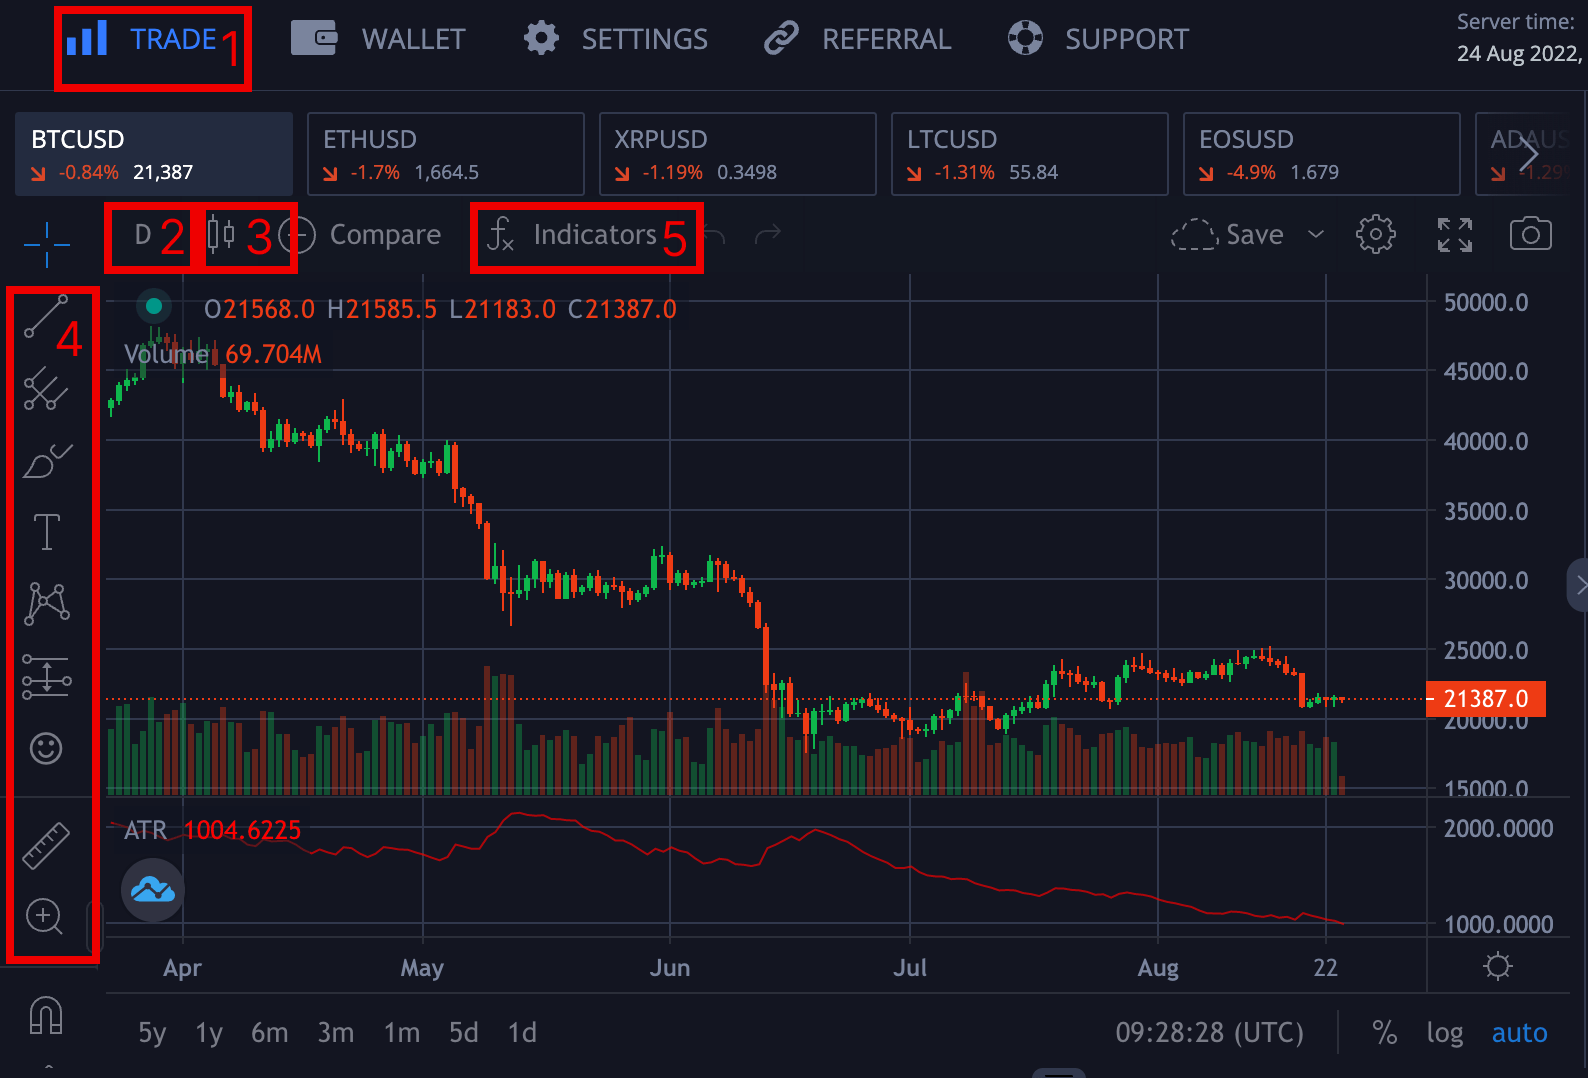
To trade on Margex and use its technical analysis tools like a pro, you need background knowledge of how these interfaces work.
- Trade: Clicking label 1, you will have access to all of the Margex trading tool interface yourself.
- Timeframe: All traders have different trading timeframes based on their strategies; clicking on label two will allow you to pick a time frame that suits your personality.
- Candlestick: Label 3 helps the trader to change the setting from a line chart to candlesticks for ease of usage and will allow us to trade better.
- Toolbar: The toolbar labeled four allows the trader to pick different technical tools for analysis ranging from trendlines, and horizontal lines, to drawing on the chart.
- Indicators: The labeled part 5 allows the trader to pick indicators they wish to apply to their trading strategy. This guide will use the Relative Strength Index (RSI) to spot bullish and bearish divergences.
To trade divergences, you need to determine the trend in the market; in a downtrend, you should be looking out for a bullish divergence signaling a trend reversal to the upside, while for an uptrend, you ought to look for a bearish divergence signaling the end of the trend with a potential reversal.
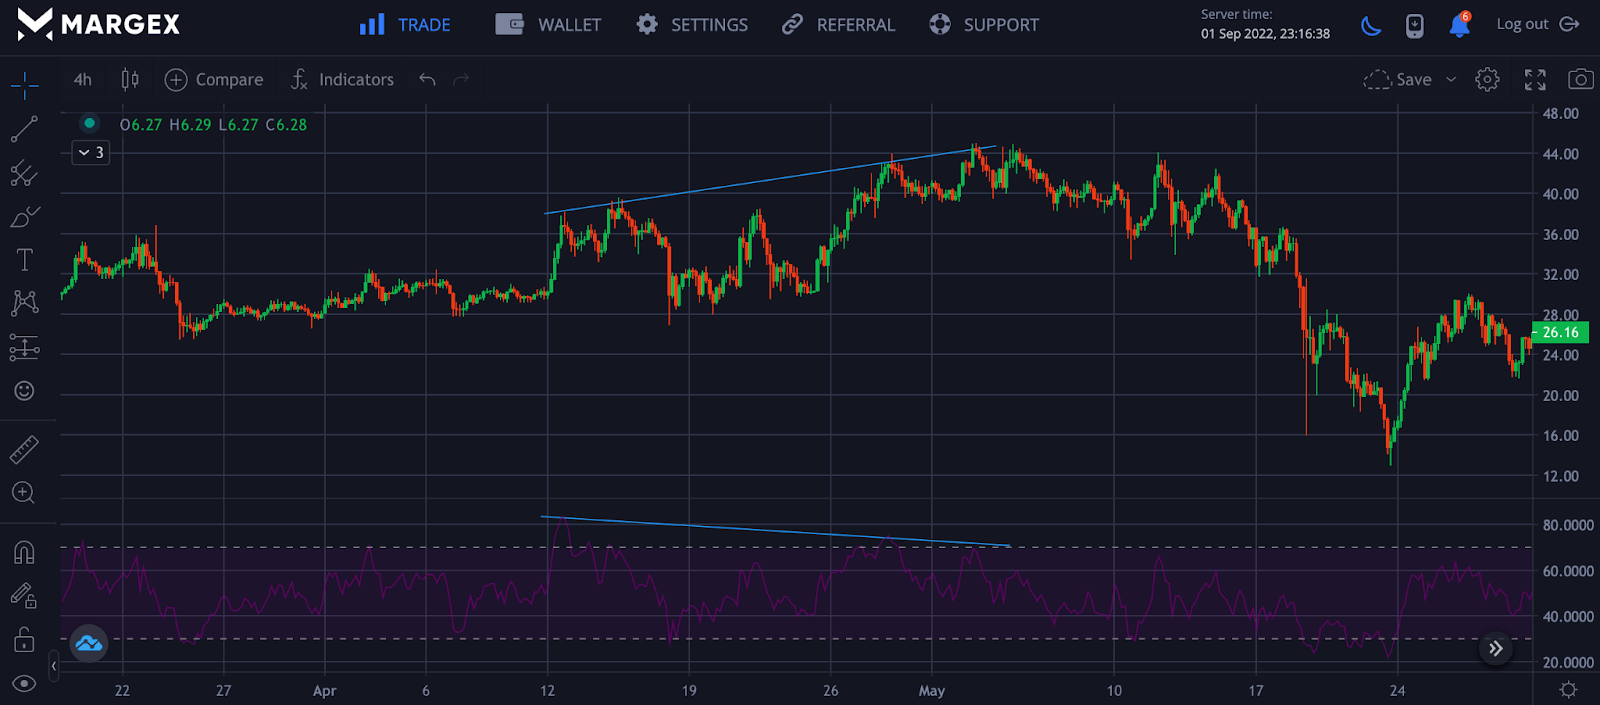
The chart above shows an uptrend in the four-hour timeframe; the candlesticks created a higher high as the RSI created a higher low, signaling a potential change in trend from uptrend to downtrend.
Rules for Trading Divergences
Trading divergences can be challenging but rewarding, doing it the right way with profitable results. Here are rules to follow for divergences.
- Ensure prices have a higher high than the previous high and a lower low than the previous low.
- Lines should be drawn on successive tops and bottoms.
- Only tops and bottoms should be connected, and pay attention to price actions.
- Don’t force the pattern to fit in; be consistent with your chart’s swing lows and highs.
Divergence RSI
Divergence RSI occurs when the price of an asset moves in the opposite direction of the RSI. A bullish divergence occurs when the RSI becomes oversold with higher lows, and the price appears to show a lower low. This indicates potential bullish momentum, and a break of the RSI above the oversold region confirms this trend in a long or buy position.
Bearish divergence happens when the RSI is overbought with a lower high accompanied by higher highs in price.
Divergence Cheat Sheet Trade Examples
Here are examples of different divergences we have discussed so far with their examples and how they are formed.
Bullish Divergence
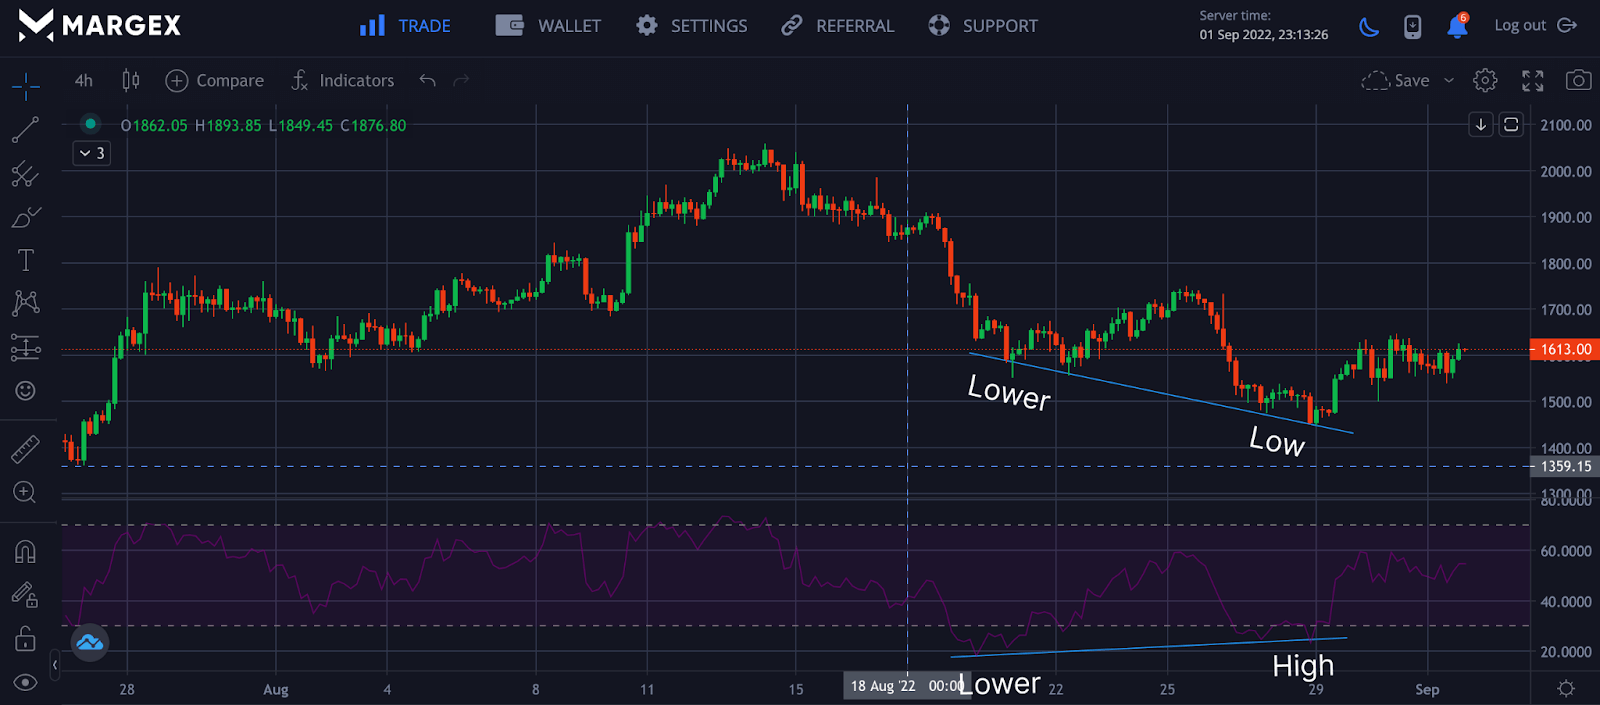
On forming a bullish divergence signaling a potential price change from a downward movement, the RSI begins to move to the upside, confirming that a long position can be activated. The bullish divergence is formed when RSI moves opposite to the prices. RSI becomes oversold and forms a lower high while prices form a lower low for this trend to be valid.
Bearish Divergence
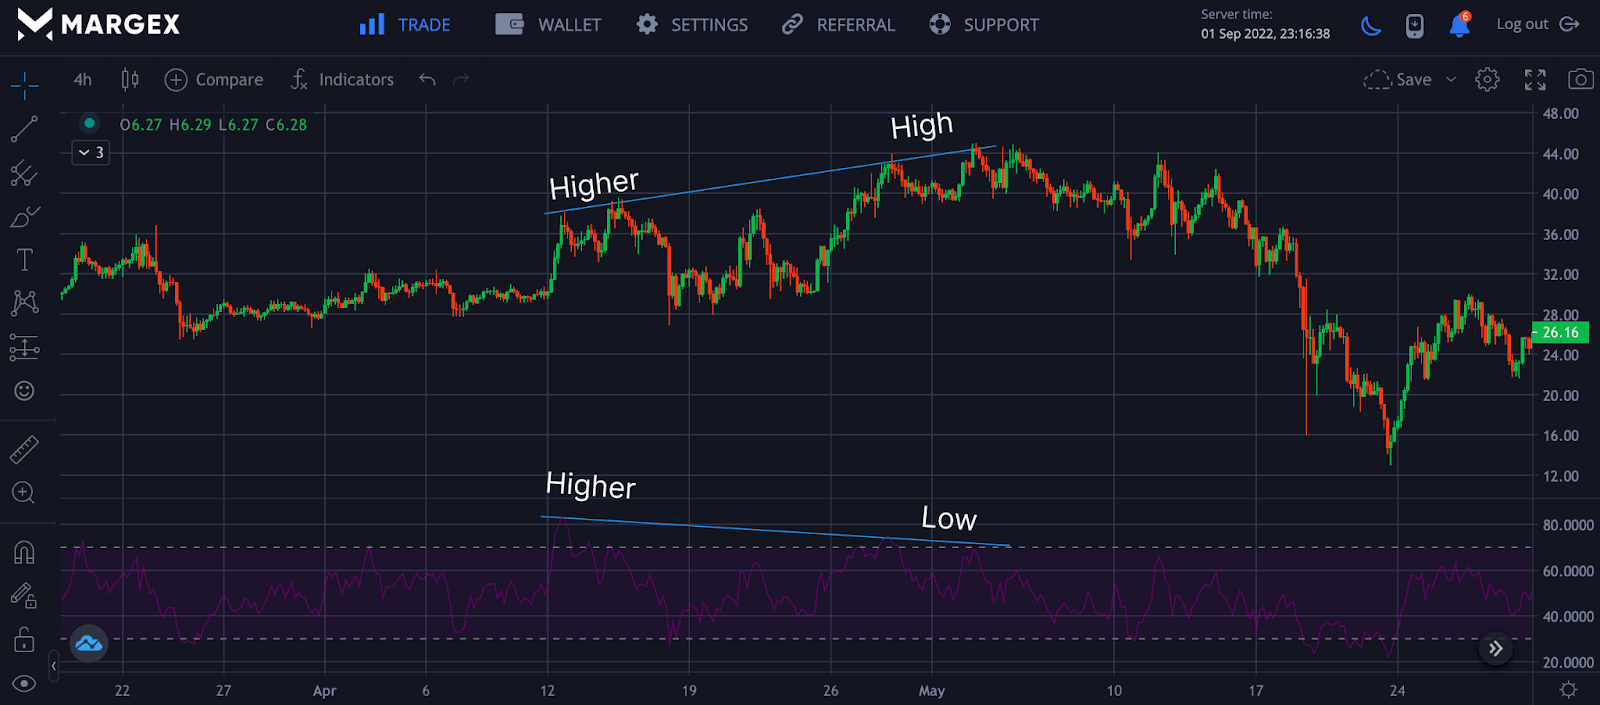
On forming a bearish divergence signaling a potential price change from an upward movement, the RSI moves to the downside, confirming that a short position can be activated. The bearish divergence is formed when RSI moves opposite to the prices. RSI becomes overbought and forms a higher low while prices form a higher high for this trend to be valid.
Hidden Bullish Divergence
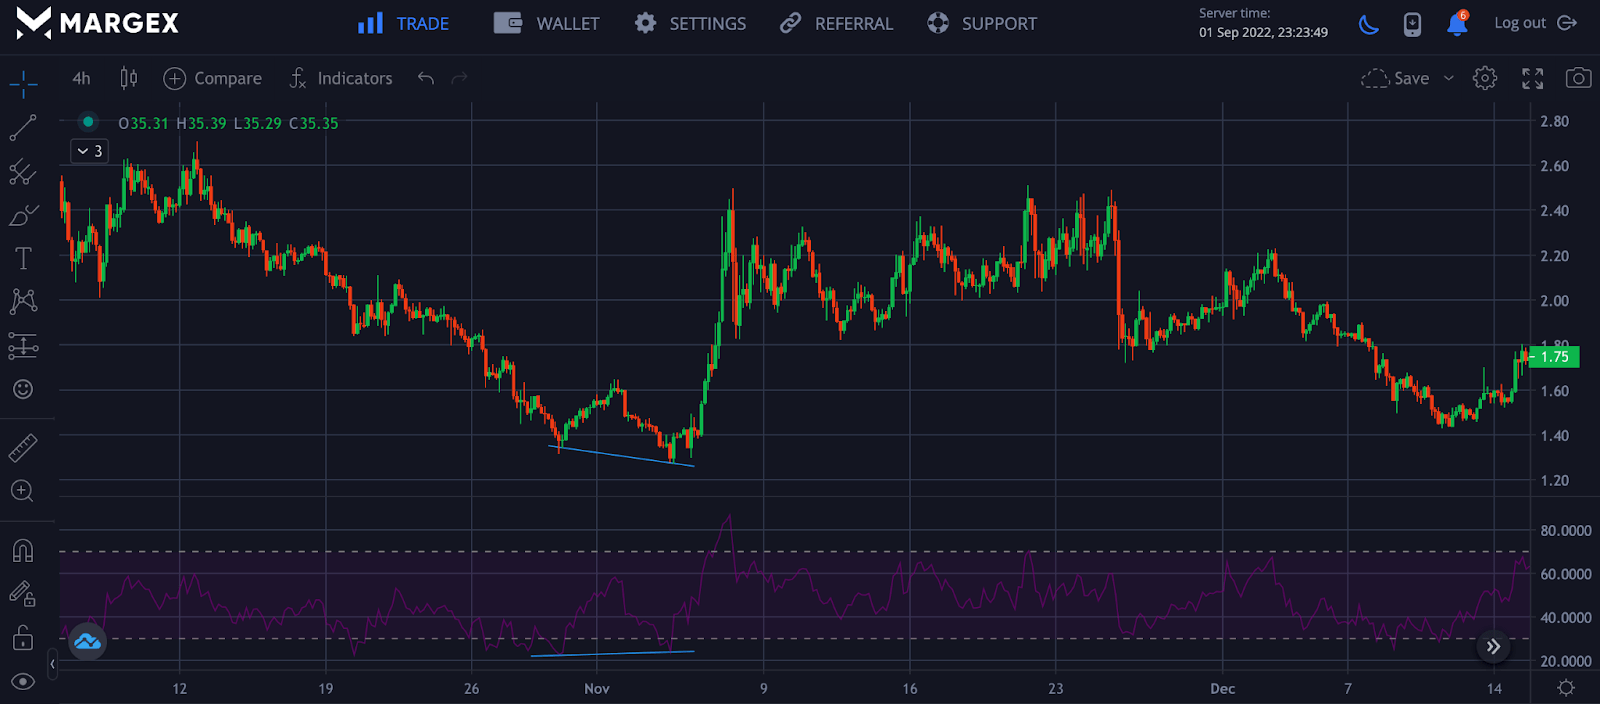
Just as the name implies, they have hidden features that are not as pronounced as the regular divergences; you must pay careful attention to see these patterns.
Hidden Bearish Divergence
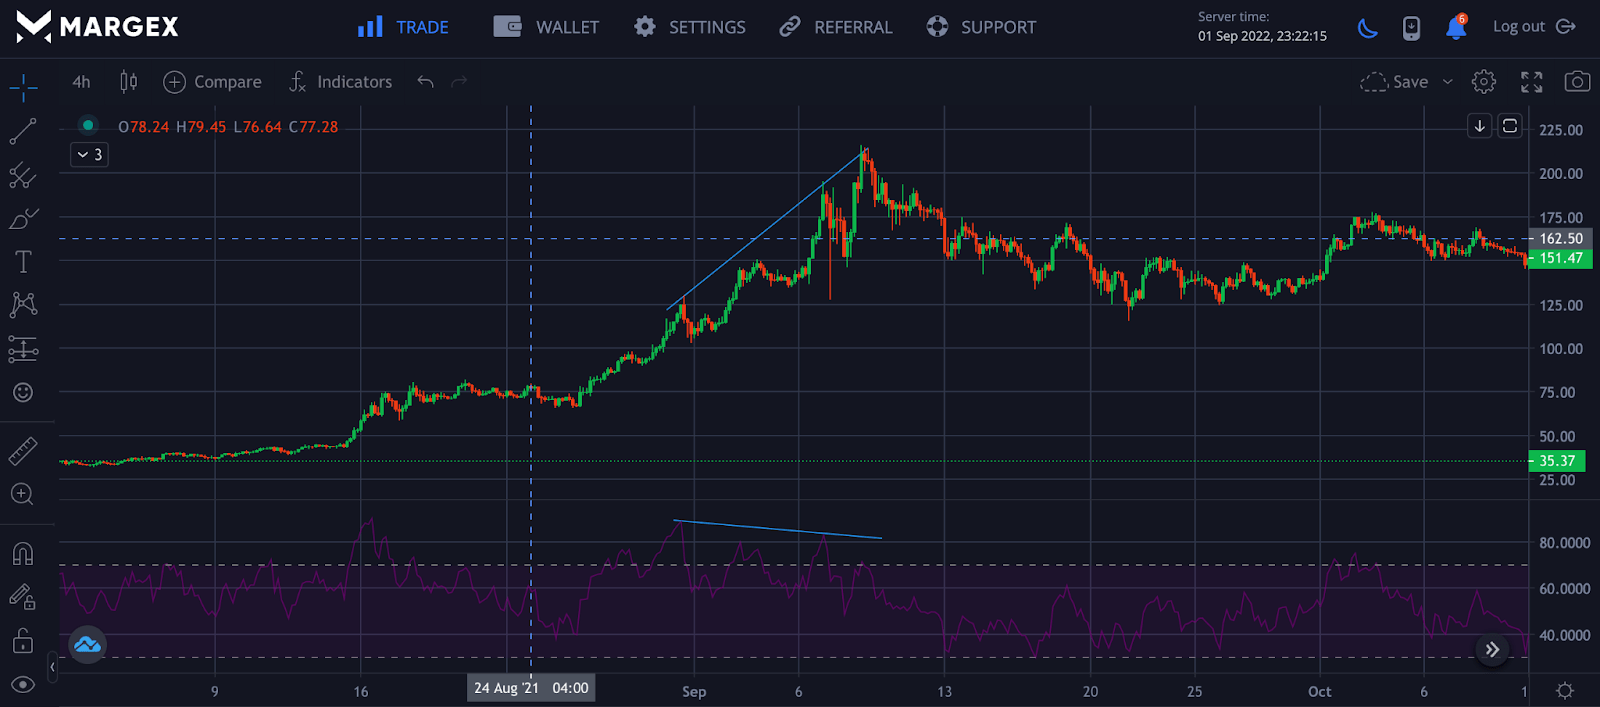
The patterns formed for a bearish divergence are not as pronounced as they should be for regular bearish divergences.
FAQ
There are a lot of unanswered questions about trading bullish chart patterns and how to use them. This section of the article focuses on the questions you want to be answered.
Which Indicator Is Best For Divergence?
This depends on the trader’s preferences, but most traders prefer to go for what is widely accepted in the financial market. The most common indicator for divergence patterns is the Oscillator, but there are others like MACD, the RSI, CCI, or stochastic. In this analysis, we will be using RSI as the oscillator indicator.
How Effective Is Divergence In Trading?
Divergence is one of the strongest reversal signals you can get. But remember that this is a reversal trading strategy whereby you fade the current trend. Despite its effectiveness, trading divergencies with other proven strategies will lead to better profitability.
Is Hidden Or Regular Divergence Stronger?
There are two types of divergence that can signal a bullish rally may soon begin. Regular or hidden divergence is the most common type. Hidden divergence is a little more difficult to spot but can be a powerful pattern, signaling a shifting trend.
How Do You Spot Hidden Bullish Divergence?
Hidden Bullish Divergence can be seen and spotted when the price is in an uptrend. Immediately the price makes a higher low (HL), look and see if the oscillator does the same. If it doesn’t and makes a lower low (LL), we’ve got some hidden divergence.
How Can You Tell Fake Divergence?
The most proficient and skilled can’t tell. Traders may only take divergence signals in the direction of the long-term trend. Traders also pay attention to candlesticks closing to confirm divergence. The use of other technical indicators to confirm the divergence signal may be adopted in spotting true divergences.
Is Bullish Divergence Good?
Bullish divergence is good when used appropriately in the right market condition. Divergencies can not be used in all market scenarios, but when the need arises, it can be proven to be a key tool in predicting an end to a downtrend, and a potential reversal is imminent.


