")
The evolution and growth that has taken place in the crypto space can not be overemphasized, coupled with the fact that traders on a daily basis need to adapt their trading strategies to fit the market best to become more profitable and develop a better strategy to stay ahead of the market to maintain a better profit portfolio.
The result of this growth on the blockchain makes it challenging to stick with a single trading strategy and become successful or effective as a trader. Considering that the market operates in phases, and according to research, only 20-30% of the market trends while the remaining 70% is a ranging market, one would look for the best technical analysis strategy that best goes with a particular market phase to preserve capital and minimize the risk potential.
To become successful and a standout performer in the crypto market, traders combine the right trading psychology, strategies, and chart patterns, to profit from the market as there are countless opportunities in the crypto market.
In this guide, your knowledge of how to use technical analysis tools such as double exponential moving average will be grounded, and you will be able to make a clear application and how to trade double exponential moving average with other patterns on the chart.
What Is The Double Exponential Moving Average (DEMA)
The double exponential moving average indicator is also well known as the DEMA indicator, developed by Patrick Mulloy to help technical analysis traders to spot potential uptrend or bullish markets and downtrend or bearish markets. This technical analysis came into existence to get better at finding better moving averages of commodities by reducing the lags common with regular moving average indicators and helping provide something that would be more precise and provide timely entries.
The DEMA indicator is a double exponential moving average indicator that is more responsive and reacts faster and better to recent price data than other traditional exponential moving average indicators. Moving averages tend to lag based on studies as they are known as lagging indicators, and as such the is a usual delay in generating trading signals.
The DEMA indicator, therefore, tries to address the issues that are very common with most moving average indicators; this can be seen clearly when other moving averages and used and compared, such as the simple moving average and the exponential moving average.
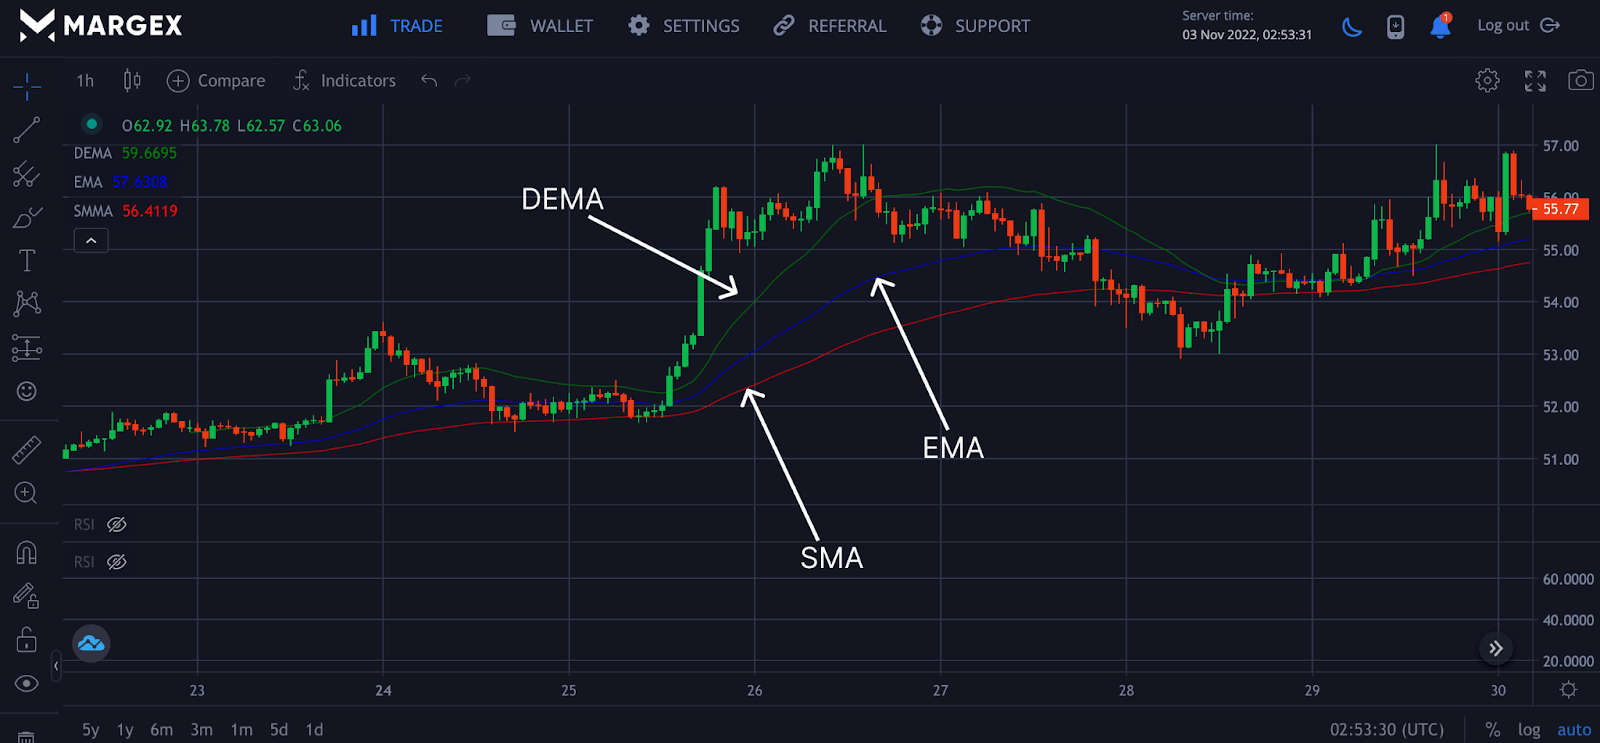
From the chart above, DEMA means double exponential moving average, EMA means exponential moving average, and SMA means simple moving average. The chart shows the price for LTCUSD pair as the DEMA moving average indicator responds fastest to a price change in an uptrend, followed by the exponential moving average and the simple moving average responding least to the price change. This is to help us conclude that the DEMA moving average is a better filter for lags and responds better to price action than other indicators.
You can access all of these indicators and carry out technical analysis for free if you have access to the Margex platform. Margex is a Bitcoin-based derivatives exchange that allows users to trade with up to 100X leverage size and simultaneously stake their tradable assets to make more profitable returns. Margex unique staking features make it one of a kind in the crypto space, as you can earn up to 13% APY on your staked assets while still using them to trade.
There are no lockup periods, and all staking rewards are sent to the staking balance daily with the help of the Margex automated system that helps to bring this to possibility.
How To Use Double Exponential Moving Average
Using the DEMA moving average indicator is easy to use and apply. This indicator best combines a shorter DEMA moving average indicator and a long DEMA moving average indicator. In this case, we will use the 21-day DEMA moving average and the 50-day DEMA moving average. The goal of using these two moving indicators is to find a crossover of the two DEMA moving averages or where there is a possible intersection of the moving average for a potential price reversal to an uptrend or bullish market and downtrend or bearish market, depending on the market sentiment at that particular time.
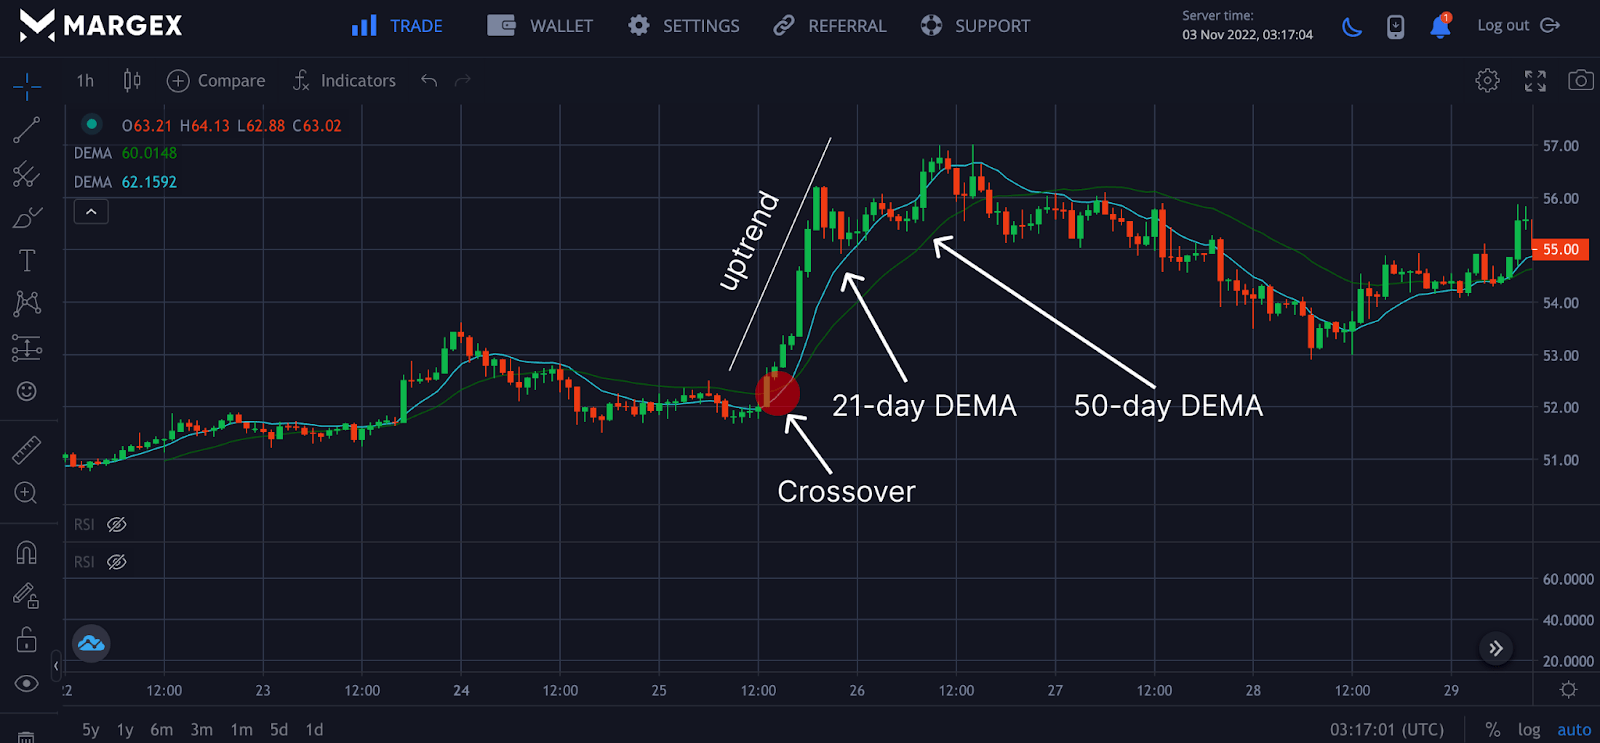
The chart above shows 21-day DEMA moving average and 50-day DEMA moving average for LTCUSD pair, making an uptrend price reversal after the crossover of the 21-day DEMA and the 50-day DEMA. The 21-day DEMA crossover the 50-day DEMA from the bottom to the top, indicating a potential price reversal from a downtrend to an uptrend, with the DEMA indicators responding to price changes. The close of price above the DEMA moving averages crossover to the top signals price reversal to an uptrend. A close of the price below the DEMA moving average indicates a potential price reversal to a downtrend.
Calculating The DEMA?
The double exponential moving average calculation is complex and relatively long. As such, it is optional to know the calculation but understanding the concept gives you an edge on the usage and how it can be valuable compared to other moving average indicators. All you show know and understand extensively is how to use and interpret charts with the help of the indicator. DEMA moving average indicator is found on Margex and can be easily used when you have access to your account, and if you don’t have access, you can create one in no time for free. Let us focus on how to calculate the DEMA indicator.
Step 1 – The Simple Moving Average (SMA)
The first step necessary for calculating the DEMA is first to calculate the assets’ simple moving average (SMA). This is done by adding the closing or opening prices of the assets and dividing them by the number of periods.
Step 2 – The Exponential Moving Average (EMA)
The exponential moving average is calculated next. You accomplish this by employing a multiplier. The example below demonstrates how to accomplish this.
Calculate the SMA: Sum of periods / periods
Multiplier: (2 / (Periods + 1) )
EMA: (Close – EMA (previous day)) x Multiplier + EMA (previous day
Step 3 – Double EMA
The next step of this process is to find the double EMA
Double EMA = 2 x EMA – EMA (EMA)
Although the indicator is called the DEMA moving average, the equation above does not rely on a double exponential smoothing factor; rather, the equation doubles the EMA but cancels out the lag by subtracting the smoothed EMA.
Because of the complexity of calculation, the DEMA moving average requires so much data as compared to the straight exponential moving average (EMA); you do not need to memorize the calculation; all you need do is make use of the DEMA moving average tool on Margex platform for free.
How To Identify Trend?
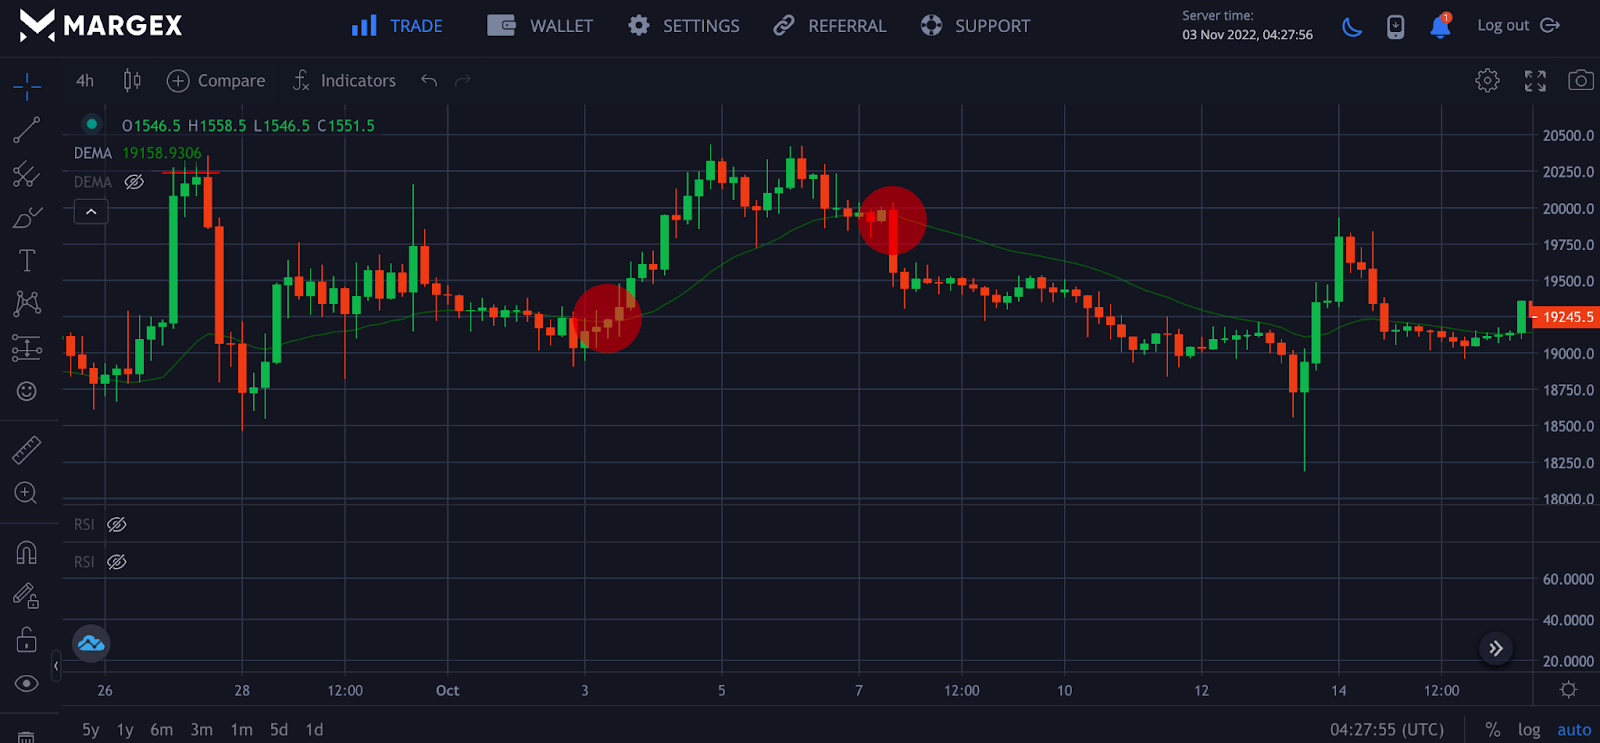
From the Image above for BTCUSD char pair, we are using the 50-day DEMA moving average to identify the current trend in the crypto market, as this will be key to you making the right decision as to where you want to place your trade.
Trading in the opposite direction is a way of losing your portfolio and not a good strategy to follow when trading in the crypto industry.
From the chart above, a close of BTC prices above the 50-day DEMA moving average indicates a potential price reversal from a bearish market to a bullish market, depending on the market conditions. A close of BTC price below the 50-day DEMA moving average indicates a potential price reversal from uptrend to downtrend price movement.
By identifying the current market trend, a trader could look to open a long or short position using the DEMA moving average to discover the current market trend.
The DEMA moving average indicator line provides the information needed to determine an uptrend, downtrend, and a ranging market. When prices trend above the DEMA moving average line, it is said to be an uptrend; when prices trade below the DEMA moving average, it is said to be a downtrend; In contrast, prices move around the DEMA moving average line; the market is wide. Trading in a ranging market can be challenging and tough, so most trader look or wait out for a trending market.
How To Identify Support And Resistance
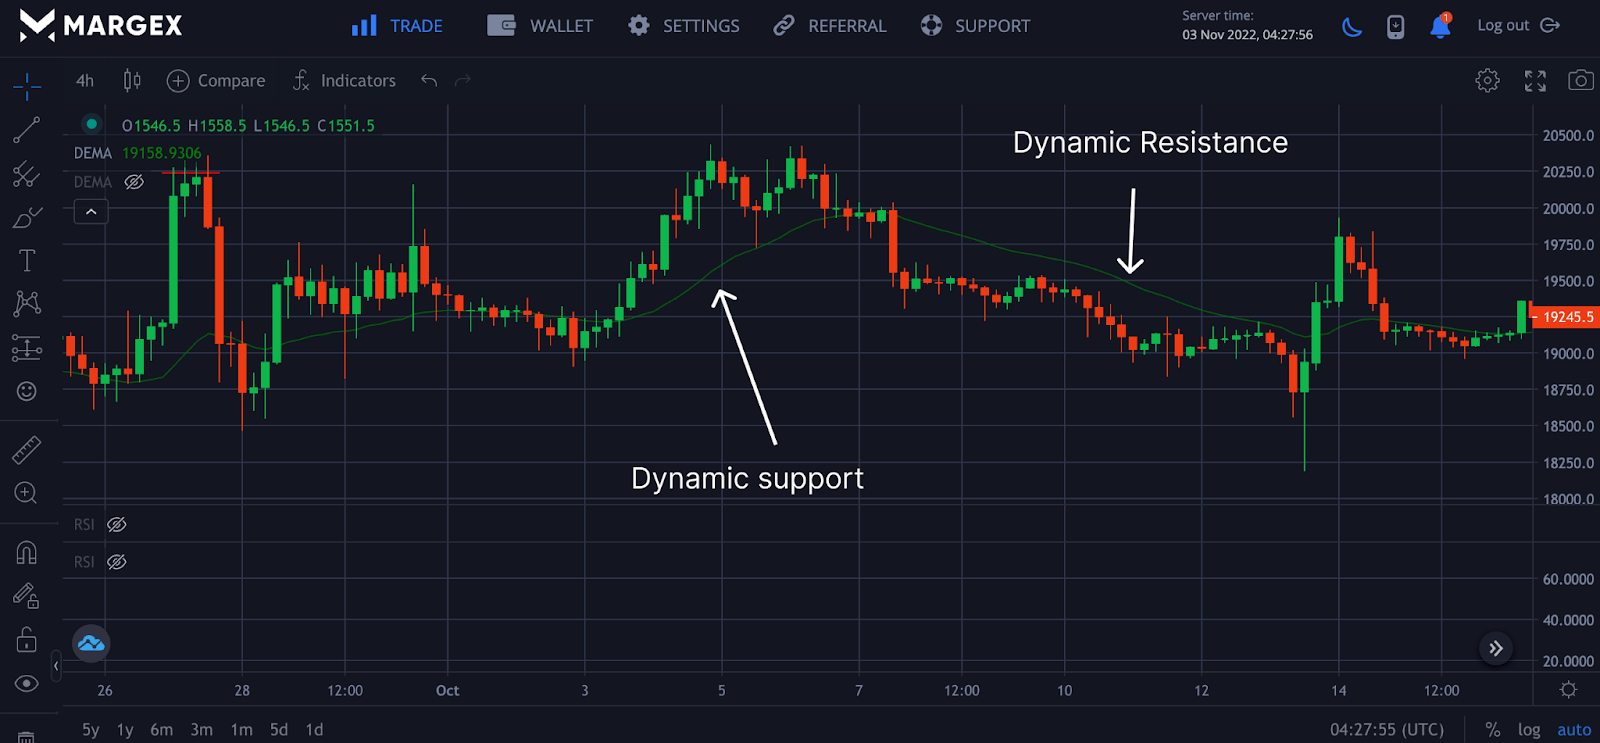
Support and resistance are the key foundation of all trading as they help the trader identify the key level and best position their strategies to favor a particular trading style. There are many support and resistance levels in the market and how to find them, but the most common support are fixed and dynamic support and resistance. The DEMA moving average indicator focuses on the dynamic support and resistance and their levels.
The Double Moving Average indicator can be very useful in determining support or resistance levels within an uptrend or a downtrend. That is why the intersection can frequently create a zone of support when prices move away from the DEMA indicator to the upside and then return to the DEMA line. In the same way, when prices move to the downside of the DEMA moving average indicator and then pull back toward the DEMA moving average line, that interaction can create a zone of resistance.
Frequently Asked Questions On How To Trade The DEMA Indicator
What Are The Benefits Of Using Double Exponential Moving Average
- It can be used to spot trend reversal and continuation patterns.
- Traders can also use the DEMA to determine support and resistance levels.
- It can be used across all financial asset classes.
- It is not as complicated as some other indicators.
Why Is DEMA Of Crucial Importance In Technical Analysis?
DEMA is very important because it lags less compared to other moving averages and is usually very close to the real-time price point. Therefore, traders can use the DEMA to quickly identify points of interest on the charts and plan their trades accordingly. You can also combine it with other indicators for a more rounded strategy
Why Should You Use Double Exponential Moving Average?
If you are a short-term trader, the DEMA moving average can prove to be an invaluable tool for you. This is because it more readily reveals the direction and strength of a trend. You also do not need much technical know-how to implement the double exponential moving average strategy.
How Is The Double Exponential Moving Average Calculated?
The name might mislead some into thinking the DEMA is gotten by multiplying the EMA by two. That is not the case. The DEMA is simply the EMA of the EMA. How so?
After calculating the first EMA, another one is applied on it and called the smoothed EMA. Then the smoothed EMA is subtracted from the double of the first EMA.
In other words: DEMA = ({2 X Initial EMA} – Smoothed EMA)
What Are The Drawbacks Of The DEMA?
Even though it is an excellent indicator for short-term use, the Double Exponential Moving Average may not be suitable for trading on the longer term. It can also be inaccurate if the market is not moving in any particular direction i.e. if the market is ranging.


