When it comes to crypto trading, investors are always seeking a competitive edge. They will draw trend lines to form chart patterns, turn on a series of technical indicators, or anything else they can do to gain even the slightest advantage.
Another tool crypto traders can use is called the Fibonacci retracement tool. It is used to project Fibonacci ratios at key retracement or extension targets which can be used to find potential support or resistance levels.
Fibonacci ratios, or “Fibs” as they are commonly referred to for short, are based entirely on math and can help to pinpoint precise areas where there is a high probability of a potential reversal or powerful reaction.
The following guide is designed to teach you all about the origin of Fibonacci, explain why Fibonacci retracement and Fibonacci extension levels are important, and show you how to use Fibonacci retracement to trade cryptocurrencies and other global markets.

Introduction To The Fibonacci Sequence
The term Fibonacci most commonly refers to the Fibonacci sequence, which is a sequence of numbers (called Fibonacci numbers) named after Italian mathematician Leonardo Bigollo Pisano, who popularized the number sequence.
He was considered the "the most talented Western mathematician of the Middle Ages" and was paid a salary by the Holy Roman emperor Frederick II, who regularly advised on matters and helped solve problems. The Holy Roman Empire referred to him as “Leonardo Fibonacci.”
In his 1202 book Liber Abaci (the Book of Calculation), Fibonacci introduce to the world the Fibonacci sequence that serves as the basis of Fibonacci retracement trading, as well as what today is called the Hindu–Arabic numeral system.
The book included the first mention of the Fibonacci number sequence outside of Indian mathematics, which was first discovered by Indian mathematician Virahanka. Its introduction had a domino-effect across Europe, altering the landscape of bookkeeping and accounting. The new system replaced Roman numerals, and helped the banking system in Europe grow.
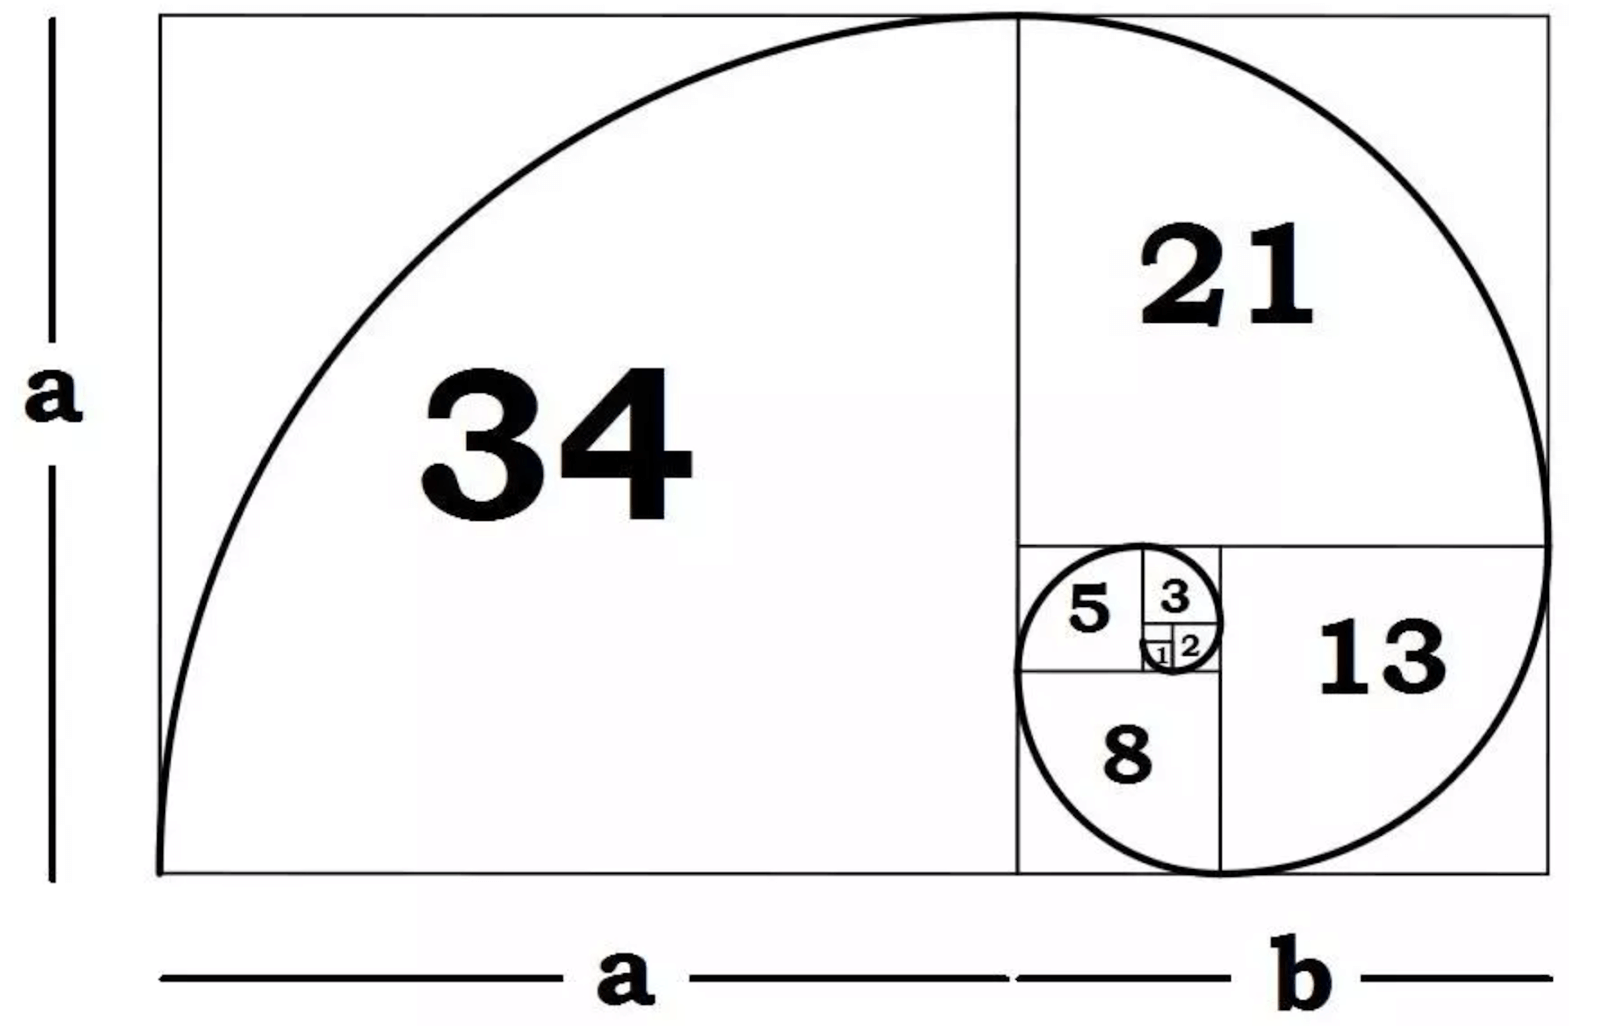
Liber Abaci solved the theoretical growth rate of the population of rabbits using a sequence of numbers now bearing the author’s name. Each next number in the sequence is the sum of the previous two numbers, starting with 0,1,1,2,3,5,8,13… and so on.

What Is A Fibonacci Ratio?
The Fibonacci ratio is derived from the Fibonacci sequence popularized by Liber Abaci. The sequence itself isn’t all that is important, the ratio between each number is also significant.
The quotient between each next number is equivalent to the ratio 0.618 or 1.618. This ratio is commonly referred to as the golden ratio, the golden mean, the divine ratio, the divine proportion, and Phi (ϕ).
Fibonacci ratios are most commonly found at the 0.618 level, or the inverse of 0.618, which is 0.382. Both of these levels regularly act as support or resistance levels when taken from a local swing high or swing low.
Additional multiples can be used as necessary. Other common Fibonacci retracement ratios include 0.5, 0.236, and 0.786. Fibonacci extensions are commonly found at 1.618, 2.272, 4.236, etc. Retracement levels can act as support levels, while extensions can work well as a potential future price target.
What Is The Golden Ratio?
According to Wikipedia, “in mathematics, two quantities are in the golden ratio if their ratio is the same as the ratio of their sum to the larger of the two quantities.”
Although it was early Indian mathematicians that first used the Fibonacci sequence, the golden ratio was first studied by Ancient Greeks due to its common appearance in geometry. The origin of this number can be traced back to Euclid, who called it the “extreme and mean ratio” in his book Elements. It is involved in the rectangle, triangle, pentagon, and the dodecahedron.
Findings suggest that the universe is shaped in the form of a dodecahedron and the golden ratio is found all throughout the universe in and in nature – even in our own solar system. A year on Venus is 225 days, which is roughly the 0.618 Fibonacci ratio of Earth’s cycle. A Mercury year is 87.97 days, and is roughly the 0.236 Fibonacci ratio of the Earth’s cycle.
Professor Jan Boeyens and Professor Francis Thackeray believe it is the missing link that unifies all of science, representing “spontaneous growth patterns,” and can be applied to everything from “physics, chemistry, biology,” and more.
The golden ratio is found all over nature, such as hurricane spiral, the curl of an elephant tusk, in ammonite shells, or in DNA. More importantly to crypto traders, the ratio works in potentially estimating the growth patterns in financial markets.
Ralph Nelson Elliott found the ratios would appear within certain price patterns and is part of the foundation of Elliott Wave Theory. Fibonacci ratios are also an integral part of identifying harmonic chart patterns such as the bat, crab, gartley, or butterfly.

What Is Fibonacci Retracement And Extension?
Because Fibonacci ratios represent growth, they commonly appear in financial markets at price zones of psychological importance and be implemented as part of a crypto trading strategy.
Fibonacci retracement levels work well to locate a zone where a potential reversal might occur, while Fibonacci extensions present a possible price target. Fibonacci trading should be used in conjunction with other technical analysis indicators such as the RSI, MACD, or Stochastic, or to help validate certain geometric and harmonic chart patterns.
How To Use The Fibonacci Retracement Tool?
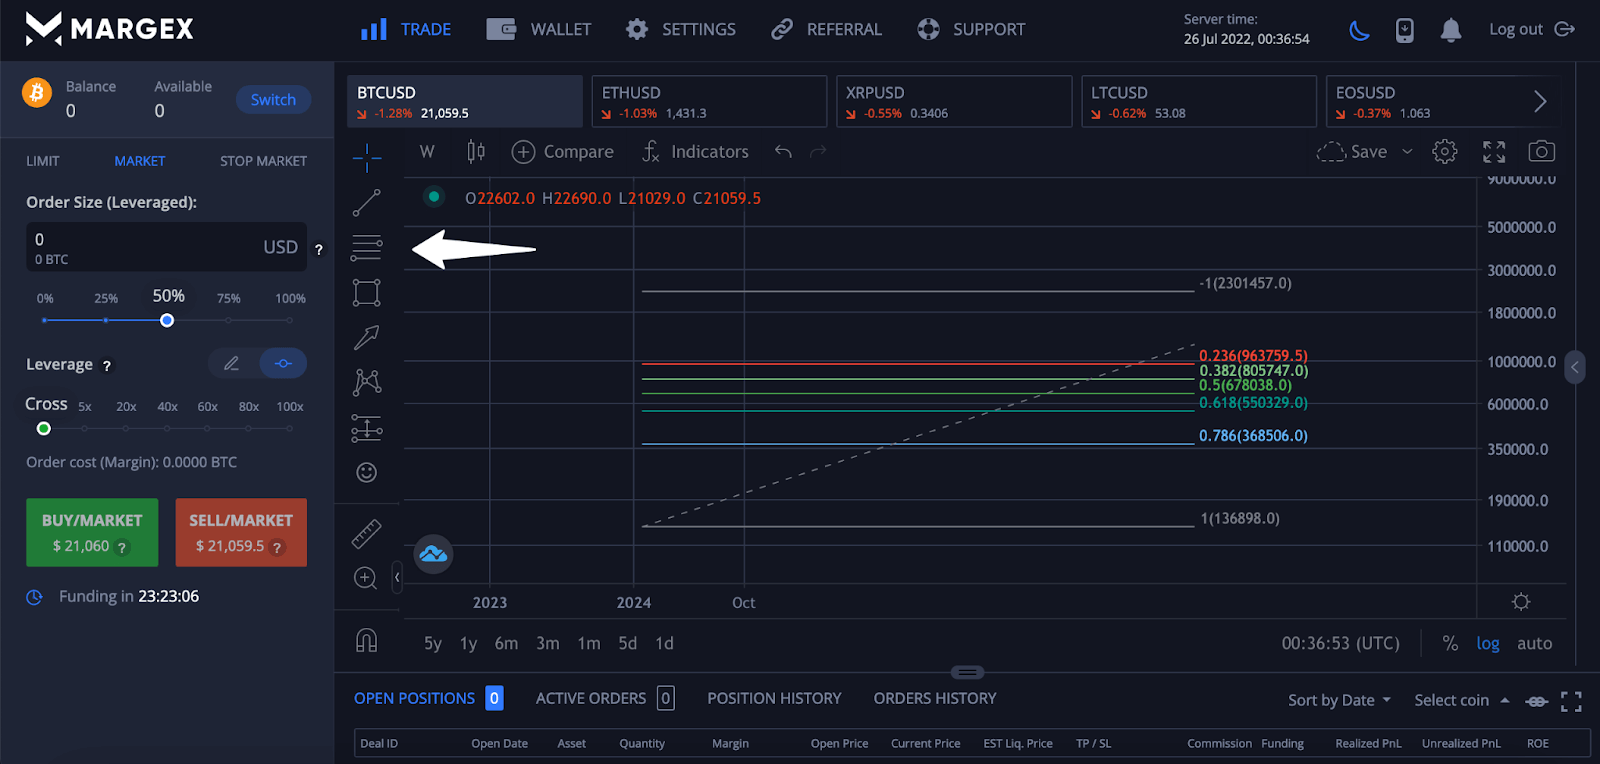
The Fibonacci tool is part of the built-in technical analysis toolset provided by Margex. The tool is used by drawing from trough to peak starting from the low point of a recent downtrend, or from peak to trough starting from the high point of a recent uptrend.
The tool’s settings can be customized further to add or reduce Fibonacci retracement numbers from the number string that projects the ratios as horizontal lines overlaid on top of price action. The below example has removed the price action for greater clarity on how to find the tool and what it looks like when drawn out.
How To Read The Fibonacci Retracement Tool?
Fibonacci crypto trading begins with reading the tool once it has been properly drawn as described above.
Consider each level a psychological support or resistance level after it is drawn. Price action will commonly react to these levels once reached. If broken, a strong reaction typically results due to the abundance of orders at each Fib level.
Key Fibonacci retracement levels to include in the Fibonacci retracement tool settings include 0.618, 0.5, and 0.382. If the price of an asset passes further than 0.5 or 0.618 during a retrace, then it is more likely that a full reversal is underway. An additional level called the golden pocket can be enabled at 0.65.
How To Trade With Cryptocurrency Fibonacci Retracement Levels?
Crypto trading can feel unpredictable, but as a speculative asset class it responds to technical analysis surprisingly well. It also works well with Fibonacci retracement levels, often producing a strong trend reversal at key price zones, and with Fibonacci extensions to find support.
Here are some instructions on how to trade using Fibonacci tools to find support and resistance followed by some examples from the crypto market.
How To Find Fibonacci Retracement Support?
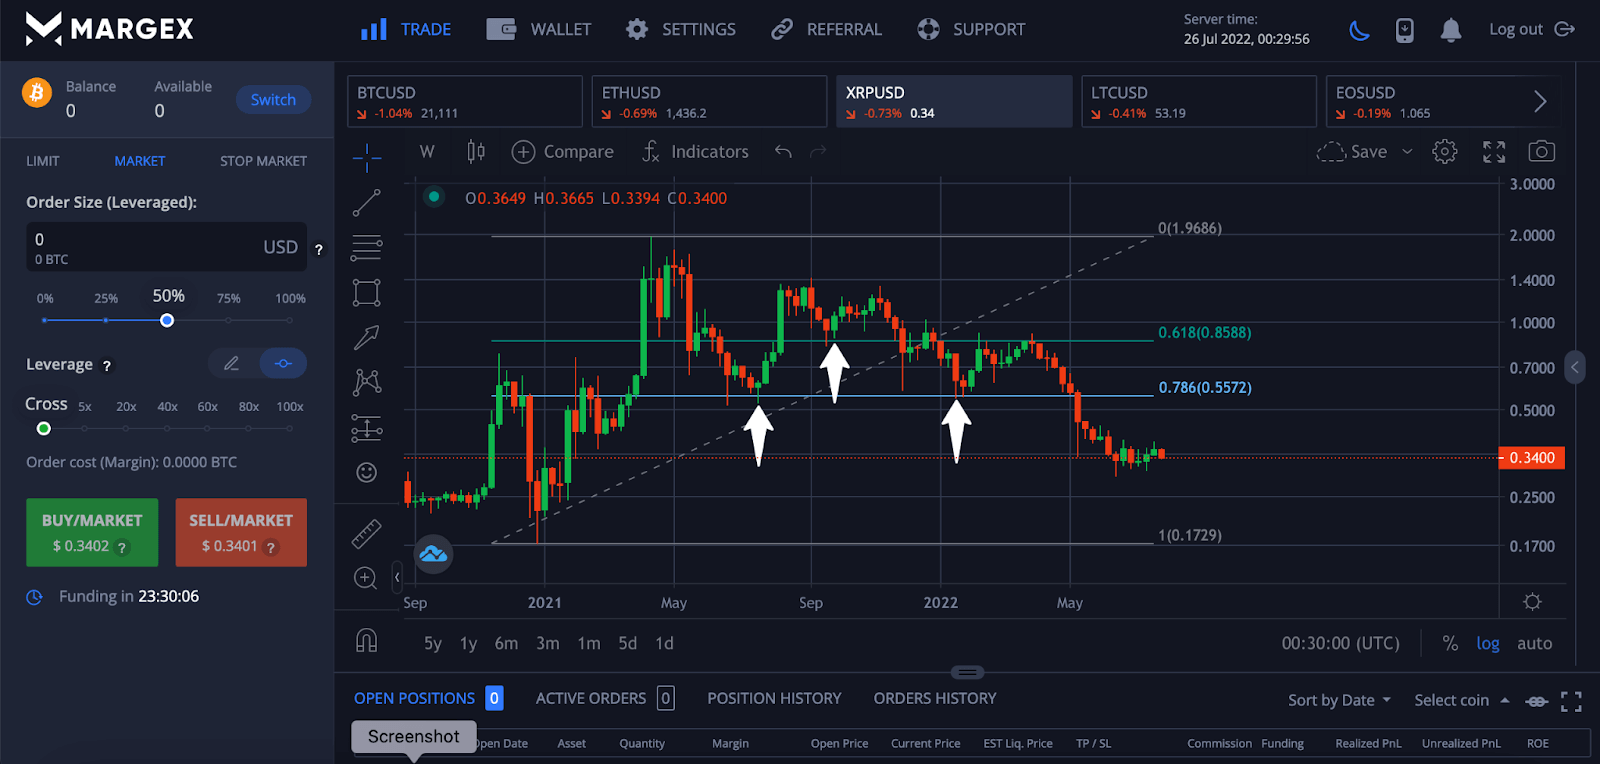
Finding Fibonacci retracement support involves drawing the Fibonacci tool across the price action from the bottom to the top of a completed trend. Price should react and find support at Fibonacci levels.
In the example below, XRPUSD found support at 0.618 and 0.786 temporarily at several pullbacks before eventually losing the levels. Losing each level caused a strong reaction due to the large number of orders in these areas.
How To Find Fibonacci Retracement Resistance?
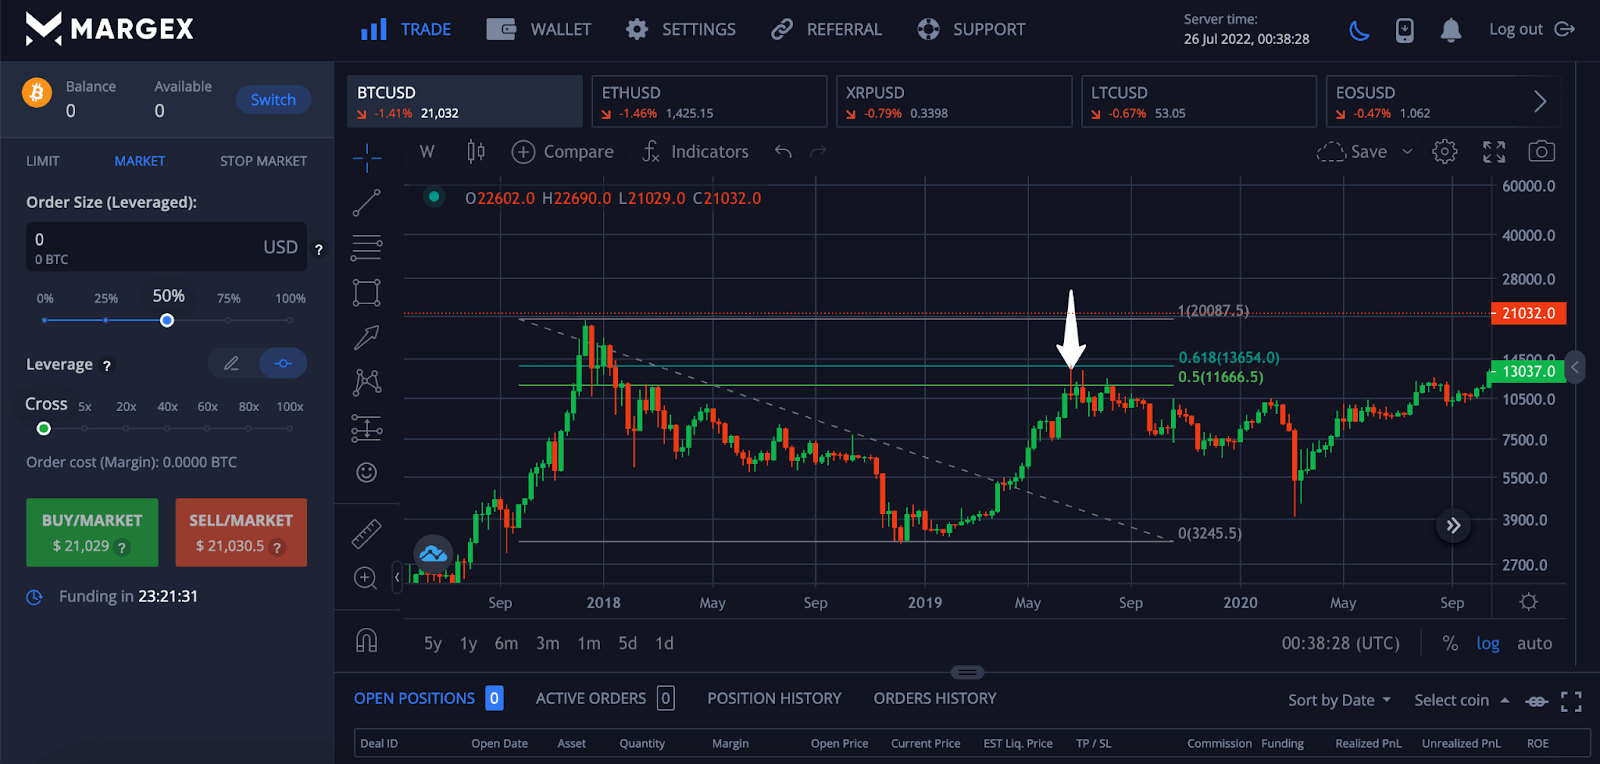
Finding Fibonacci retracement resistance works the same way, but by drawing from the top of a completed trend to the following trough. Resistance lines will be drawn at each key Fibonacci retracement level.
In the example below, BTCUSD stopped precisely at the 0.618 Fib and not a single candlestick closed above the 0.5 level before a reversal started. A market entry at 0.5 with a stop loss placed above the 0.618 level would have been a profitable, low-risk short position.
How To Calculate Fibonacci Retracement And Extension Levels?
Calculating Fibonacci retracement levels and extension levels involves multiplying a total price movement by a Fibonacci ratio.
These numbers include:
0.236, 0.382, 0.500, 0.618, 0.786, 1.272, 1.618, 2.000, 2.272, 2.618, 3.000, 3.618, 4.236
The Formula For Fibonacci Retracement Levels & Extension Levels
In a bullish market, the formulas to calculate Fibonacci retracement and extension levels are:
UR = H - ((H-L) * percentage); and
UE = H + ((H-L) * percentage).
While, the formula for the calculations in a bearish market are:
DR = L + ((H-L) * percentage); and
DE = L - ((H-L) * percentage),
where:
H - High
L - Low
UR - Uptrend Retracement
UE - Uptrend Extension
DR - Downtrend Retracement
DE - Downtrend Extension
Fibonacci Retracement And Extension Examples
To show how crypto Fibonacci retracements and extensions react in real markets, we have highlighted examples using both Bitcoin and Ethereum to demonstrate the effectiveness of these powerful technical analysis and mathematical tools.
ETH Example: Does Ethereum Follow Fibonacci Retracement Levels?
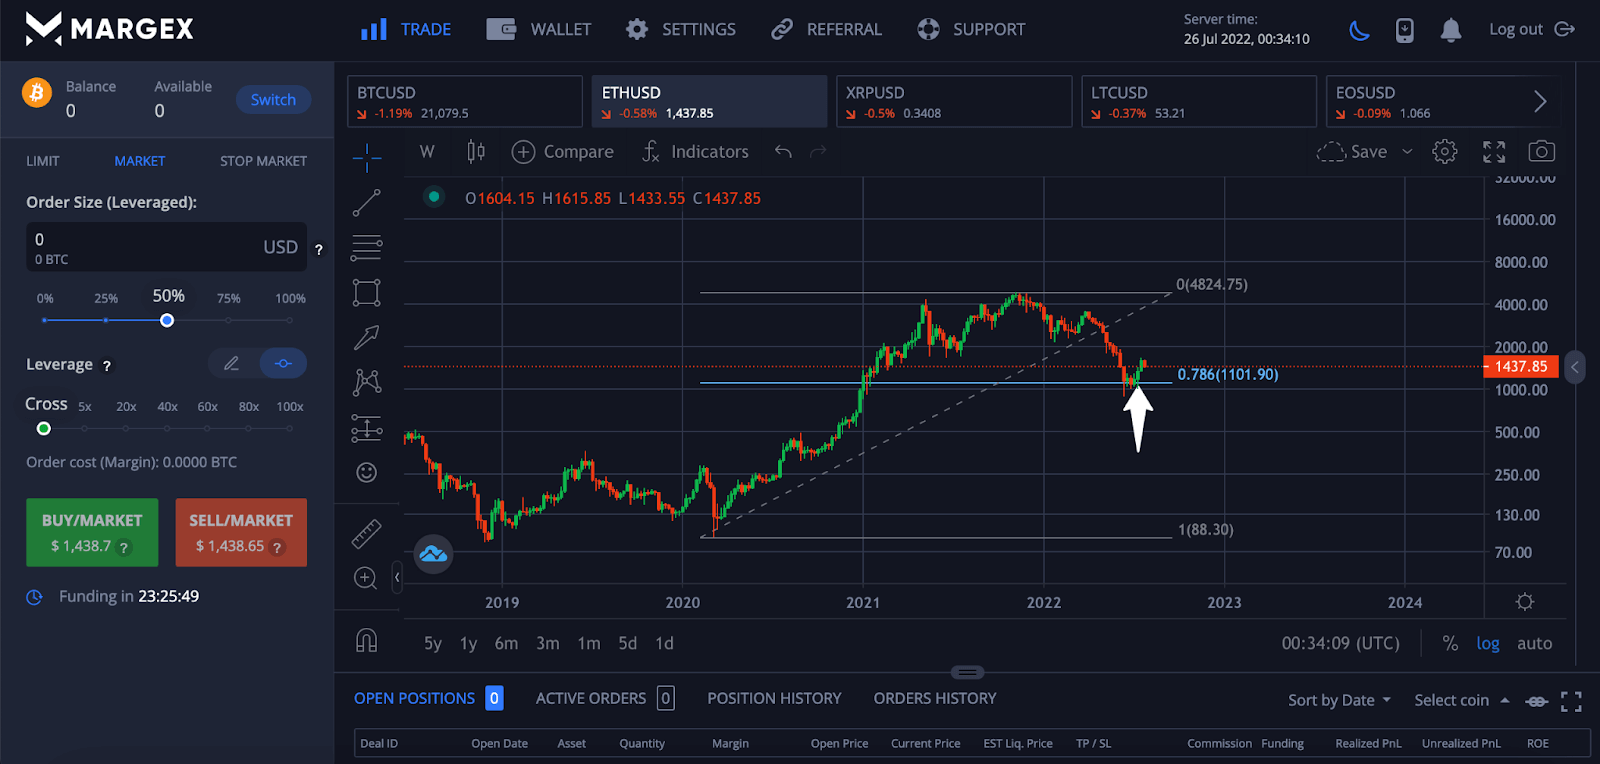
In the below example, weekly ETHUSD levels when taken from the Black Thursday March 2020 low and drawn through the 2021 bull market peak projects support at 0.786 where Ethereum is currently holding.
BTC Example; Does Bitcoin Follow Fibonacci Extension Levels?
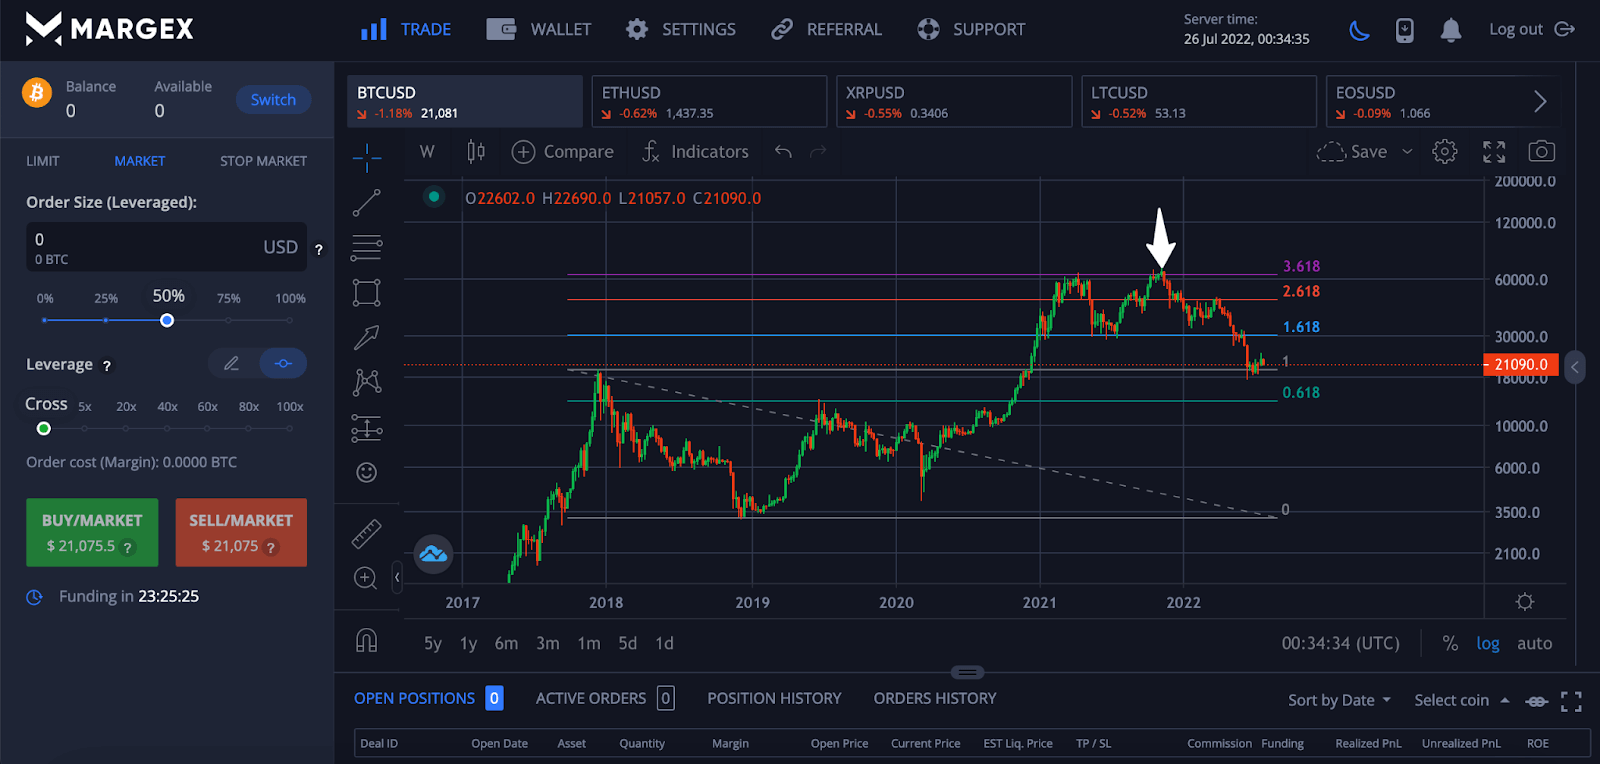
In the below example, weekly BTCUSD levels when taken from the 2017 bull market peak and drawn through the 2018 bear market low, a potential extension target of 3.618 ultimately became the exact top of the next Bitcoin bull market in late 2021.
MACD Example: Combining the Fibonacci Retracement Levels With MACD
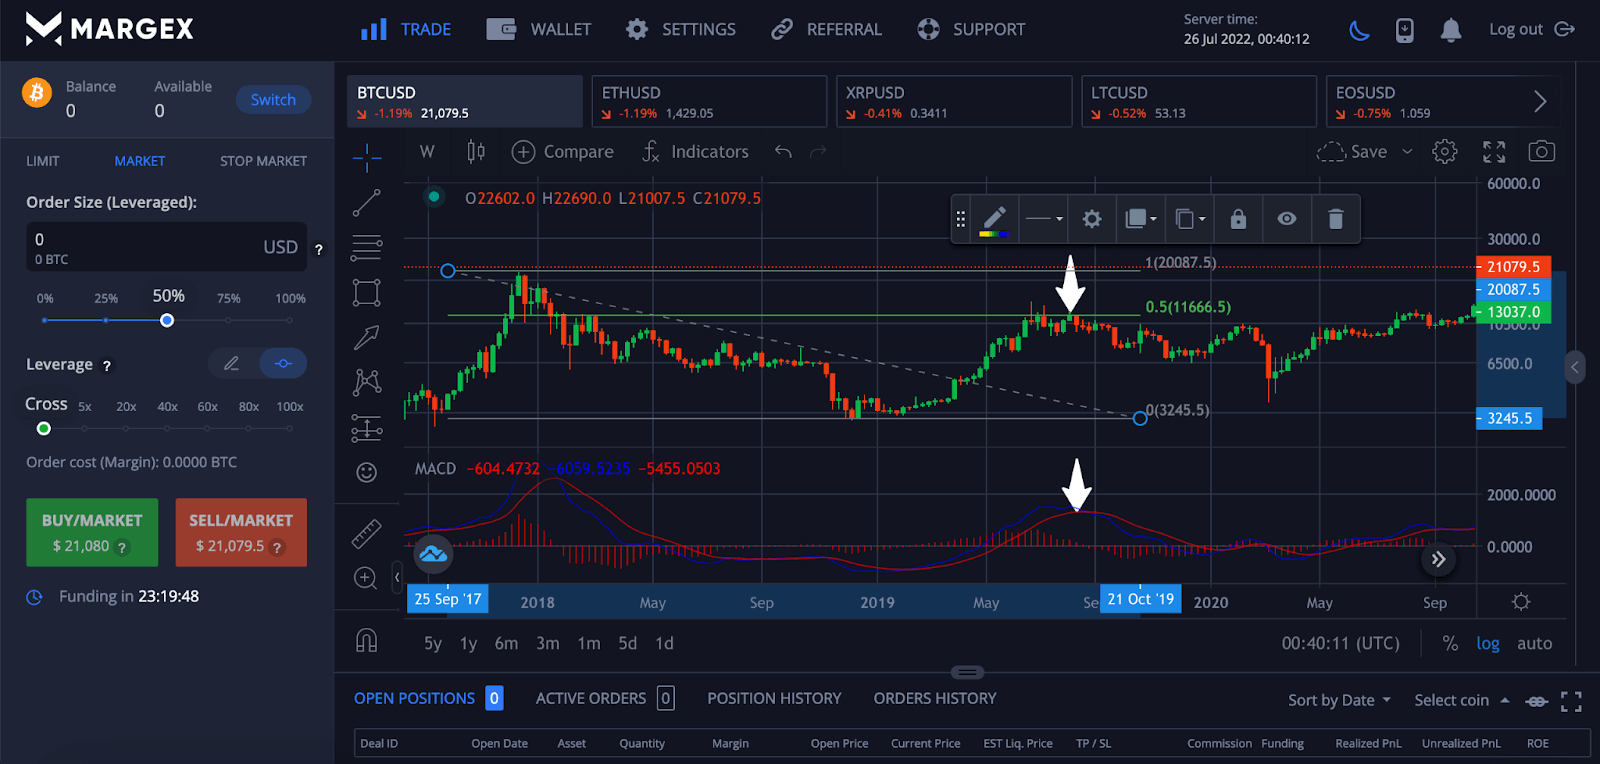
The next example shows how to use Fibonacci retracement tools in conjunction with the MACD indicator. In the example below, Bitcoin price struggled with resistance at 0.5. A sell signal would be generated when price is at Fib resistance and the MACD lines cross bearish.
Relative Strength Index Example: Combining the Fibonacci Retracement Levels With RSI
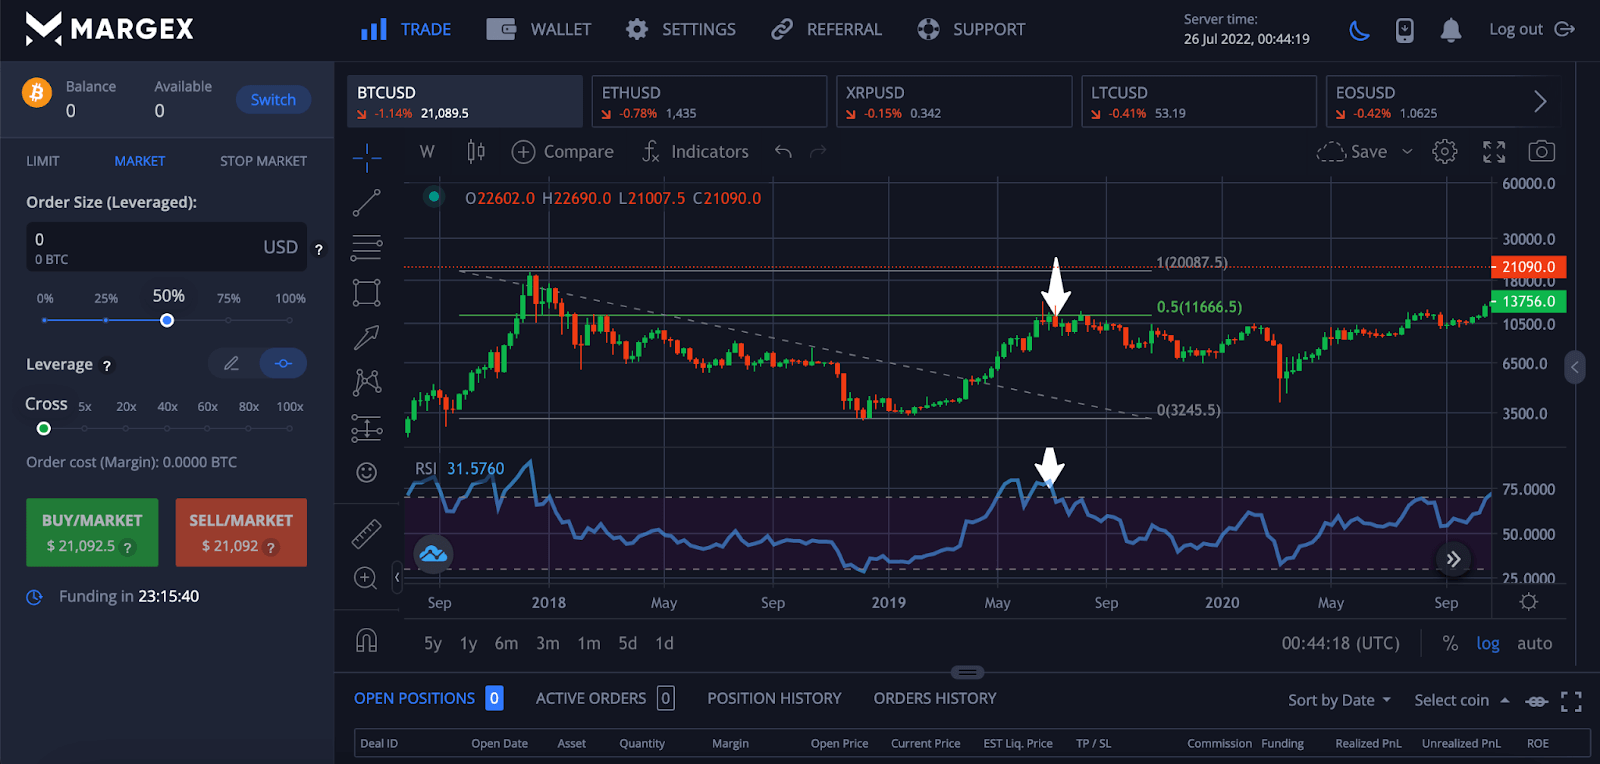
The Relative Strength Index can also be used to confirm sell (or buy) signals in the same manner. In the example below, the same Fib level generated a sell signal when the RSI became oversold and then fell back below 70.
Stochastic RSI Example: Combining the Fibonacci Retracement Levels With Stochastic RSI
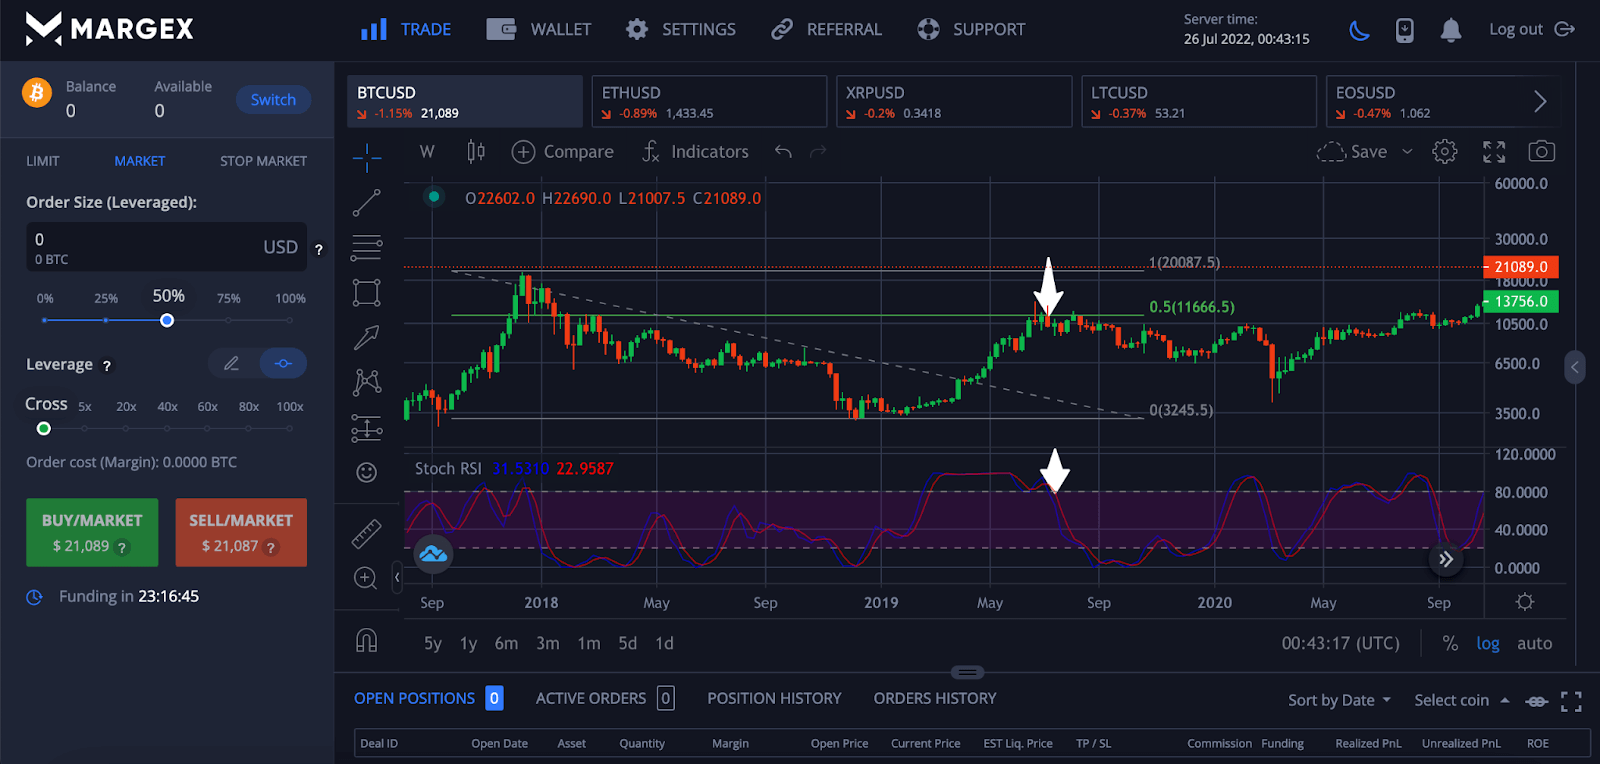
In the below example, yet another sell signal is generated this time when using the Stochastic RSI. When the Stochastic RSI moves from the upper boundary, crosses bearish and reenters below a reading of 70, the setup is completed and a position could be taken.
FAQ
Traders often don’t believe in the power of Fibonacci or are confused by the mathematical formulas based on Fibonacci ratios. Here are some commonly asked questions about Fibonacci retracement and extensions to help clear up any remaining questions.
What is a Fibonacci retracement level in crypto?
Fib crypto trading involves using Fibonacci retracement and extension levels to find support and resistance levels, or areas of interest where reversals may occur. They also can act as potential price targets for new trends.
What are the Fibonacci ratios?
Fibonacci retracement crypto levels include 0.236, 0.382, 0.500, 0.618, and 0.786, while Fibonacci extensions are 1.272, 1.618, 2.000, 2.618, 3.618, etc. Users can customize which Fibonacci levels they want to see using the Fibonacci drawing tool. These numbers are ratios based on the Fibonacci sequence.
What is the Fibonacci number sequence?
The Fibonacci sequence is a series of numbers where the next number in the series is the sum of the previous two numbers. The Fibonacci number sequence is: 0, 1, 1, 2, 3, 5, 8, 13, 21, 34, and so on.
Why are Fibonacci retracement levels important?
Fibonacci cryptocurrency trading can be an effective, low-risk and high profit strategy for trading any asset, but especially cryptocurrencies. Refer to the specific examples above to see how Bitcoin and Ethereum respond to Fibonacci retracement levels. Fibonacci retracement levels are important because they are at psychological and mathematical levels.
How do you draw Fibonacci in crypto?
Fibonacci levels crypto can be drawn using the Fibonacci retracement drawing tool offered for free as part of the suite of Margex technical trading tools. In the settings, users can toggle which Fibonacci retracement or extension levels they want to have visible.
How accurate are Fibonacci retracement levels?
Fibonacci sequence crypto targets are quite accurate due to the fact they are based on important psychological levels or the exponential growth of the price of assets. Fibonacci is used in Elliott Wave Theory, harmonic price patterns, and more to confirm signals, patterns, and possible trend changes.

