
The crypto market has seen some great development over the years compared to its initial stage, where traders and investors only buy and hodl crypto assets and have no good understanding of long or short-term trading strategies. With many aspects of trading coming to the mainstream of the crypto industry, the stock, crypto, indices, and futures have all experience this growth. To better position themselves for the best opportunity that the blockchain industry and financial market as a whole provides, traders need to keep themselves updated regarding the market’s current state and adapt their strategies to fit the market to reduce risk while building on an existing winning streak.
A good trading strategy developed by a trader provides an advantage in the market, trades better with good judgment, and aids in the identification of potential opportunities to build a more robust portfolio. The crypto industry is a big place for a lot of opportunities as traders, investors, and institutional organizations look for ways to leverage the crypto space with razor-sharp trading strategies and other forms of trading to stay at their best.
As cryptocurrencies such as Bitcoin and Ethereum gain popularity in the mainstream media, newcomers flock to exchanges; this leads to more demand to develop good technical analysis strategies with the help of chart patterns and indicators such as stochastic indicator to help spot trend reversals with great profit potential.
In this guide, your knowledge of how to use the fisher transform indicator will be grounded, and you will be able to make a clear application of the Fisher transform using the chart. Learning how to use the Fisher transform indicator will give you more opportunities as a trader to spot trend reversals and trade better while implementing risk management protocols.
What Is the Fisher Transform Indicator?
The Fisher Transform Indicator is a technical indicator used by traders and investors to identify trend reversals or turning prices for Bitcoin (BTC), Ethereum (ETH), and other altcoins while trading in the crypto market. The Fisher Transform was developed to spot extreme price changes in the market and display readouts or outputs with the help of two lines called the Fisher and Trigger line. The readings start from a baseline of 0 and fluctuate upwards to a region of 5 and downwards to a region of -5.
Sometimes, the extremes on the indicator can last for a considerable time until there is a change in direction or trend reversal, with the trend reversal identified with the Fisher and Trigger lines having a crossover after they intersect.
If the price of an altcoin rises in value, the two lines would trend upwards after a crossover, and if an altcoin trends downward in its price, the Fisher and Trigger line will trend downwards in the direction of the altcoin after each intersection and crossover.
Traders who trade based on the Fisher Transform Indicator strategy would look to open long trades for a crypto asset after the two Fisher-Trigger lines intersect and crossover trending to the upside. A short trade setup can be opened if two lines intersect and crossover with a potential price going downwards.
The Fisher Transform Indicator is not 100% accurate. It can be exploited during extreme market conditions like flash news that affects the financial news and fear of uncertainty and doubt (FUD) as these factors lead to extreme price volatility and price action. Combining the Fisher indicator with other lagging indicators will greatly improve your trading result and help manage the risk in trading the financial market. This Fisher indicator is applicable for short-term trades like swing trading. The Fisher Transform looks similar to other indicators, such as the MACD and Stochastic Oscillator, and as such, trading the Fisher Transform with other strategies and chart patterns will lead to more profitability.
Understanding The Fisher Transform Indicator
The Fisher indicator helps traders to the Gaussian normal distribution by converting data in the form of market prices that are not the regular data. In essence, the Fisher Indicator helps traders to better identify price reversals on the chat of a crypto asset.
The Fisher indicator is mostly used by traders looking for early trend reversals rather than lagging indicators. It can be applied to other technical indicators, such as the Relative Strength Index (RSI) and the Moving Average Convergence Divergence. (MACD)
Just as with similar indicators, the Fisher Indicator helps traders to identify areas where there is an intersect closely and crossover of the two Fisher indicator lines called the Fisher and Trigger. Thereby traders spot new trends or trend reversals that can open either long or short positions.
The Fisher Transform has a signal line attached to it. This is the Moving Average of the Fisher Transform value that moves slightly lower than the Fisher Transform line used by traders as a signal for trades. When the Fisher Transform drops below the signal line after rallying to a high, this could be used as a signal to open a short entry position.
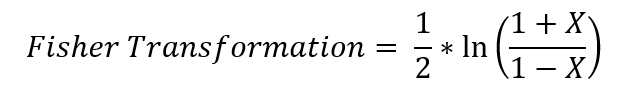
How To Calculate The Fisher Transform
The Fisher Transform uses the Gaussian distribution principle which is a normal distribution over averages in price. Here is the formula for the Fisher Transform.
Sometimes, traders adjust the settings of the Fisher Indicator into something they can relate to, and best fit their trading style and pattern.
You don’t need to learn the Fisher Transform formula; you can always use it from Margex free trading tools if you know its application to your charts.
How To Trade With The Fisher Indicator (Add Examples From Margex)
Margex exchange is a bitcoin-based derivatives platform that allows its users to trade leverage tokens with up to 100X leverage size, and at the same time, the unique staking feature found on the Margex exchange allows traders to stake the same leverage token to earn more. Margex is unique and one of the standout platforms providing leverage trading and staking of the same assets with up to 13% APY return.
Staked assets are not lockup, and staking rewards are sent to your staking balance daily with the help of its automated system, making the unique staking feature seamless. Due to the great user interface of Margex, novice traders can easily use the platform, and you don’t need trading experience to earn from Margex’s unique staking features.
You can also use the indicators on the platform if you are a trader; let’s see how you can apply the Fisher Indicator to your trading and help find early trends to increase your profitability chances.
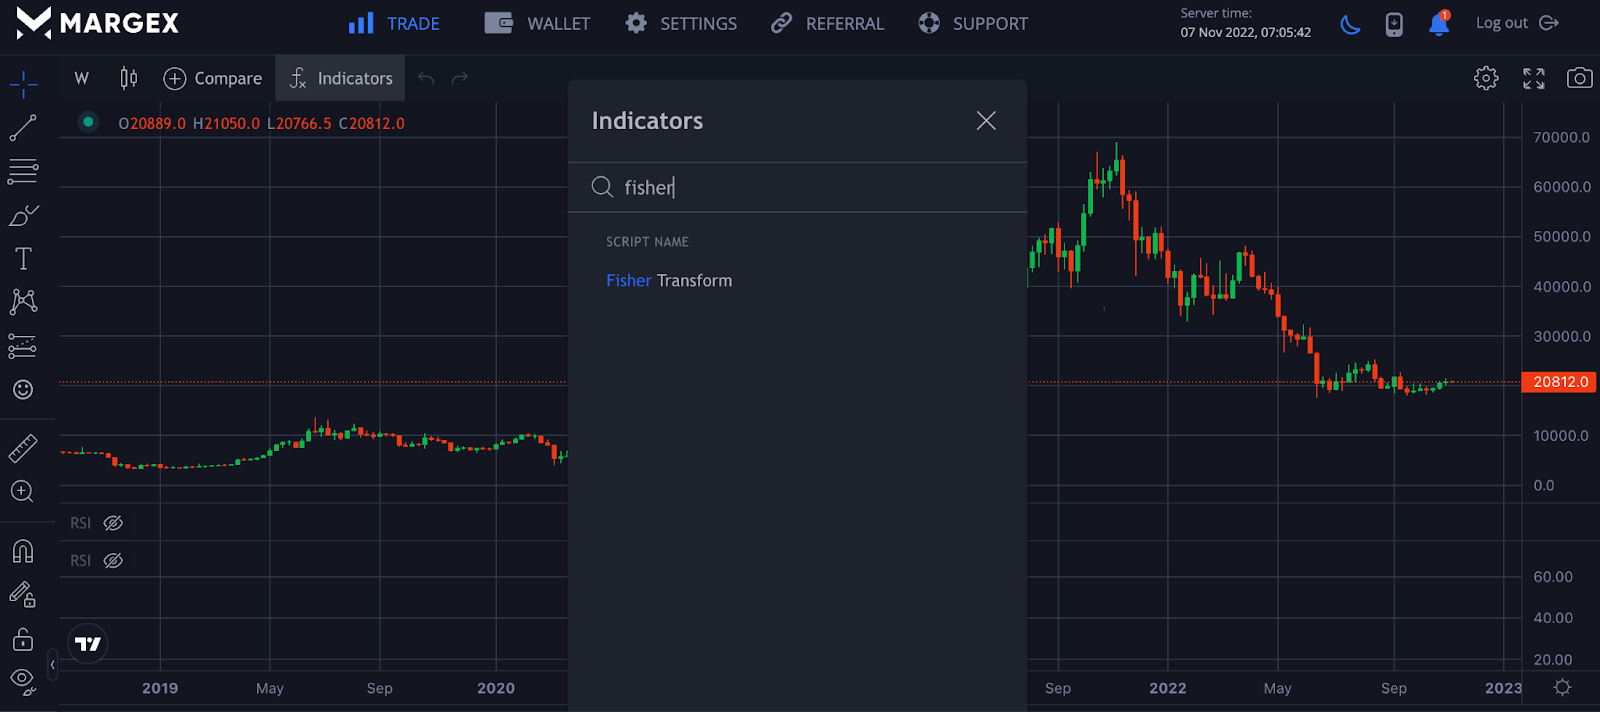
For new users, create an account on the Margex exchange to enable you to use the indicators panel for your technical analysis, while existing users just need to log in to apply the Fisher indicator to their charts. Head over to trade, and click on indicators to search for your preferred indicator, but in this case, we would focus more on the Fisher Indicator.
Using the Fisher Indicator is very easy; applying this indicator requires finding a chart that is either trending in an uptrend or a downtrend. Let’s look at some of these examples.
Bullish Divergence
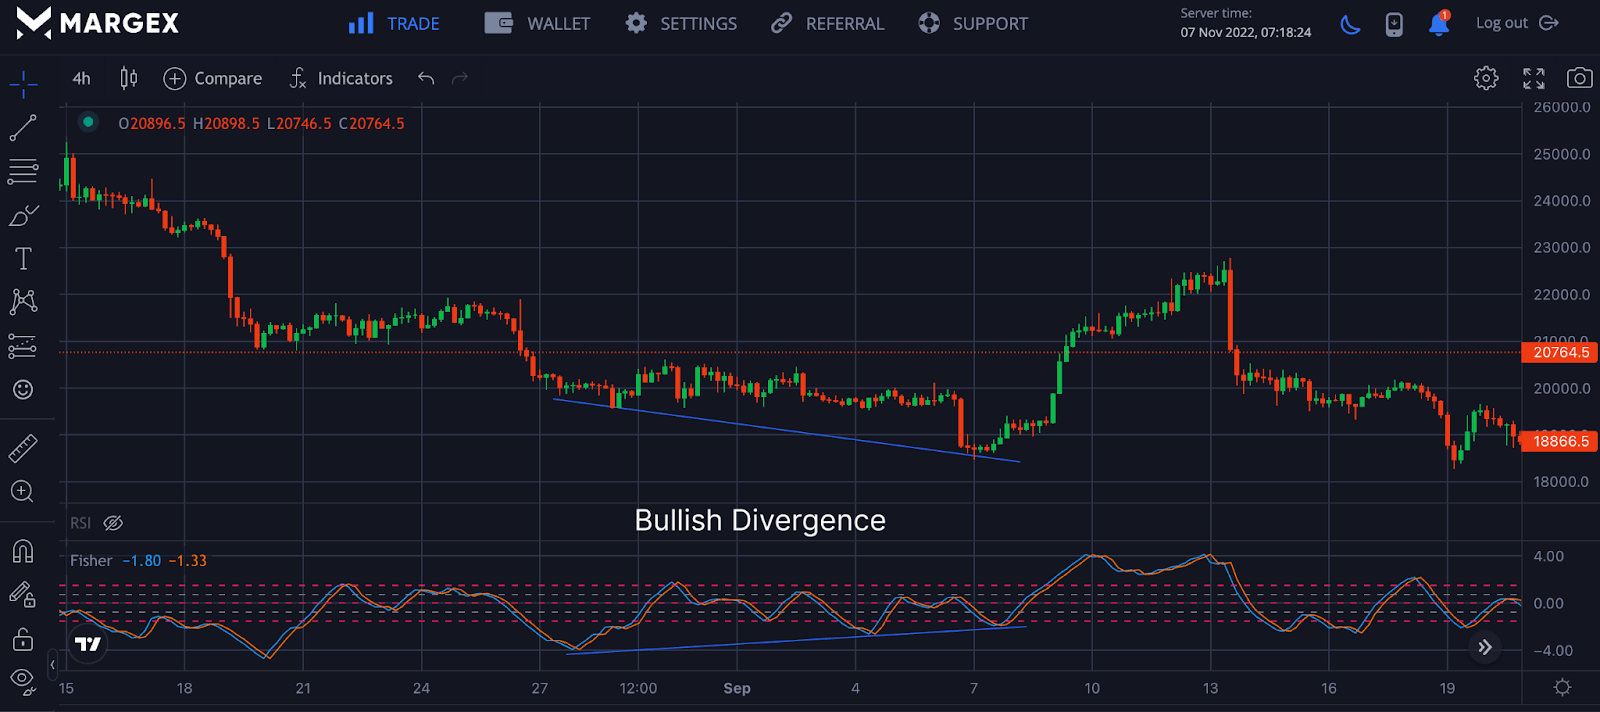
From the Image above, the price of BTCUSD formed a bullish divergence, confirmed by the Fisher Indicator, with a potential trend reversal from bearish to bullish in an upward direction. The intersection and crossover by the Fisher and Trigger lines show a potential trend reversal.
With the price rallying subsequently, the Fisher Indicator also rallied in an upward direction; a trader who spots this potential trend reversal with a bullish divergence chart pattern could look to open a long position as this would be a good entry point for profits.
Fisher Indicator And RSI Indicactor For A Trend Reversal
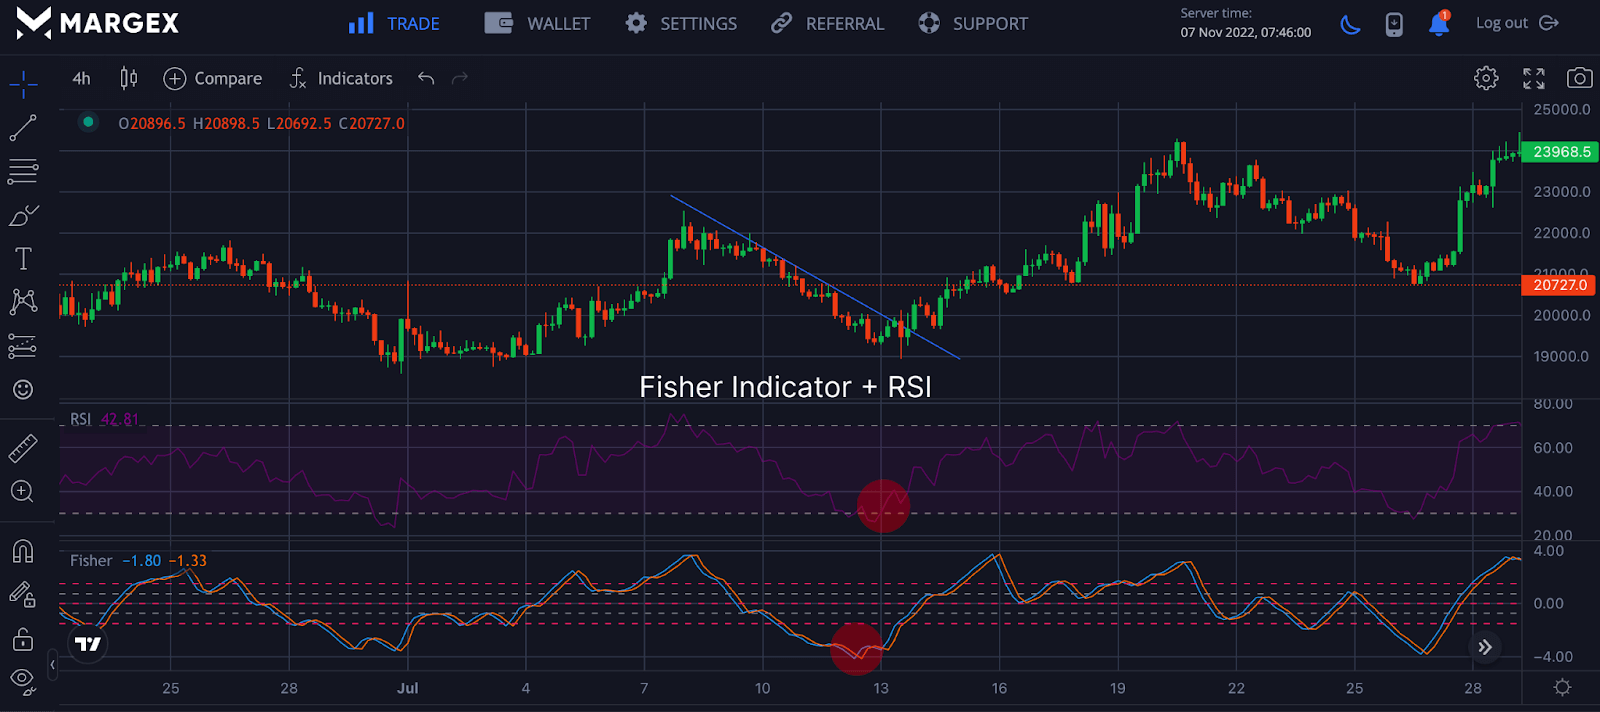
The Fisher Indicator and Relative Strength Index (RSI) can be combined for a more probable setup. From the chart above, a change in trend was imminent, with the price shifting from a bearish to a bullish trend as the Fisher Transform signaled this with the RSI moving from the region of oversold as the price started an uptrend after breaking the resistance trendline.
The Fisher line and Trigger made an intersection with a crossover following through as the price gradually moved from bearish to bullish rally higher.
Combining the Fisher Indicator with other indicators will give a trader a better trading setup and increase the chances of better profitability while managing risk reasonably.
Advantages Of Using Fisher Transform Indicator
The Fisher Transform indicator has two major advantages. The first is that it is relatively simple to use as an indicator for trading cryptocurrency assets, as demonstrated by the examples above. Second, it is relatively simple to combine the indicator with other indicators.
Disadvantages Of Using The Fisher Transform Indicator
The Fisher Transform Indicator should not be used as a solo indicator in trading crypto assets as this indicator is not 100% accurate, can be exposed to extreme market volatility and should be combined with other indicators and chart patterns for better trading results.
Frequently Asked Questions (FAQ) About The Fisher Transform
What Are The Negative Sides Of Fisher Transform
A major disadvantage of the Fisher Transform Indicator is that it may sometimes make unnecessary noise. Therefore it may only be reliable when combined with other indicators like the RSI, MACD, and others. Another disadvantage is that there may be inconsistencies in what qualifies as an extreme reading. This may leave traders confused about when and where to place a trade.
Does The Fisher Transform Indicator Still Work?
Yes, it does. You can use the Fisher transform indicator to spot divergences, crossovers, and trend reversal patterns. You can also combine it with other indicators to yield more accurate results.
Is It Profitable To Use The Fisher Transform Indicator?
If you know how to read the fisher transform and use it to spot entry and exit points, it may yield reasonable profit for you. However, you may need to combine it with other indicators to eliminate false readings. You must also be disciplined and stick to your strategy regardless of emotions.
How Do You Read A Fisher Transform Signal?
The indicator has two lines – the fisher line and the trigger line. Whenever these two lines intersect, that may signal a price reversal pattern. If both lines rise or fall together, it may mean the asset’s price will go up or down in the same direction. This is not a hard and fast rule, though. Other factors may influence the direction of the asset’s price.
What Is The Fisher Transform Formula?
If you are purely interested in the mathematics behind the fisher transform indicator, here is the formula:
Fisher Transform = the natural logarithm of (1+X/1-X)
Where X refers to the price transformation between fixed coordinates.


