
Chart and candlestick patterns come in all kinds of shapes and sizes, and appear across various timeframes. Technical analysts study the performance of what comes after these patterns, in an attempt to confirm their signals and prepare in advance for the expected move that results.
Traders also seek to discover these moves in advance, and use them to profit by taking a position at precise moments that provide the highest risk versus reward setup. Not only do these patterns form under unique conditions, the outcome and results differ from pattern to pattern.
One group of chart patterns, called harmonic patterns, provide particularly reliable signals due to the fact they have specific termination points based on Fibonacci numbers. In this guide, we are examining the harmonic bat pattern and outlining how to trade the bullish and bearish versions of the pattern.
What Is The Harmonic Bat Pattern? Harmonic Patterns Explained
Harmonic trading patterns first originated in the 1930s, introduced by Harold McKinley Gartley, in the book Profits in the Stock Markets. The gartley pattern is named after the four swing price movement labeled as XABCD. Each individual leg and the overall pattern terminate at Fibonacci ratios.
The harmonic bat pattern wasn’t introduced until much later in the early 2000s, by Scott M. Carney in the book Harmonic Trading; Volume One. Carney called the bat pattern “a precise harmonic pattern “ and “probably the most accurate pattern in the entire Harmonic Trading arsenal.
It is the “distinct elements” of the trading pattern that makes identifying a potential reversal point possible. After reaching the potential reversal zone, Scott Carney claims that the pattern results in a sharp and extreme move when valid. Other types of harmonic chart patterns include the crab, shark, butterfly, and AB=CD.

Types Of Harmonic Bat Patterns
As is the case with most chart patterns, harmonic patterns like the bat pattern come in two forms –– with a bullish and bearish variety. Which pattern forms depends on the direction of the overall trend, and consequently, any price action that initiates the pattern near a significant swing high or swing low.
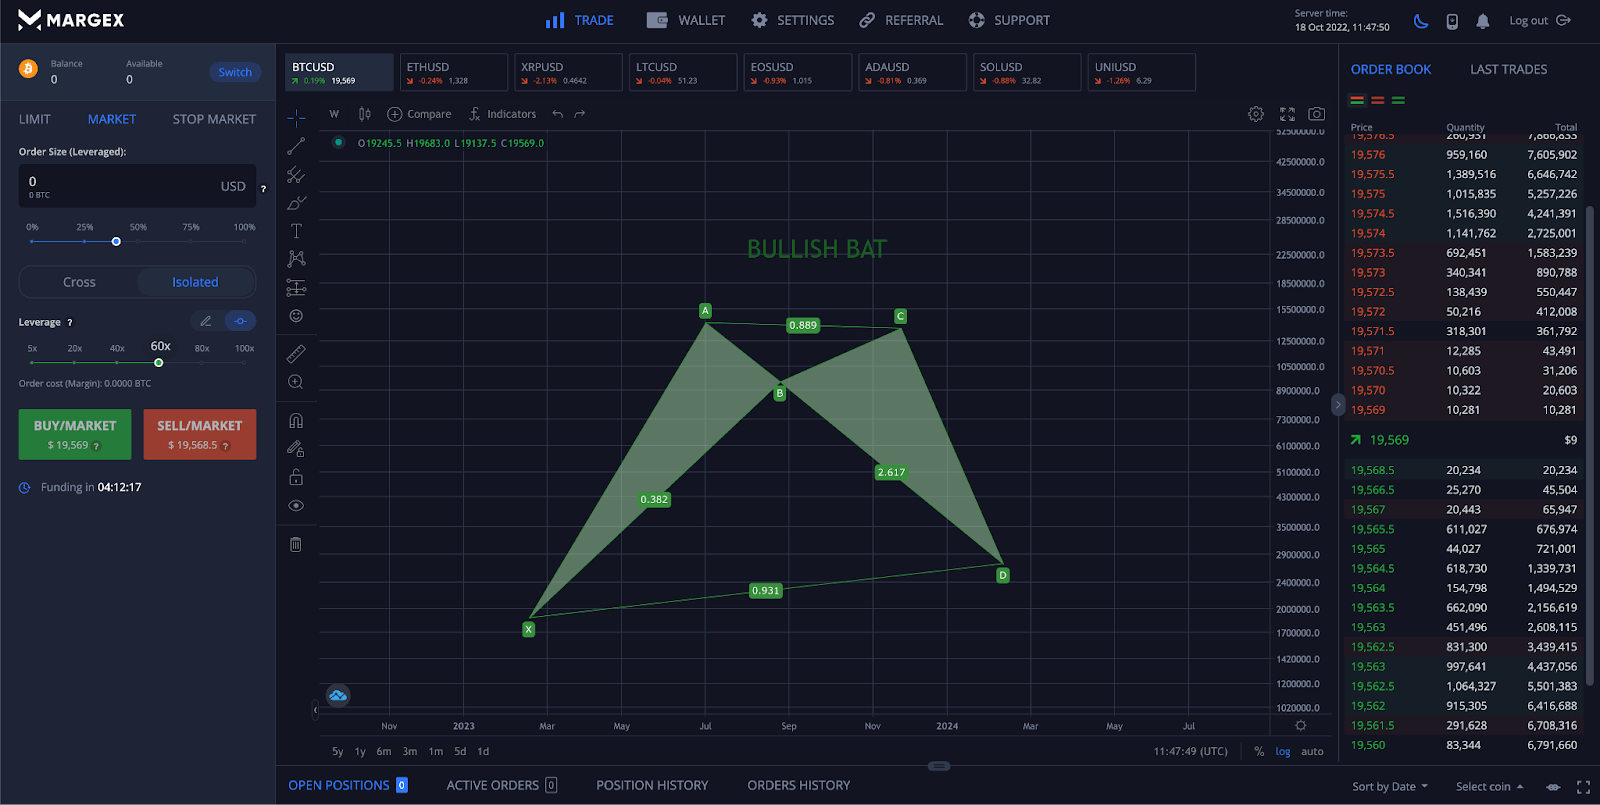
Bullish Bat Pattern
Bullish bat patterns are corrective patterns that occur during an uptrend. A correction of the prevailing trend creates a number of price swings and trading opportunities. However, the bullish bat pattern must follow the precise Fibonacci ratios from above. When the pattern terminates at the D point of the pattern, the pattern ends and price will begin to move again with the prevailing uptrend.
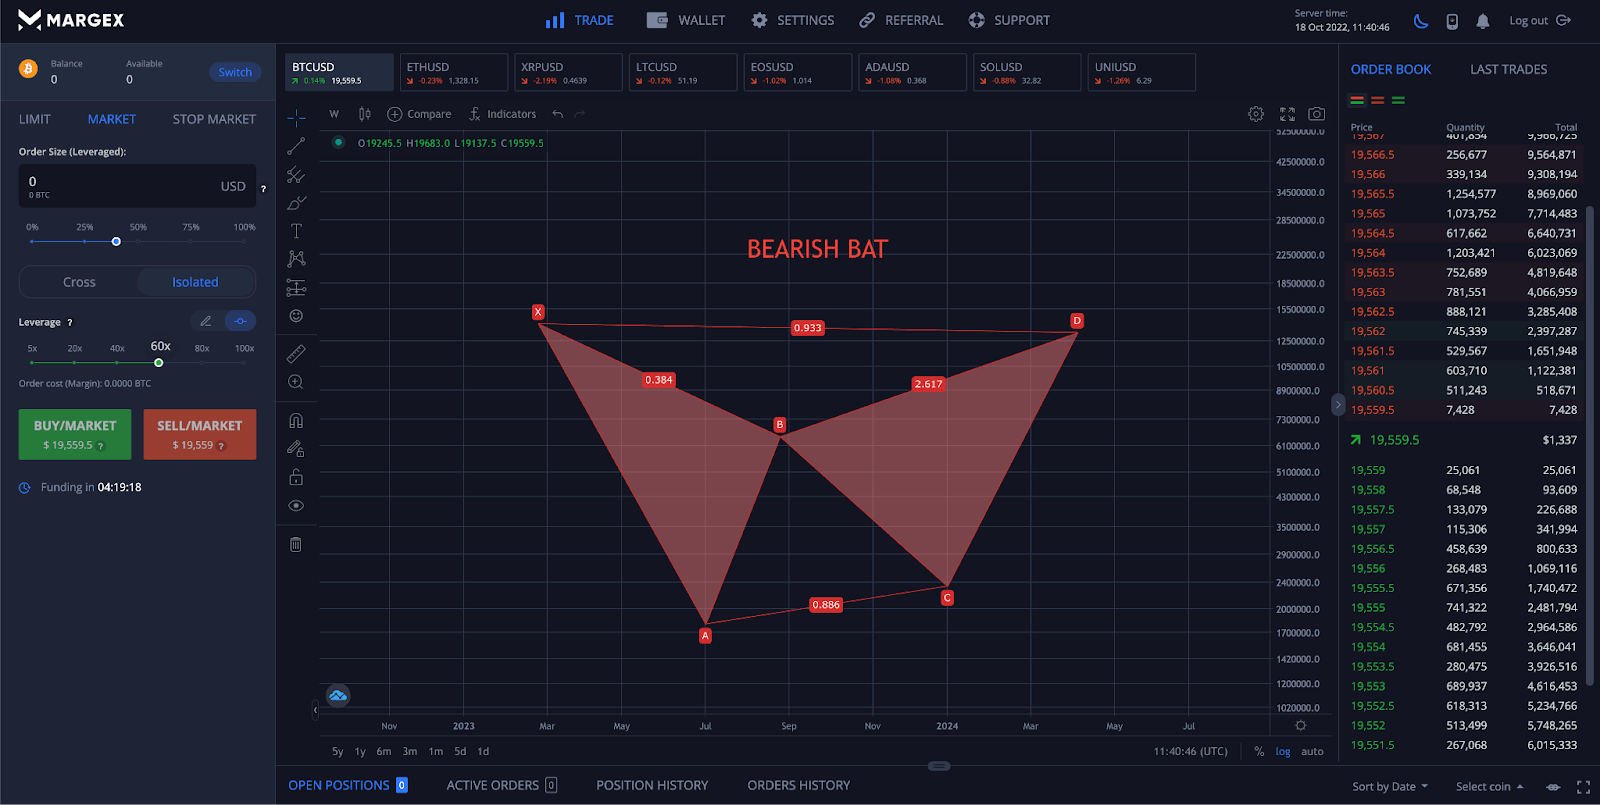
Bearish Bat Pattern
In contrast, bearish bat patterns are corrective patterns that occur during a downtrend. A correction of the prevailing trend creates a number of price swings and trading opportunities. Like the bullish counterpart, the bearish bat pattern must follow the precise Fibonacci ratios from above. When the pattern terminates at the D point of the pattern, the pattern ends and price will begin to move again with the prevailing downtrend.
How To Identify The Harmonic Bat Pattern
The key to properly identifying any harmonic price pattern –– including the bat formation –– is related to how each leg terminates in relation to Fibonacci ratios. If each leg does not at least come close to meeting Fibonacci targets, the pattern is not a valid harmonic pattern. This fact is a key differentiator between harmonic patterns and other types of technical analysis chart patterns. The Fibonacci ratios must be in “harmony” across each leg of the bat structure.
For the bat harmonic pattern, the AB leg should terminate at roughly 0.5 or 0.382 of leg XA. It differs from the gartley as it must be less than 0.618 for the XA leg. Leg BC should terminate roughly 0.886 or 0.382 of the AB leg. The CD leg will terminate at roughly 1.618 or 2.618 of the BC leg. The D leg should result in a measurement that is 0.886 of the XA leg. Once the pattern reaches the furthest Fibonacci targets of the D leg, the trade should be activated. The more accurate the Fibonacci ratios, the higher the likelihood you are dealing with a valid harmonic pattern.
Bearish and bullish bat patterns take on the appearance of a large M or W shape, depending on if they are bullish or bearish. When drawn using the XABCD tool, they can also resemble a bat, hence the name. Since harmonic patterns typically resume the overall trend upon completion, they are considered corrective patterns. Regardless of if the overall structure is bullish or bearish, a bat pattern will adhere to the specific Fibonacci levels outlined above.

Bat Harmonic Versus Gartley Pattern: What Are The Differences?
The bat, gartley, and other harmonic patterns all follow similar Fibonacci ratios. The primary difference between a bat and a gartley pattern is the B leg must terminate below 0.5 for a bat pattern, while a gartley terminates at 0.618. Next, the D leg will terminate at 1.618 or 2.618. A gartley can reach 1.618, also causing some confusion. However, only a gartley will terminate at 1.272, which can assist an analyst with deciphering which pattern is forming.
How To Use The Harmonic Bat Pattern To Spot Bullish And Bearish Reversals
When attempting to find and draw bat harmonic patterns, Fibonacci retracement tools are an essential piece of the trading strategy. Fibonacci extension and retracement levels often act as support or resistance levels and are based on Fibonacci numbers.
Alternatively, trailers can use the XABCD tool, which helps translate Fibonacci retracements and extensions in an easy-to-understand format. With the pattern drawn out, it is simpler for traders to see where to set a stop-loss point, what position size to take, and at what price target to potentially book profit.
The bullish and bearish bat patterns give traders a read on when a trend has taken a pause to correct and when and how to take advantage of the trend when it is ready to resume. It allows traders to avoid all price swings against the trend, and get set up for the most success. In this sense, the bat and other harmonic trading patterns are continuation patterns and not reversal patterns.
According to Scott Carney, the bat pattern requires a smaller stop loss than other patterns due to its accuracy. Otherwise the market strategy is the same as other harmonic patterns. Like any chart pattern, harmonic and otherwise, seek to pair these signals and termination points with technical signals. For example, if the D termination point in a bullish bat happens just as the Relative Strength Index is reaching oversold conditions, then the bullish harmonic pattern is more likely to be valid and produce the expected upward move. The bat pattern can be paired with the Bollinger Bands, Parabolic SAR, Stochastic, and other popular technical indicators.
It is important to know when the pattern is invalidated or is actually a gartley. The D termination point cannot exceed the beginning point at X. The C leg cannot exceed the distance of leg A. Leg B also cannot exceed the start point at X in the XABCD harmonic pattern. Finally, leg B cannot be more than 50% of XA –– if it is 0.618, then it is a gartley pattern.
How To Trade The Bat Harmonic Pattern Using Margex Trading Tools
The Margex trading platform includes powerful technical analysis tools built directly into the platform. This allows traders to properly identify and successfully trade a bat harmonic trading pattern using a variety of trading methods.
Margex includes access to both Fibonacci retracement tools, and the XABCD drawing tool that makes drawing harmonic patterns like the bullish or bearish bat like a breeze.
Here are the steps necessary to trade the pattern
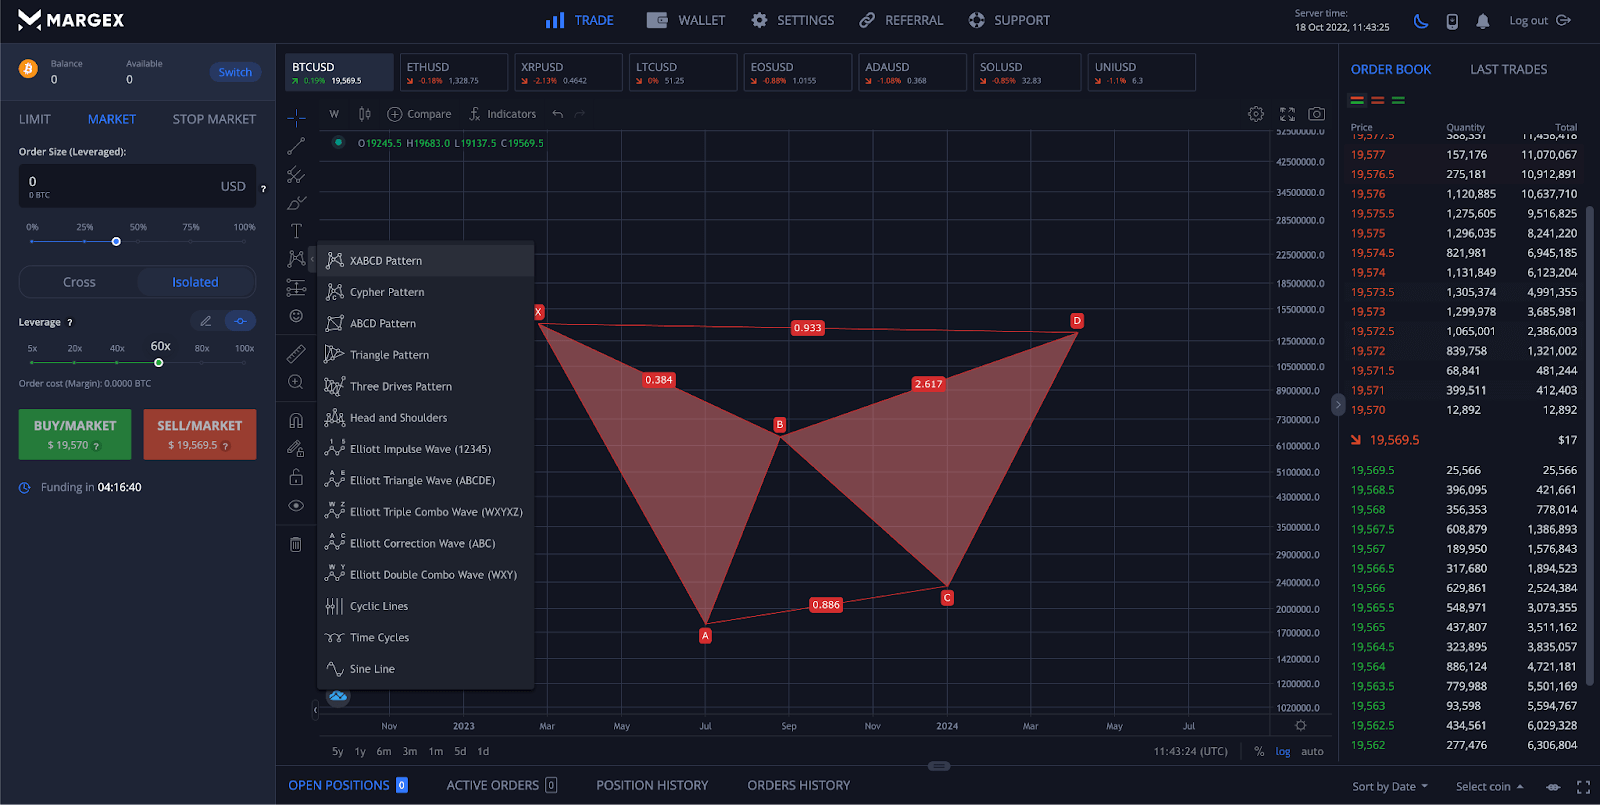
Step 1 – Margex conveniently offers an XABCD drawing tool to make measuring Fibonacci ratios as simple as possible. Using the built-in technical analysis tools, traders can draw out the pattern to properly identify a bullish or bearish bat pattern.
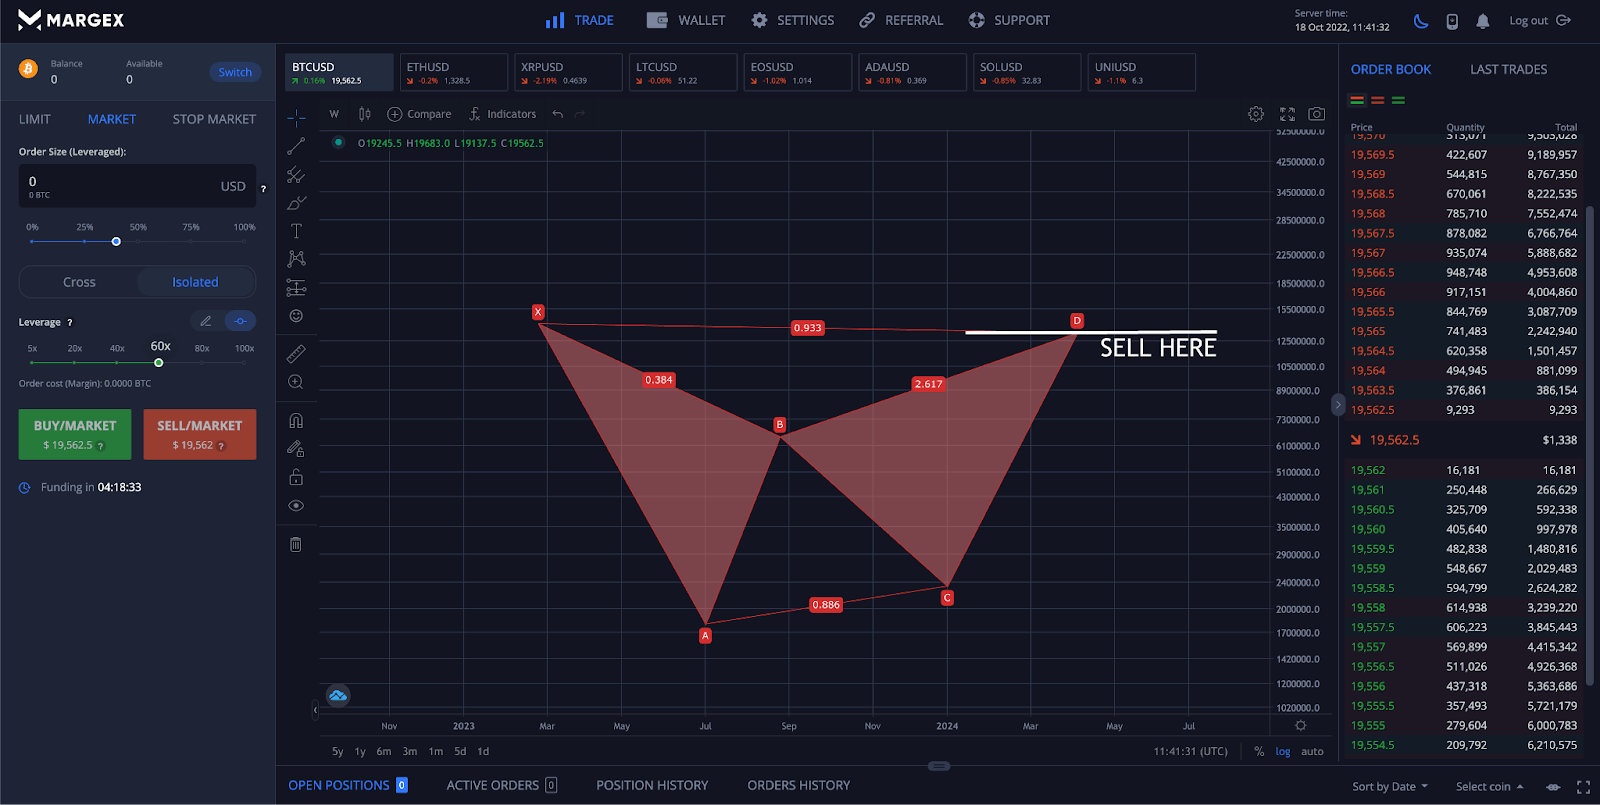
Step 2 – With the pattern properly identified, traders can get prepared with a limit order placed at the termination point of the CD leg at the end of the D point. The CD leg should terminate at the 1.618 or 2.618 Fibonacci extension.
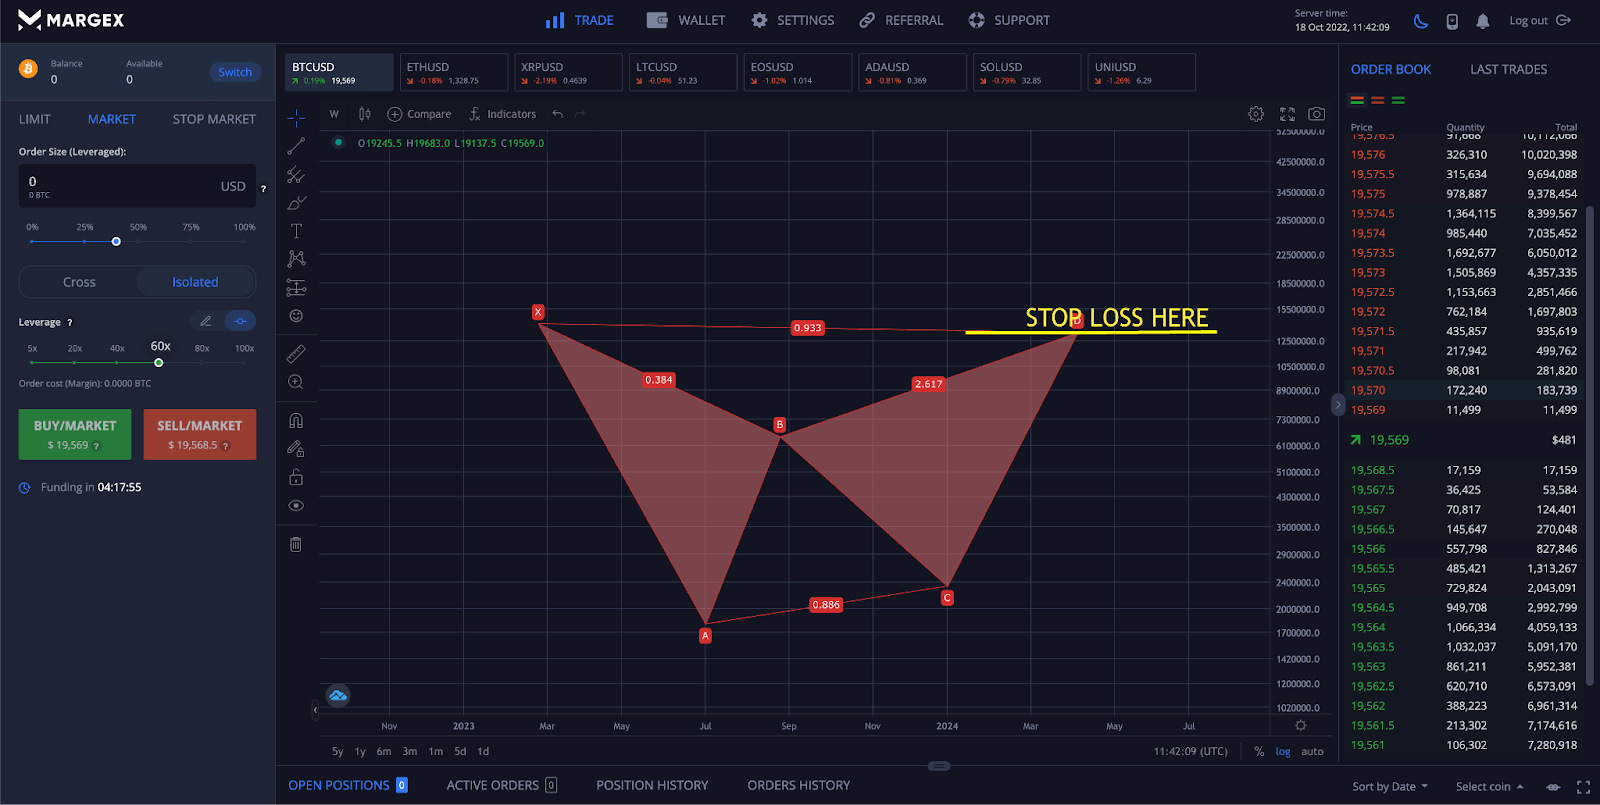
Step 3 – Because the bat gives us the termination point of a CD leg at precise measurements, placing a stop loss above the D point should prevent recurring losing trades and large max drawdowns if the pattern ultimately moves against you.
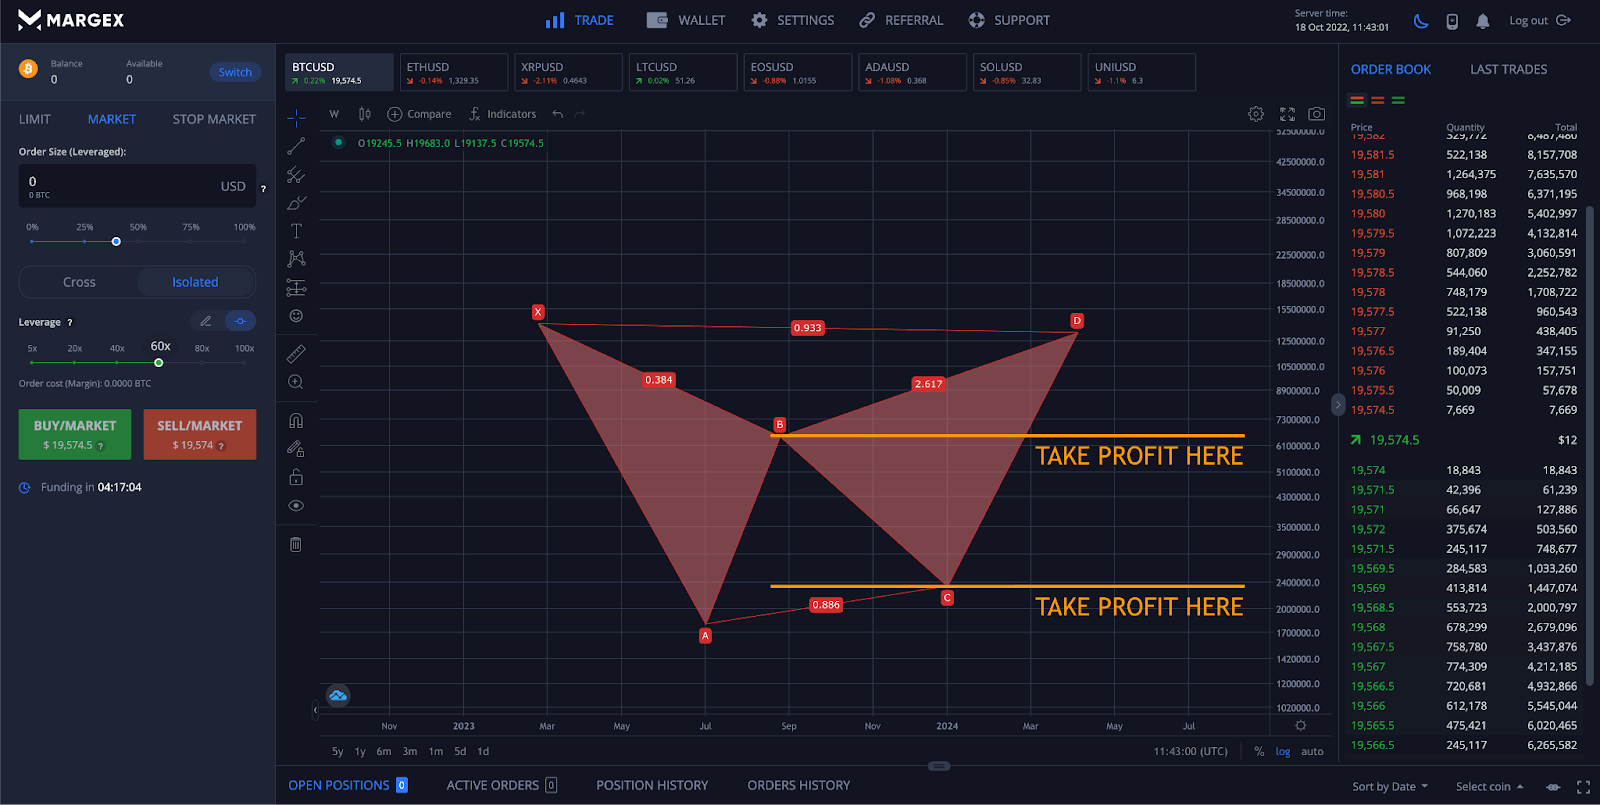
Step 4 – Choose take-profit levels far in advance. Traders can set up a more conservative price target or a more aggressive price target depending on their confidence level in the setup and resulting breakout. In the following section, we outline when to consider taking profit.
Congrats! You have identified and traded the gartley harmonic pattern.
The Advantages Of Using Harmonic Bat Patterns
Harmonic patterns offer specific price targets to make the pattern more accurate to identify and trade. Identifying any chart pattern properly using market analysis can provide an advantage to any trader. In addition to helping know when exactly to take an entry and where to set a stop loss based on the termination point of the end of the pattern, bat patterns also have many take-profit targets based on the various legs of the pattern.
For example, the most conservative take profit target would be the B swing point. The C swing, followed by the A swing would be increasingly aggressive trade targets. Finally, a full extension of AD at 1.618 or 2.618 are the most aggressive targets to consider booking profits at. Be cautious, price action might never get to higher targets, hence the conservative targets at lower levels. Traders can also reduce position sizing at each increasingly more aggressive price target.
Most advantages related to the harmonics stem from the accuracy of the patterns and the extreme, sharp moves that result after reaching the potential reversal zone. Bat patterns also offer another advantage in that there is tighter stop loss placement than necessary with other harmonic patterns.
The Disadvantages Of Using Harmonic Bat Patterns
Nearly all disadvantages of the bat pattern and other harmonics are due to misidentification. Unless Fibonacci retracement and extension levels are met across each leg, the pattern might not be valid. Traders could waste time in the market anticipating a move that never arrives, or results in a loss despite what appeared to be an accurate pattern. Proper stop loss placement is a must when taking any trade.
The bat pattern is also commonly confused for the gartley and other harmonic patterns. Be sure to study the specific measurements of each type of harmonic pattern and the unique measurements across each leg.
FAQ
What is the harmonic bat pattern?
The harmonic pattern is a corrective pattern that pauses a primary trend prior to strong continuation. It presents four internal price swings and trading opportunities. However, trading the pattern effectively is more about properly identifying the pattern, which first requires all legs to complete to validate the pattern.
Why is it called a bat harmonic?
It isn’t clear why it is called a bat pattern. The original harmonic pattern was named the gartley pattern, after H.M. Gartley. All harmonic patterns discovered after were named after various animals, like the bat pattern. Harmonic patterns are called such due to each leg of the pattern being in specific harmony with one another.
Is the harmonic trading pattern profitable?
Scott Carney who first introduced the bat pattern as an alternative to the gartley claims that the bat pattern is the most accurate and reliable of all harmonic trading patterns. Due to the accuracy, the pattern can be extremely profitable as a large price movement follows after the price reversal zone is reached.
How accurate is the harmonic bat pattern?
If the technical analyst who first introduced the pattern is to be believed, it is the most precise and accurate of all harmonic patterns. Its accuracy is contingent upon all Fibonacci ratios being met properly across each of the legs within the harmonic chart pattern. The closer the Fibonacci targets are met, the higher the likelihood the pattern is valid.
What are some other harmonic trading patterns?
Other common harmonic chart patterns include the bat pattern, butterfly pattern, shark pattern, crab pattern, gartley pattern, three drives pattern, five drives pattern, and A-B = C-D patterns. All harmonic chart patterns involve Fibonacci retracement and extension levels to some degree.
What are Fibonacci ratios?
Fibonacci retracement crypto levels include 0.236, 0.382, 0.500, 0.618, and 0.786, while Fibonacci extensions are 1.272, 1.618, 2.000, 2.618, 3.618, etc. Users can customize which Fibonacci levels they want to see using the Fibonacci drawing tool. These numbers are ratios based on the Fibonacci sequence.


