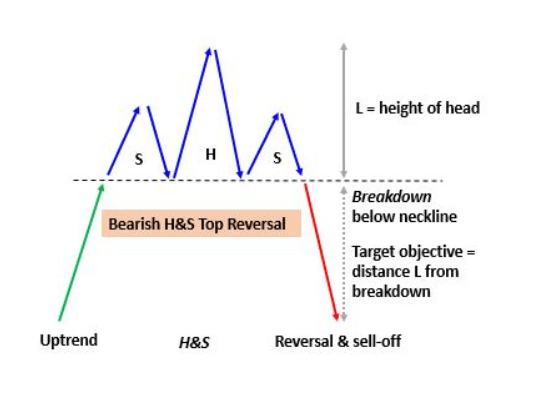
Technical analysis patterns come in various shapes and sizes. Each follows a particular set of guidelines as it develops, or else the pattern might not be valid. The large amount of patterns also means a ton of variance in the results produced if the pattern is confirmed.
In addition to the large variety of chart patterns out there, many patterns come in two forms: a bullish, or a bearish version. Certain patterns, such as triangles, include a neutral form of the pattern. In this in-depth training guide, we’ll teach you how to identify and how to trade the inverse head and shoulders pattern using Margex trading and technical analysis tools.
What Is An Inverse Head And Shoulders Chart Pattern? Inverted Head And Shoulders Patterns Explained
The inverse head and shoulders, or inverse H&S for short, is essentially an upside down head and shoulders pattern. Like the bearish head and shoulders pattern it is named after, the inverse head and shoulders pattern is a powerful bullish trend reversal pattern.
Is An Inverse Head And Shoulders Pattern Bullish Or Bearish?
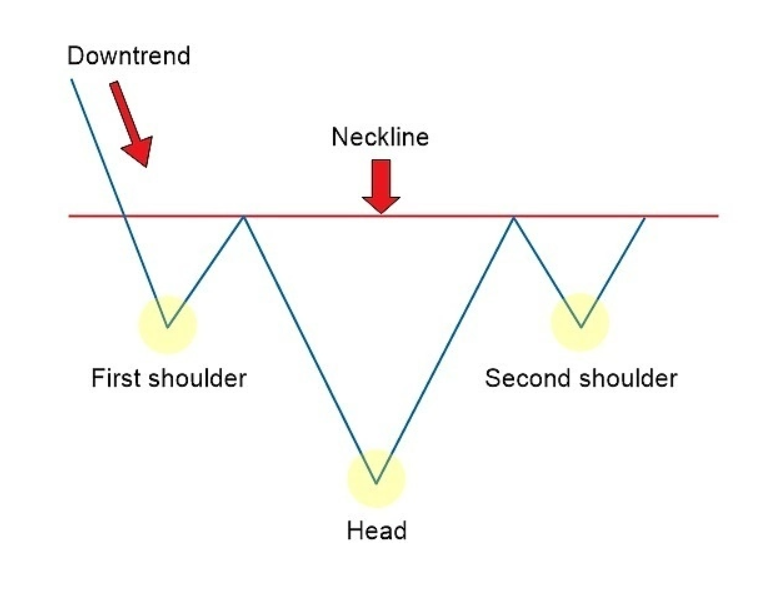
As explained, the standard head and shoulders is a bearish trend reversal pattern in uptrends, therefore, the reverse head and shoulders pattern is a bullish reversal in downtrends. Unlike the regular version of the pattern which occurs as a market top, an inverse head and shoulders pattern forms at the market bottom before the reversal of a downward trend.

An initial trough is formed, creating the first shoulder, which then rises back to neckline market resistance. This left shoulder retracement high and resistance line creates the neckline. The neckline is a key characteristic of an inverse head and shoulders pattern.
A deeper, second trough forms the head, before another price rally brings the high of the second retracement back to the resistance of the neckline.
Finally, a second shoulder forms on the right-side of the pattern roughly equal to the height of the first shoulder. The right shoulder is arguably the most important part of the pattern, as it is what provides a break of the neckline and buying opportunity.
What Does The Inverse Head-And-Shoulders Pattern Tell The Market?
An inverse head and shoulders pattern is the point in the market in which new support has been formed, the trend is likely to reverse, and should soon move upward. The up and down price action has led to exhaustion of the prevailing trend.
Once this key support is confirmed with a break of the neckline, traders can establish an entry price where they would like to execute a buy order. A stop order would be placed below the neckline in case the market continues to retrace and moves against the position. This would also invalidate the pattern.
How To Identify An Inverse Head And Shoulders Pattern Reversal? Inverse Head And Shoulders Pattern Rules And Guidelines
The inverse head and shoulders pattern is among the easiest to recognize and identify properly. The inverse head and shoulders is the bullish head and shoulders pattern and sometimes referred to as a head and shoulders bottom formation.
- Price must be trending downward leading to the formation of the chart pattern.
- The shape of the pattern appears similar to a head between two shoulders only upside-down. The head is the low point in the three-trough pattern, with each shoulder being smaller than the head.
- The two shoulders should be roughly the same depth and have similar structure.
- Volume trends downward during the formation of the pattern, but increases during the right shoulder.
- The neckline is a resistance level drawn between the “armpits” of the shoulders.
- The pattern is confirmed after price makes a decisive close above the neckline.
- Prices pullback to the neckline resistance to confirm it as support the majority of the time (up to 68%).
- Traders can also open a long position after a retest of the neckline is completed.
Inverse Head And Shoulders Chart Pattern Example In Crypto Trading
Here is an example of an inverse head and shoulders chart pattern using the Margex trading platform’s built-in technical analysis tools:
What Is A Neckline In An Inverse Head And Shoulders Chart Pattern And How To Identify It?
The neckline is the most important aspect of the head and shoulders pattern or the inverted head and shoulders pattern. The neckline acts as critical horizontal support or resistance that braces the chart pattern as it develops and acts as the confirmation line to tell the market the pattern has completed.

In the inverse head and shoulders chart pattern, the neckline is a trendline drawn across two peaks at resistance, in the area that would be considered the pattern’s “armpits.” The neckline is used as part of an entry strategy with a high reward-to-risk ratio, where an entry point for a long position would be established with a broken neckline and a candle close outside of the pattern. Once confirmed, an extended move is possible from the breakout price level.
A key takeaway is for traders to wait for a pullback to retest the neckline to avoid a possible false break. It is important to set a stop-loss order for this reason. Returning back beyond the neckline would invalidate the pattern.
How To Find An Inverse Head And Shoulders Target? The Measure Rule Explained
To recap, the inverse head and shoulders pattern can reliably provide a predictable profit target based on a measured move. To find the measured objective, measure from the swing low of the pattern to the neckline.
Next, take that amount and multiply it by 71% (the measured objective target) and subtract the difference from the distance between the head and the height of the pattern at the neckline. Project the results above the point where price breaks up from the neckline to find the possible price target.
Alternatively, traders can combine the inverse head and shoulders pattern with various momentum indicators to get further confirmation of a possible trend reversal.
How To Trade A Head And Shoulders Chart Pattern With Margex Margin Trading
The innovative Margex digital asset margin trading platform offers long and short positions with up to 100x leverage, and built-in charting tools. The platform also includes access to powerful technical indicators like the Relative Strength Index, Bollinger Bands, Ichimoku Cloud, and the Stochastic RSI.
Using the built-in technical analysis tools provided by Margex, the following steps will walk you through trading the inverse head and shoulders pattern like a pro:

Step 1 – Open up the Bitcoin (BTC) price chart and scan the market for any possible inverse head and shoulders patterns. Utilize the drawing tool to properly identify the pattern and draw it out on the chart.
Step 2 – Wait patiently for the inverse head and shoulders pattern breakout and confirm with a close above the neckline on high volume in the right shoulder. Alternatively, bull traders can wait for a pullback to the neckline to go short.
Step 3 – Place a stop loss order above the trough of the right shoulder or above the trough of the head for more wiggle room on your stop loss. Where you place your stop loss should be defined by your risk management strategy and position sizing.
Step 4 – Measure the target of the pattern, and wait patiently for price to reach the projected target. Consider setting a more conservative price target in case the measured objective isn’t reached. Using Margex, orders executive at the price level you want fast, and without slippage.
Inverse Head And Shoulders Chart Pattern FAQ: Commonly Asked Questions About Head And Shoulders Pattern Trading
The inverse head and shoulders pattern is a popular technical formation that is easy to identify. Trading the inverse head and shoulders pattern is rarely confusing.

However, in an attempt to clear up any remaining confusion for traders, we’ve prepared this FAQ on inverse head and shoulders patterns.
FAQ
What is an inverse head and shoulders meaning?
An inverse head and shoulders is simply an upside down head and shoulders pattern that signals a potential market reversal ahead. The pattern is called an inverse head and shoulders because it forms in the shape of two shoulders with a head in between. The only difference between an inverse head and shoulders and a standard head and shoulders, is the fact that the pattern is upside down and is bullish instead of bearish.
Is reverse head and shoulders bullish?
The inverse head and shoulders pattern is the bullish counterpart to the head and shoulders pattern. It tells the market that support has formed, and after a tug of war between bears and bulls, bulls ultimately win and the market will reverse upward.
How reliable is an inverse head and shoulders pattern?
The inverse head and shoulders is among the more reliable chart patterns, both because it is easy to identify and therefore many traders participate in the pattern, but also because it produces accurate signals and measurable profit targets.
What happens after the inverse head and shoulders pattern completes?
After the inverse head and shoulders pattern is confirmed with a breakout above the neckline, the market will sometimes pull back to retest the neckline as resistance turned support. After the retest, or if one doesn’t occur, the market will experience a price rally to the measured price objective based on the height of the pattern.
When is an inverse head and shoulders pattern invalidated?
An inverse head and shoulders pattern is invalidated if price action returns back within the neckline and begins to move deeper into the right shoulder territory. If this happens, traders might want to consider cutting losses early otherwise a stop loss placed below the right shoulder which would traditionally protect traders from loss, could get stopped out.
How to increase the chances of success with inverse head and shoulders trading?
Traders can increase the chances of success when trading any pattern by looking for additional confirmation of the movement using technical indicators or trading volume. The inverse head and shoulders can be combined with tools like the Relative Strength Index, Bollinger Bands, Ichimoku Cloud, and the Stochastic RSI. Margex offers access to all these tools and more for free as part of the full suite of professional trading tools.


