
The long-legged doji is a one candle pattern in Japanese candlestick charting that signals a potential exhaustion of the pre-existing trend. It is a long legged candlestick that has long wicks on both the top and bottom, and a small body that is located in the middle of the candle’s range. Often, the body of a long legged doji looks non-existing but is a mere dashed line because the asset has the same opening and closing price that day.
The long legged doji candlestick most often looks like a cross as shown in the below diagram. Other times, they may have a very short body in place of the dashed line.
Understanding Long Legged Doji Candlesticks
The long legged doji candlestick pattern forms due to an equality in power between buyers and sellers in the market, and is a sign of indecision amongst market players.
This indecision may mark the start of a period of consolidation, during which more such dojis may form, or break out into the start of a new trend. As such, long legged doji candlesticks are seen as being more significant when they occur in the midst of a strong uptrend or a strong downtrend since this occurrence could signify that the forces of supply and demand have reverted to equilibrium and a change could be imminent. Sometimes, the existing trend may continue after a period of consolidation, but most often, the appearance of a long legged doji candlestick precedes a trend reversal when the power of the opposing side eventually overcomes the existing trend.
Long Legged Doji Candlestick Examples
After a brief definition, now let us take a look at some examples of long legged doji candlesticks.
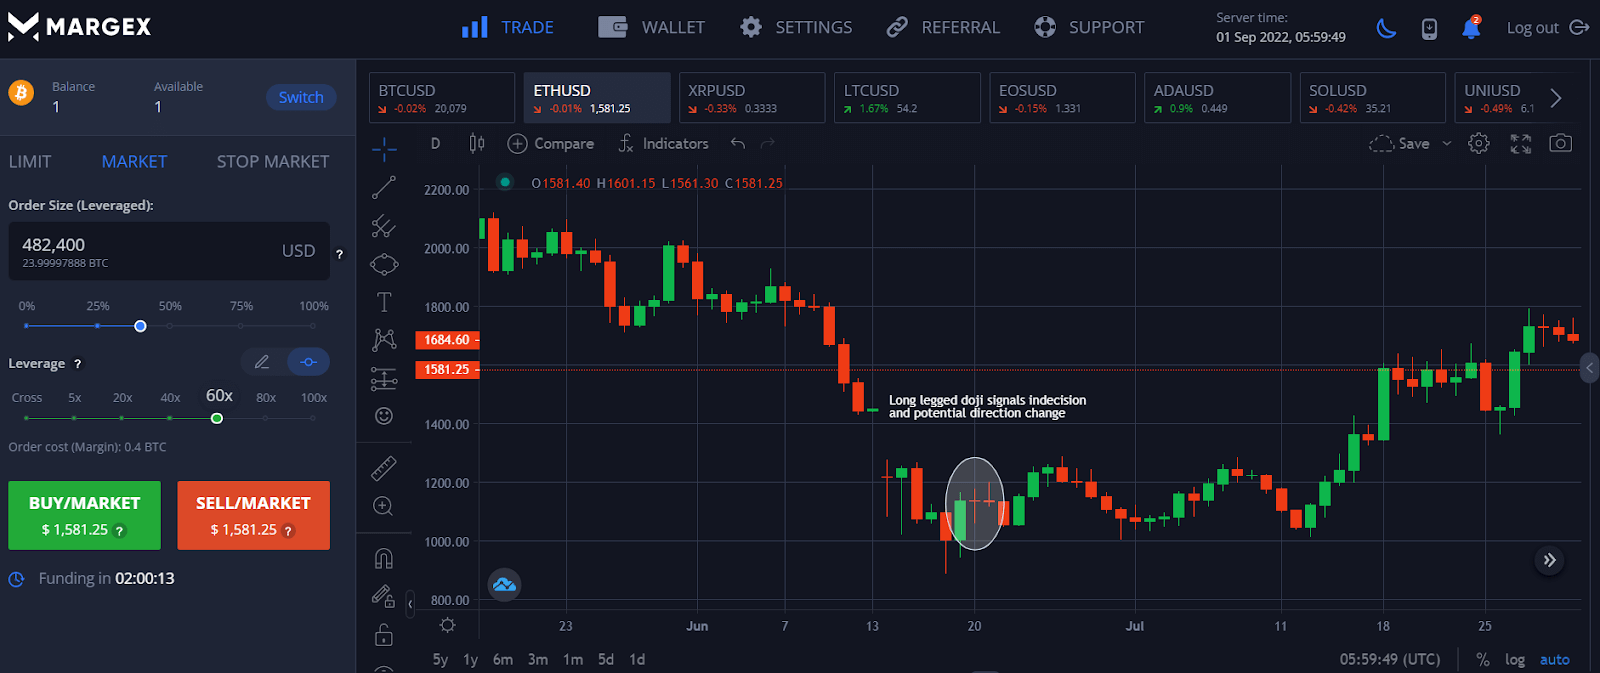
Example 1: ETHUSD Trend Reversal
In this ETHUSD daily chart example, the appearance of the long legged doji candlestick after a period of price decline was an early warning of the impending trend reversal from a downtrend into an uptrend. Notice that the reversal did not happen immediately; the long legged doji merely marked the start of a consolidation period where the price of ETHUSD was trendless and range trading, before its price eventually broke the resistance level and rose to the upside. Hence, do not be too quick to jump into conclusions when a long legged doji candlestick appears but keep a lookout for other confirmation candles or signs.
In the next example, we see two variations of the long legged doji at play on the BTCUSD daily chart.
Example 2: BTCUSD Trend Continuation and Price Reversal
In this BTCUSD daily chart, we see two results after the appearance of long legged doji candlesticks. In the larger circle, long legged dojis appeared multiple times to greatly emphasize indecision amongst traders. The price eventually continued on its prior trend, continuing its existing bullish move upwards.
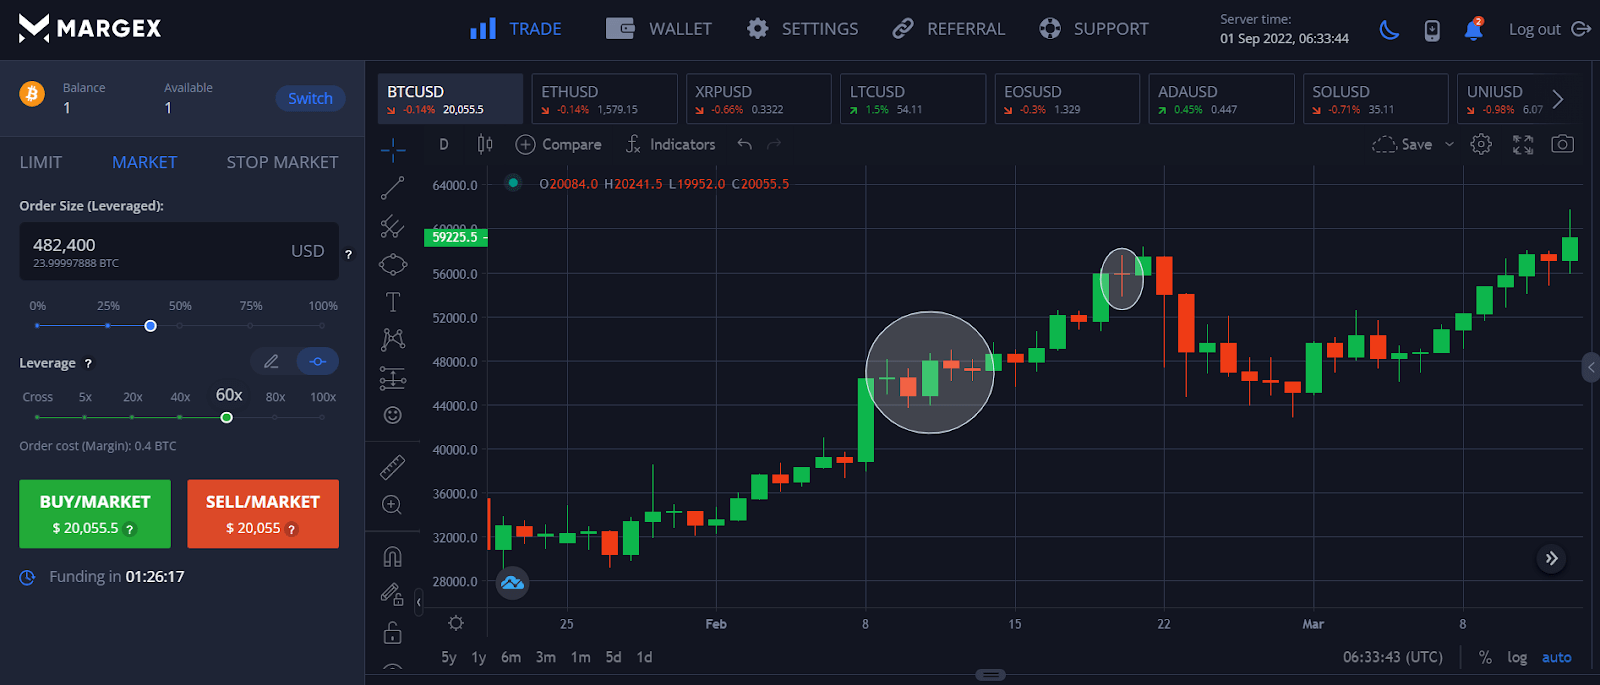
However, in the second circle, after a short bullish move, another long legged doji candlestick appeared, which showed that the bullish trend was facing some uncertainty. Subsequently, the price turned bearish and started to decline.
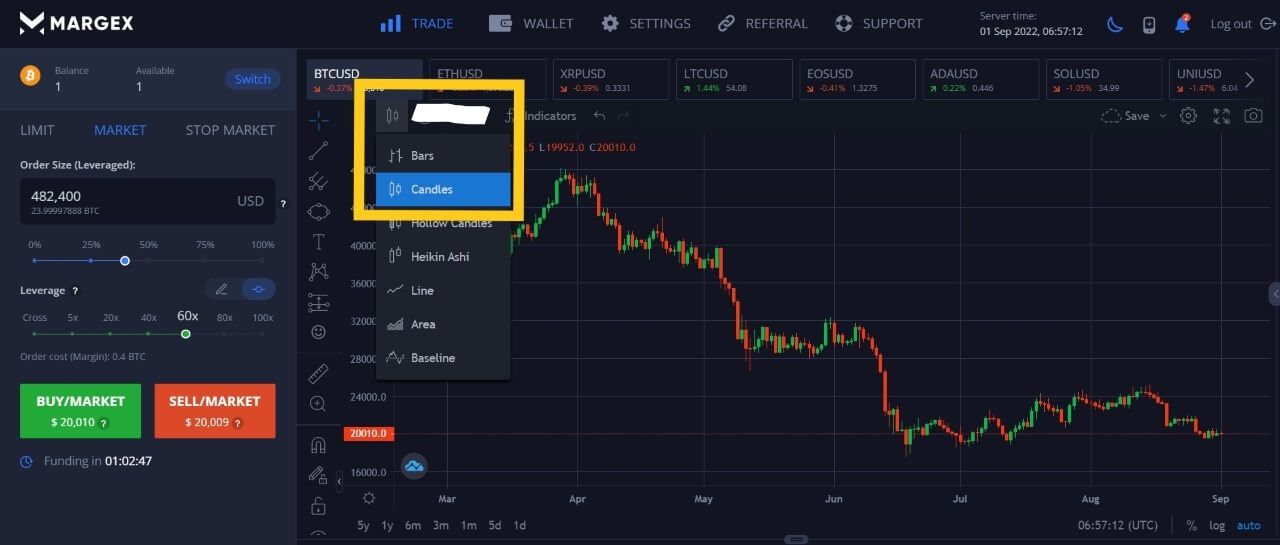
How to Trade Using Long Legged Doji on Margex?
Margex is an easy to use crypto trading platform that offers traders an array of useful technical charting tools, and has high leverage trading options of up to 100x to help traders maximise the potential of their trades. Users can easily look out for the long legged doji candlesticks on the free technical chart provided by Margex by selecting “Candles” on the dropdown menu on the price chart as shown below.
Long Legged Doji vs Other Types of Doji Patterns
Now that we have learnt the basics of the long legged doji candlestick pattern, let us compare it with other types of dojis to help you better distinguish them.
Long Legged Doji vs Neutral Doji
The neutral doji’s key difference from the long legged doji lies in the length of its wick. The neutral doji has much shorter wicks on both its ends as it happens as a result of low volatility. The neutral doji thus looks like a plus sign. The long legged doji, on the other hand, looks more like a cross than a plus sign. The neutral doji is also known as the standard doji.
Long Legged Doji vs Gravestone Doji
The gravestone doji has a long upper wick and a flat bottom. It does not have a lower wick, unlike the long legged doji, which has wicks of similar lengths on both ends. A gravestone doji occurs when the price of an asset opens at a higher price, but then closes sharply lower. It is called this name because the shape of this doji looks like a gravestone. Unlike the long legged doji which signals indecision, this doji signals a bearish reversal and appears at the end of an existing bullish trend.
Long Legged Doji vs Dragonfly Doji
The dragonfly doji has a flat top and a long lower wick. It is the exact opposite of the gravestone doji and is called this way due to it looking like a dragonfly with a long lower body. It differs from the long legged doji due to it having only one wick at the lower end, while the long legged doji has wicks on both ends. The dragonfly doji usually appears at the end of a period of price decline and is a bullish reversal signal.
Improving the Long Legged Doji for Real Trading
As we have seen from our examples above, while the long legged Doji candlestick could be useful for indicating that a market is undecided on direction, by itself, indecisiveness is not a tradable signal. Thus, the more experienced trader often uses other market data in conjunction with the long legged doji to form the basis for a trade.
Oversold and Overbought Conditions
The effectiveness of the long legged doji candlestick can be greatly improved when used in conjunction with the relative strength index (RSI). The RSI is used to show how overbought or oversold market conditions are, so when a long legged doji appears when the RSI is very overbought (a reading of say, 80), the chances of a bearish reversal is greatly increased. Conversely, when a long legged doji appears when the RSI is showing very oversold conditions (a reading of say, 20), the chances of a bullish reversal is very high.
Apart from using the RSI, there are several other methods a trader could use together with the long legged doji candlestick to improve his chances of a successful trade.
Two other commonly used examples are:
Counting the number of positive or negative candlesticks in the price chart. If a price move has had many positive candles, an overbought condition could be forthcoming, and a series of negative candles would indicate an oversold condition.
The second method is to use a moving average and see how far prices have traded above or below its moving average to determine how overbought or oversold it could be. The further away price is from its moving average, the higher the chance of a reversion back to the moving average.
2. Volatility
Volatility plays a big part in the accuracy of indicators like the long legged doji. By and large, the long legged doji candlestick pattern works much better with assets of high volatility than low volatility, while occasionally, the opposite could be true.
Hence, a trader could employ the methods outlined below to determine the volatility of an asset to improve his trading result when using the long legged doji candlestick.
i) Use the Average True Range (ATR) indicator to mark out the average ranges of the prices.
ii) Use the Average Directional Index (ADX) indicator to measure volatility. Readings above 20 signals high volatility, and vice versa.
3. Seasonality and Time
Seasonal tendencies peculiar to an asset may affect its performance. These are not only found on the daily, but also on the monthly, weekly, or hourly durations. For instance, if you are a day trader, you may find that your trading strategy may work better in the second half of the day than in the first half. Thus, keeping a note of the time element in your trading could reveal some interesting insights to help you when using the long legged doji candlestick to plan your trades.
For example, you may find that the price action on Wednesdays are always the most bullish on your chosen asset. Then, when you spot a long-legged doji form in the midst of the bullish trend, you might want to take the signal seriously. As a matter of fact, the long legged doji formation there is a sign that the bullish sentiment is showing uncertainty and the market could be ripe for a pullback. You could then plan a trade to short the asset.
Long Legged Doji Trading Strategies
Now that you have learnt how to improve a long legged doji signal, let us give you some examples of trading strategies that you could use when you see a long legged doji candlestick.
1. Long Legged Doji with Bollinger Bands
In this example strategy, we will be using the Bollinger Bands to help us in our long leg doji trade. The Bollinger Band indicator consists of a number of bands. During an uptrend, price is going to be above the upper band, while during a downtrend, prices will trade below the lower band. As such, one simple strategy is to go long when you see the formation of long-legged doji candlestick below the lower band, and vice versa.
2. Long-legged Doji with Volatility Filter
In this example scenario, we will be using a Volatility Filter to help us in our long leg doji trade. One way of gauging the relevance of a pattern is to watch the volume. If the volume is high, it means that many trades were executed at around that price, which makes a reversal more likely when faced with a sign of indecision.
We will need the volume on the long legged doji candlestick to be at least two times higher than the volume of the previous candlestick to have enough late traders to get caught and get their stop-loss executed and force the price to reverse more strongly. In short, when you see price rising continuously in an uptrend, and a long legged doji appears where the volume traded that day is at least twice that of the previous day, open a short trade at the start of the next candle and wait a couple of days after the price drops to take-profit. This works the same way for the opposite direction.
FAQ
Now that we have learnt about the long legged doji candlestick as well as its applications, it is time to do some revision. Let’s see if you can answer the below questions about the long legged doji correctly.
Is a Long Legged Doji Bullish?
A long legged doji is neither bullish nor bearish on its own.
What Does a Long Legged Doji Indicate?
A long legged doji indicates indecision amongst market participants.
Are Dojis Bullish or Bearish?
Dojis are neither bullish nor bearish on their own.
What Does a Long Legged Doji Tell Us About the Market?
A long legged doji tells us that the market is showing signs of uncertainty, with the number of buyers and sellers in equilibrium. When appearing at the end of an existing trend, a long legged doji could be a sign of trend exhaustion and a possible trend reversal in the works.


