The crypto, forex, stock, and indices continue to grow, and traders look for better opportunities and strategies to outplay big players and investors. Most times, strategies must be adapted to spot trends and trend reversals.
Most traders adopt the use of indicators such as the simple moving average (SMA), exponential moving average (EMA), moving average double and triple crossovers, and relative strength index (RSI). And in most cases, for a better trading setup and profitability, use indicators and patterns such as bullish divergence, bearish divergence, head and should pattern, rounded bottom, and the Marubazu candle pattern for trend reversal.
In this guide, we will learn how to spot the Marubozu candle pattern, combine this pattern with other indicators or trading strategies, and trade this pattern on the Margex exchange.
What Is Marubozu Candlestick Pattern
Marubozu candlestick pattern is a long-bodied candle with no wicks used by technical analysis traders to spot trend reversals and is effective when combined with other strategies.
Marubozu is a Japanese word from close-cropped signifying a candle with no shadow or wick.
Unlike other candlestick patterns like the doji or spinning top pattern, the Marubozu is a single candle pattern with no wick; this can be a bullish Marubozu or bearish marubozu indicating the direction the market could be headed.
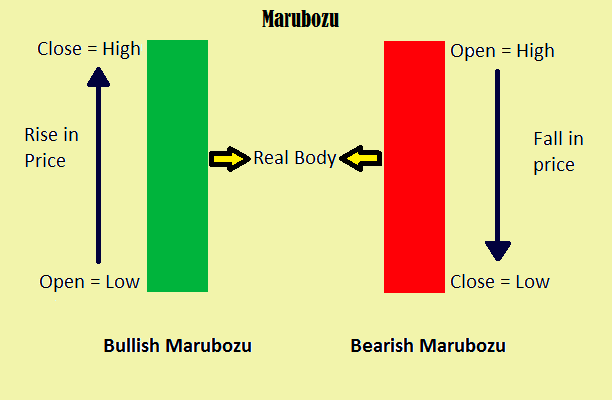
A bullish Marubozu candle indicates price opens at a low point and closes at a high point, while the bearish Marubozu indicates that the price closes at the highest point and opens at the lowest point.
The Marubozu candlestick pattern is not very common among traders as this chart pattern can be rare to find sometimes. But the formation of the Marubozu candlestick pattern can be found once you know what you are looking for and can determine how effective it can be depending on the location in the trend.
Although the Marubozu candle pattern can be found in any timeframe and chart pattern, let’s look at how to find this candlestick pattern at the beginning of a trend, middle of a trend, and at the ending of a trend and how this affects the trend continuation or reversals.
Marubozu At The Kickoff Of A New Trend
The candle’s color identifies the Marubozu candle pattern and the market’s direction, as this depicts the emotions of either buyers or sellers. The Marubozu candlestick pattern can be seen at the start of a trend, signaling trend reversal and buyer control of the price actions. When news accompanies this price action, the movement is usually high as this is a strong sign of a bullish trend, and in such cases, the Marubozu candle pattern appears at the start of a trend.
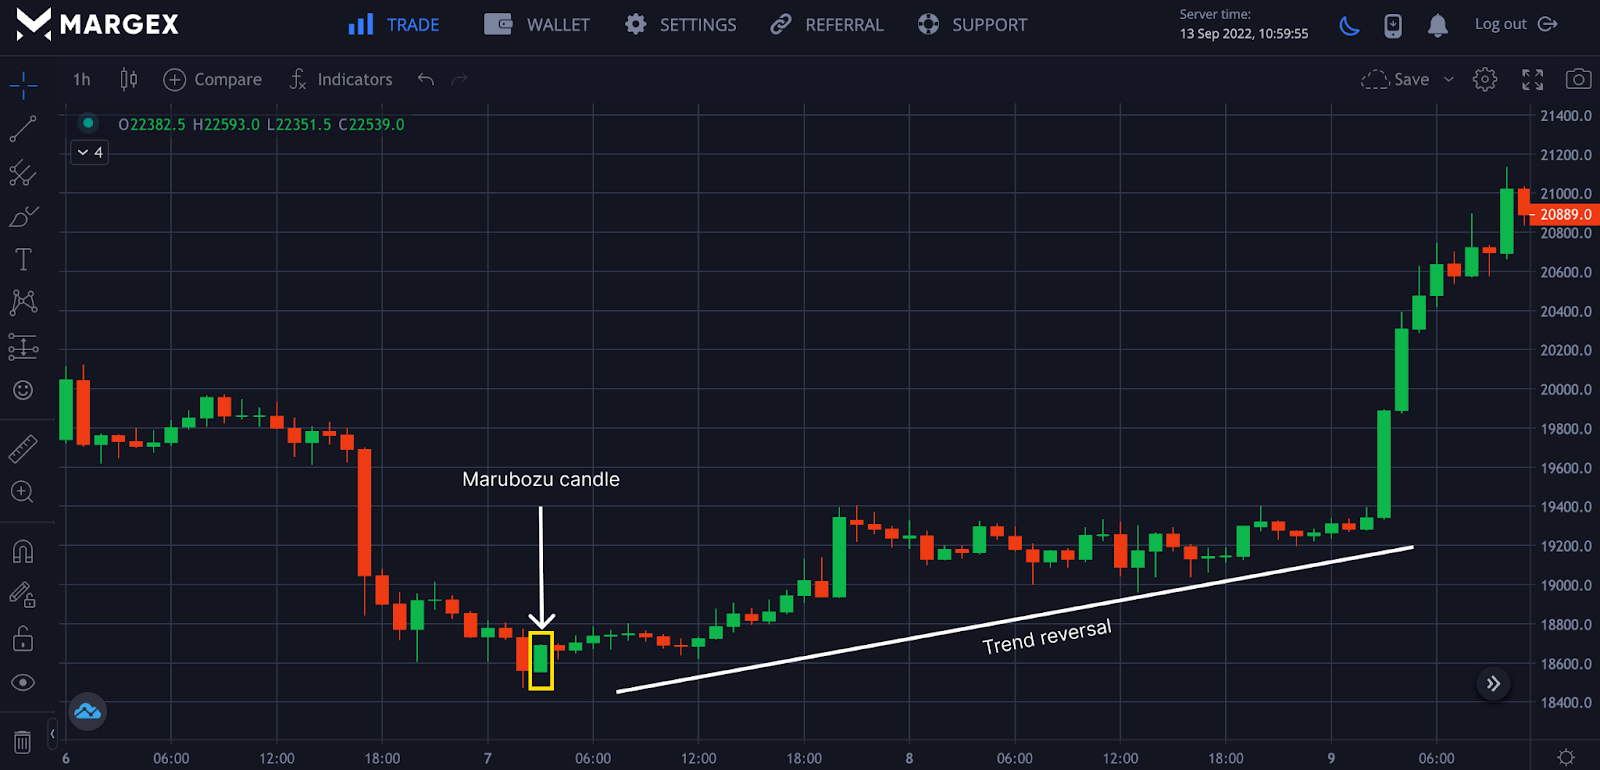
The Marubozu candle pattern appeared at the end of the downtrend, signifying a trend reversal to the upside.
Marubozu Pattern In The Middle Of A Trend
In technical analysis, traders expect trend reversals or trend continuation to happen depending on the price actions of the market at that point. For example, sellers expect a trend to end, but this trend continues as the sellers are sidelined, starting a new trend. The Marubozu candle patterns are usually found in the middle of a trend and show continuations of the present trend.
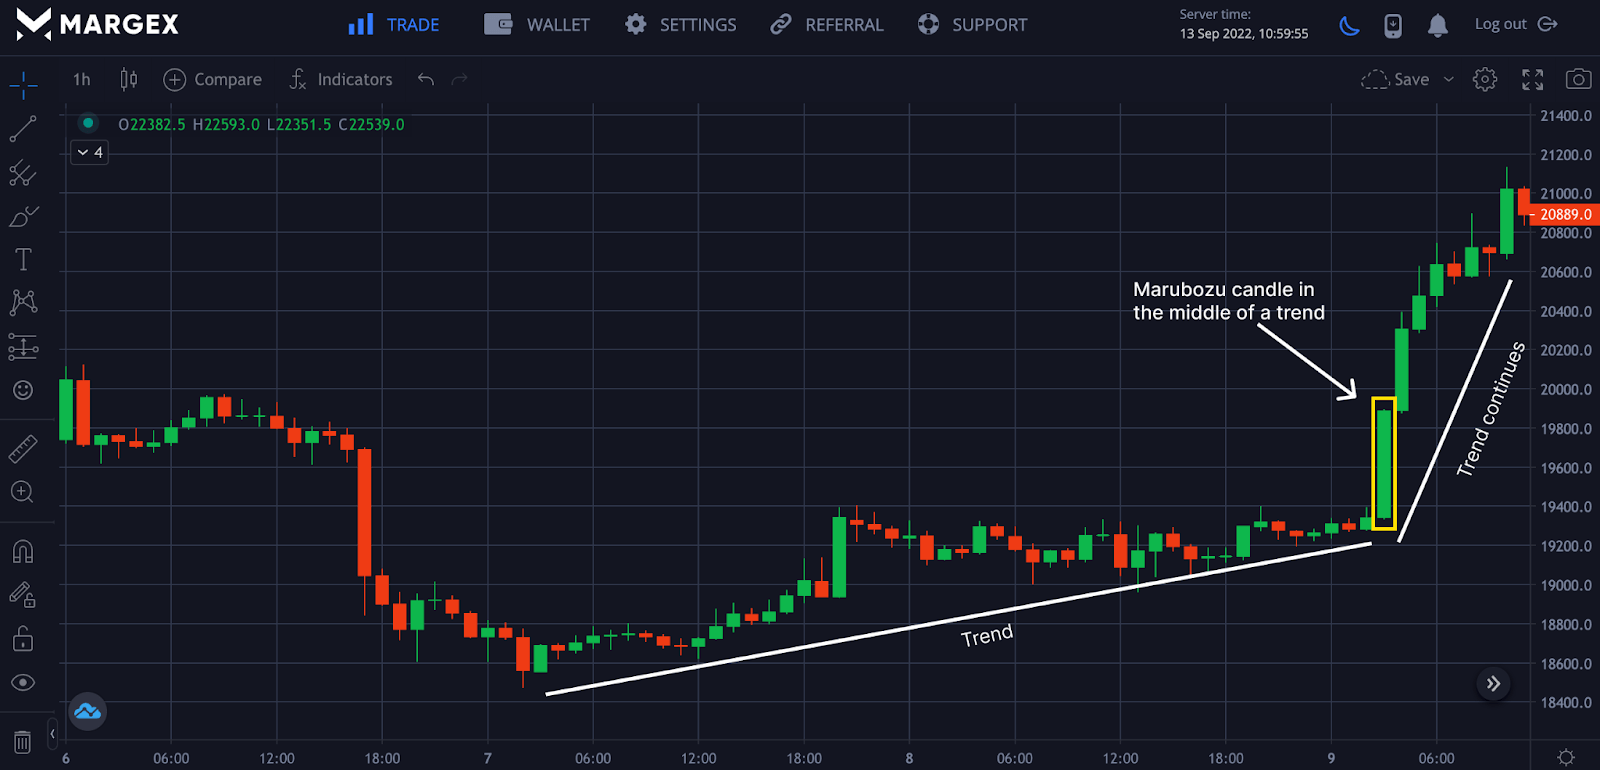
The image above shows a Marubozu candle in the middle of a bullish trend that shows a bullish continuation in the direction of the trend.
A Blow-off Top May House A Marubozu Pattern
The bearish Marubozu candle pattern, also known as the blow-off top pattern, is a trend reversal or bearish reversal pattern based on the psychology of the current uptrend pattern followed by a downtrend. This is seen when the market fails to make a higher high as the price of the candle opens at the highest point and closes at the lowest point of the previous bullish candle as a result of sellers overcoming the buyers.
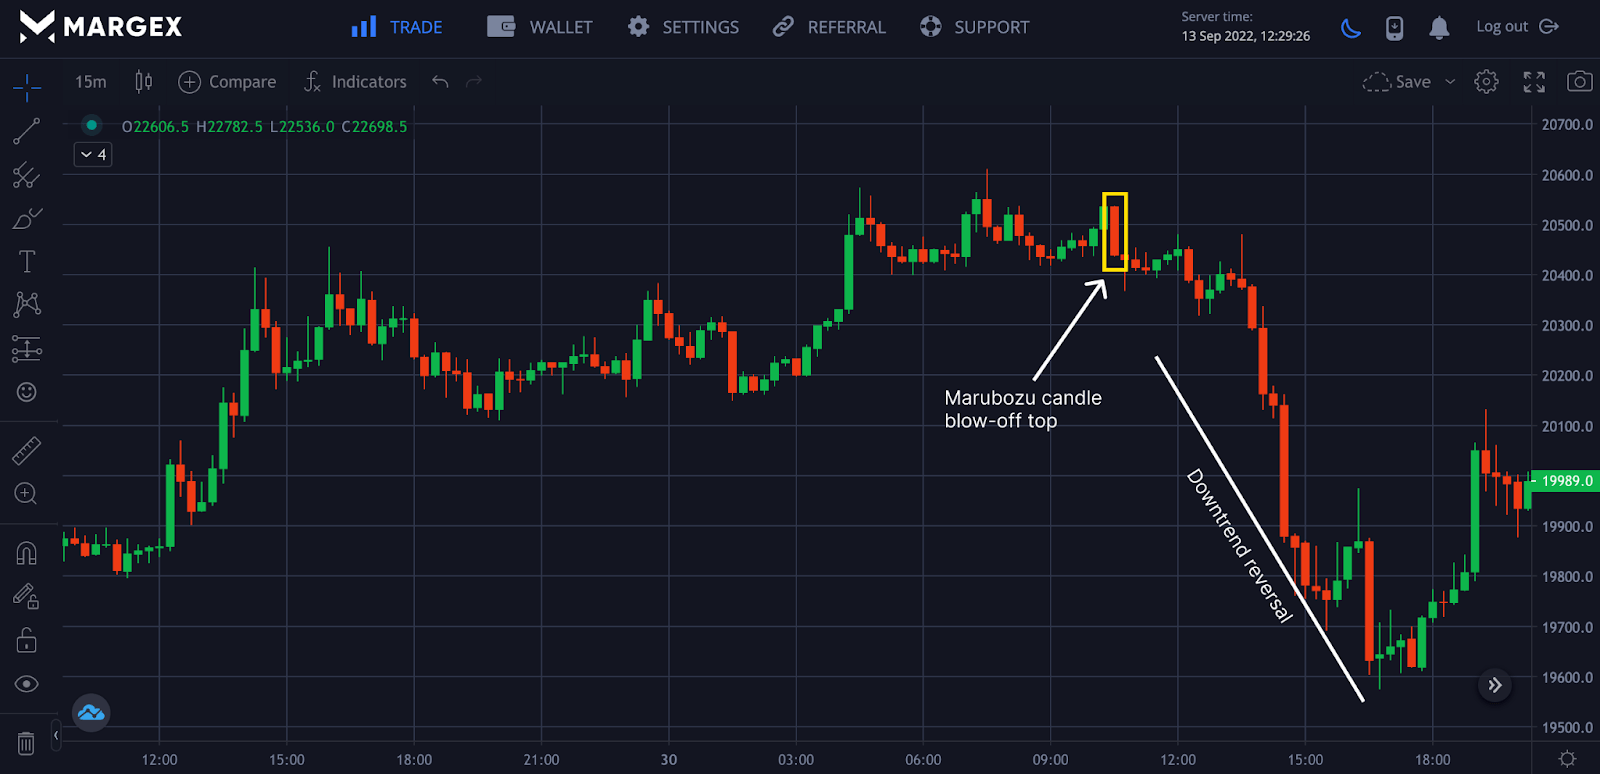
The image shows a bearish Marubozu candle pattern signifying a blow-off top as the price prepares for a downtrend price reversal. Most traders look out for the Maruboza candlestick pattern at the end of an uptrend to open a short open position when combined with other strategies.
What Do Marubozu Candlesticks Look Like?
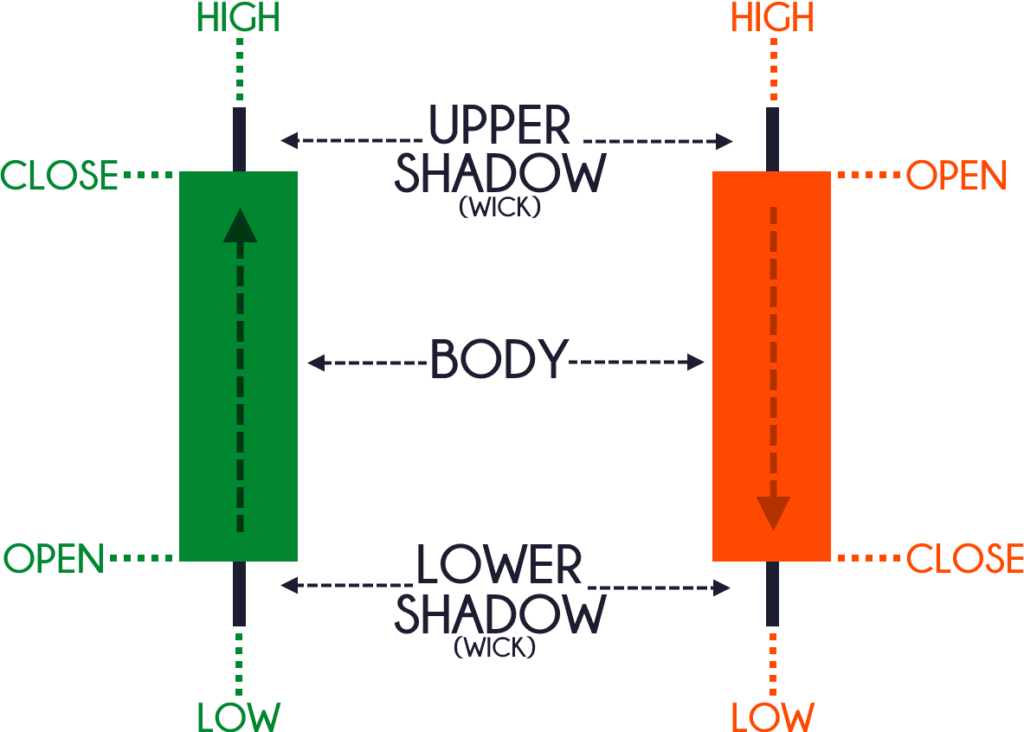
The Japanese candlestick is made up of two parts seen from the image above the body, and the wick is also called shadow in most cases. The colored part of the candlestick is identified as the body, while the lower parts are called the shadow. A candlestick can be styled red to mean a bearish candle, depending on what the trader prefers, but most people prefer using red candles to mean a bearish sign, while the green candlestick is identified as a bullish sign.
A bullish candlestick opens at a low price and closes at a high price, while a bearish candlestick opens at a high price and closes at a low price.
The interesting fact about the Marubozu candlestick is that there are little or no wicks or shadows accompanying this candlestick.
Different types of Marubozu candlestick patterns can be identified by traders who trade this pattern. Let us focus on the common ones that include Marubozu full, Marubozu open, and Marubozu closed.
Marubozu Full
The full Marubozu candlestick pattern is a candlestick with no wicks or shadow and looks like a full candle. This type of candle can be rare, but when found, the price will continue in the direction of the candlestick pattern until the end of that trend.
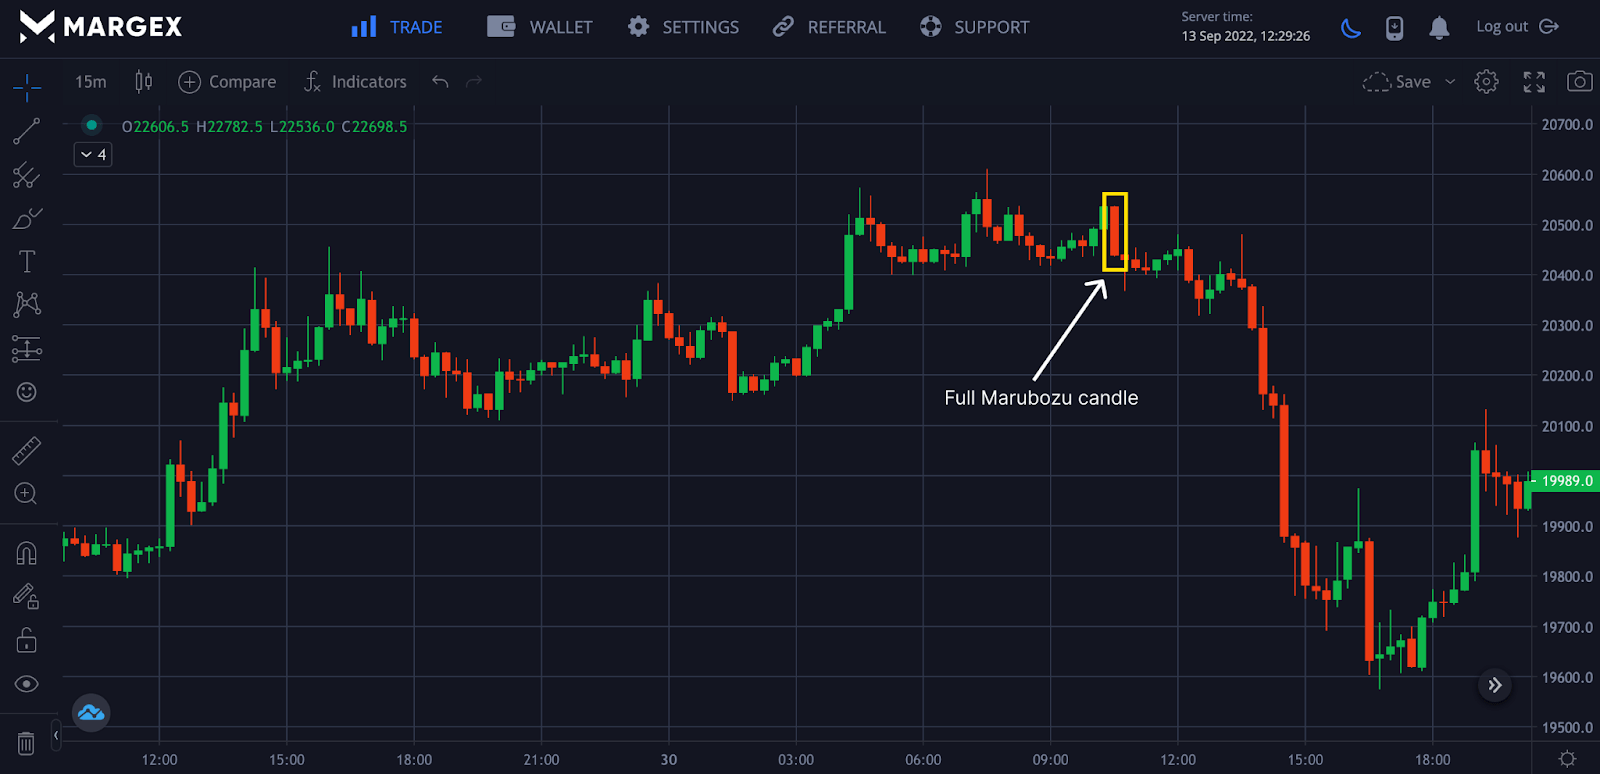
The image shows a full Marubozu candle pattern indicating the end of the trend as a potential price reversal to the downside, followed by the price becoming bearish.
Marubozu Open
The Marubozu open candlestick pattern is made up of a short wick above or below the closing price, indicating the candle has a flat opening price and prices move in the direction of the opening price.
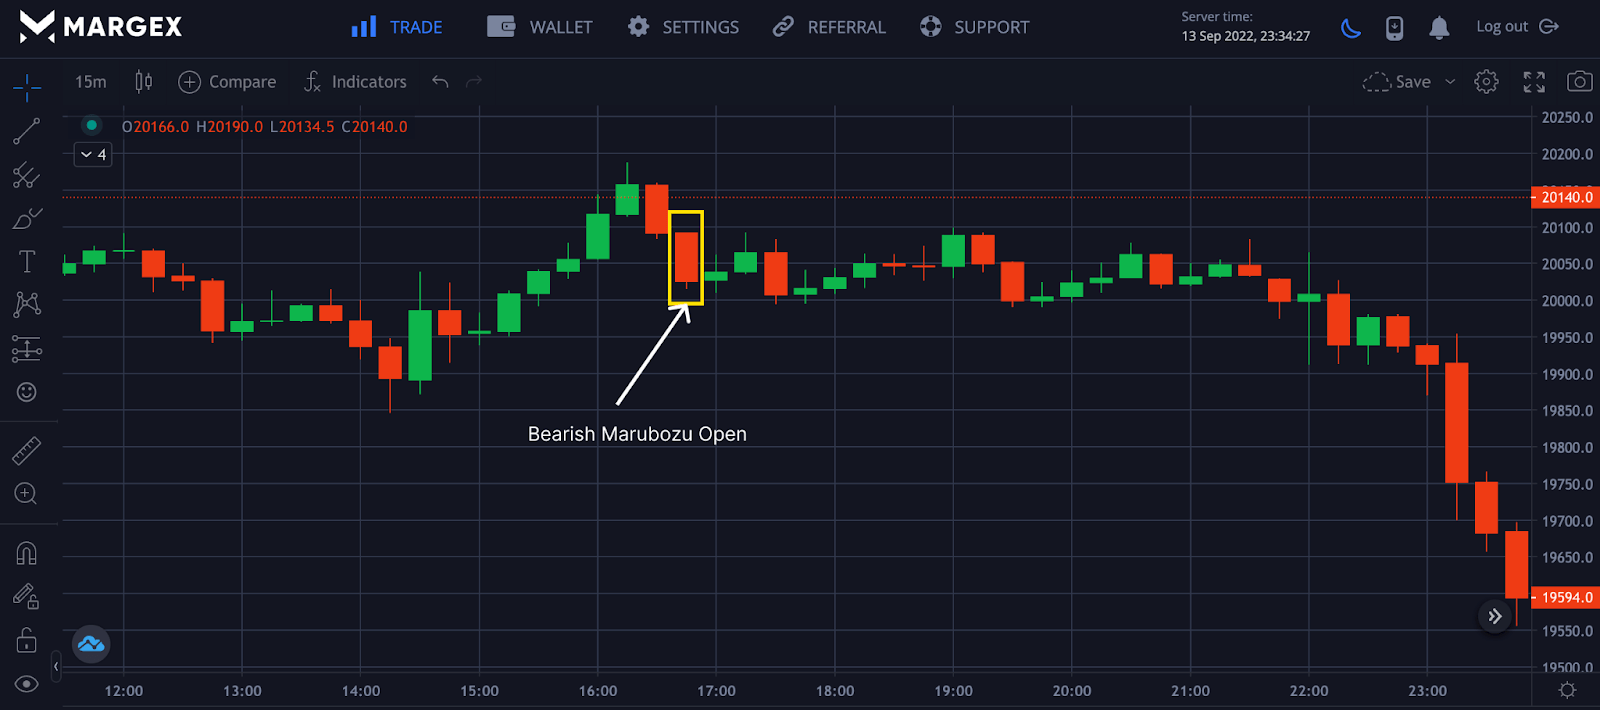
The bearish Marubozu open confirm the direction of the crypto asset being driven to the downside of the chart.
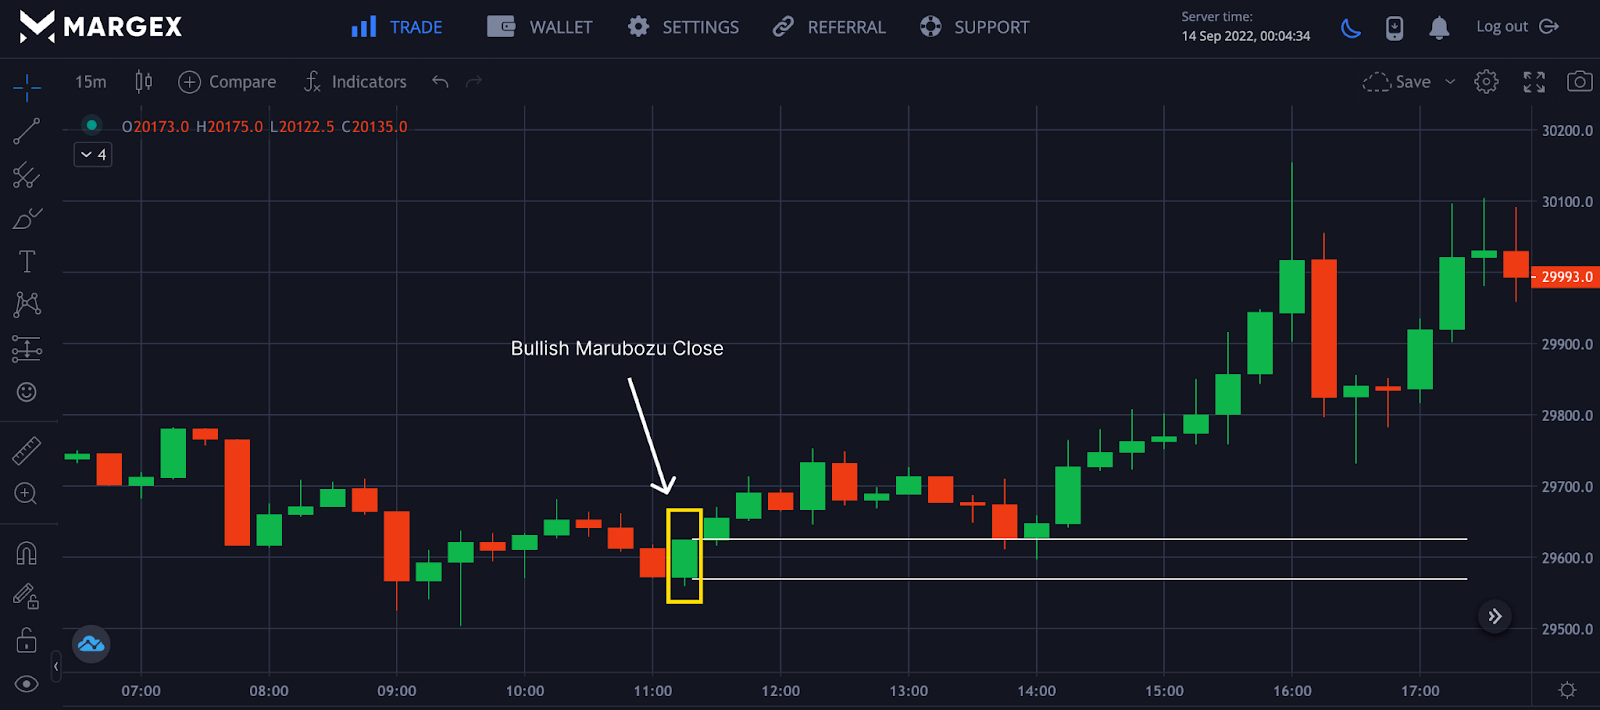
Marubozu Close
The Marubozu close candlestick pattern is the opposite of the Marubozu candlestick open as it shows that price traded slightly below the opening price with the closing price being flat.
Why Are Marubozu Candlesticks Important?
The Marubozu candlestick pattern is handy for most technical analysts as they know the trending power of price in a particular direction. The Marubozu gives the trader a better picture of who controls the price actions, whether sellers or buyers.
For a bearish Marubozu candlestick, this indicates the sellers are more in control over the market and have overpowered the bulls pushing the price lower. Bullish Marubozu indicates buyers are in control and detects the market’s price.
From the images shown so far, it is clear that this pattern is reliable, and when combined with other tested strategies, you will be more profitable.
Using The Marubozu Candle To Trade Crypto On Margex
Margex is a Bitcoin-based derivatives exchange that allows crypto traders to trade up to 100x leverage with various crypto assets and, simultaneously, stake the traded token for up to 13% APY returns.
The Margex exchange is well-known for its excellent user interface, which makes trading simple even for beginners, and some of its built-in features are designed to help traders become more profitable.
Margex offers unique staking while trading feature for traders and investors to help them become more profitable, allowing you to earn passive income despite how volatile trading can be. Daily rewards are credited to your staking account immediately through an automated system employed by Margex.
To have full access to Margex as a trader, you would need to have an account as a new user or login to have access to these features that also include robust technical analysis tools, which are built with real-time prices to assist you in making money trading.
Margex has been designed to help traders trade easily; we will discuss how to trade the Marubozu candle pattern for both the bullish Marubozu pattern and the bearish Marubozu pattern. Because of how reliable the Marubozu candlestick pattern can be, most traders look for this opportunity to enter a long or short position, depending on the timeframe employed.
How To Trade The Bullish Marubozu
The bullish Marubozu candle pattern is formed when prices move to the upside. The candle opens with a low price and then closes with a high price forming the Marubozu candle pattern. On spotting this formation, the trader can open a long position after the Marubozu candle has closed with a bullish formation.
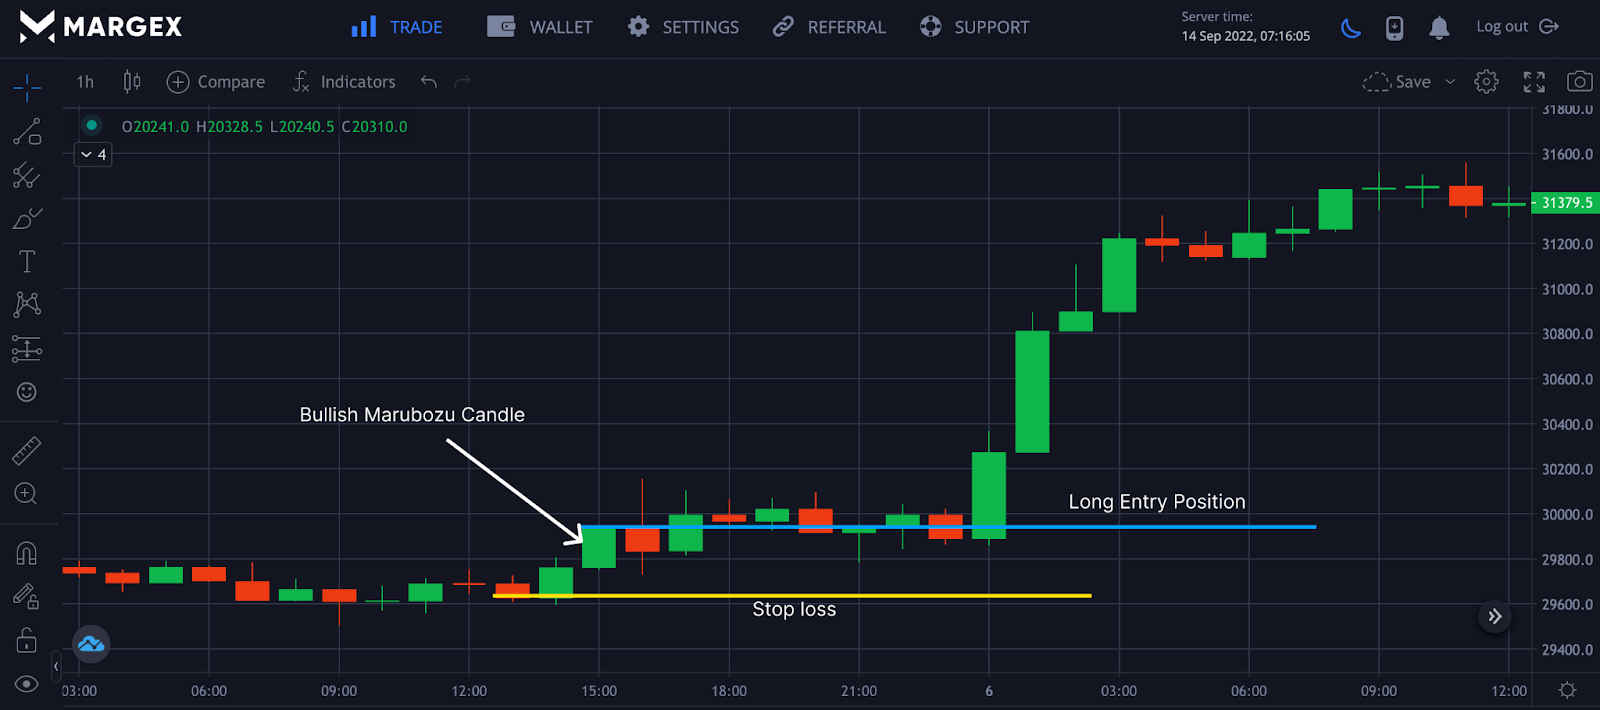
The bullish Marubozu candle pattern’s formation shows the price’s direction; from the image on the 1-hour candle close for a BTCUSD pair, a trader can go long on a clear bullish break while setting a stop-loss some distance below the bullish Marubozu candle.
How To Trade The Bearish Marubozu
The bearish Marubozu candle pattern is formed when prices move to the downside of the price direction. The candle opens with a high price and then closes with a low price forming the bearish Marubozu candle pattern. On finding this candle pattern, a trader can open a short position after the Marubozu candle has closed with a bearish formation.
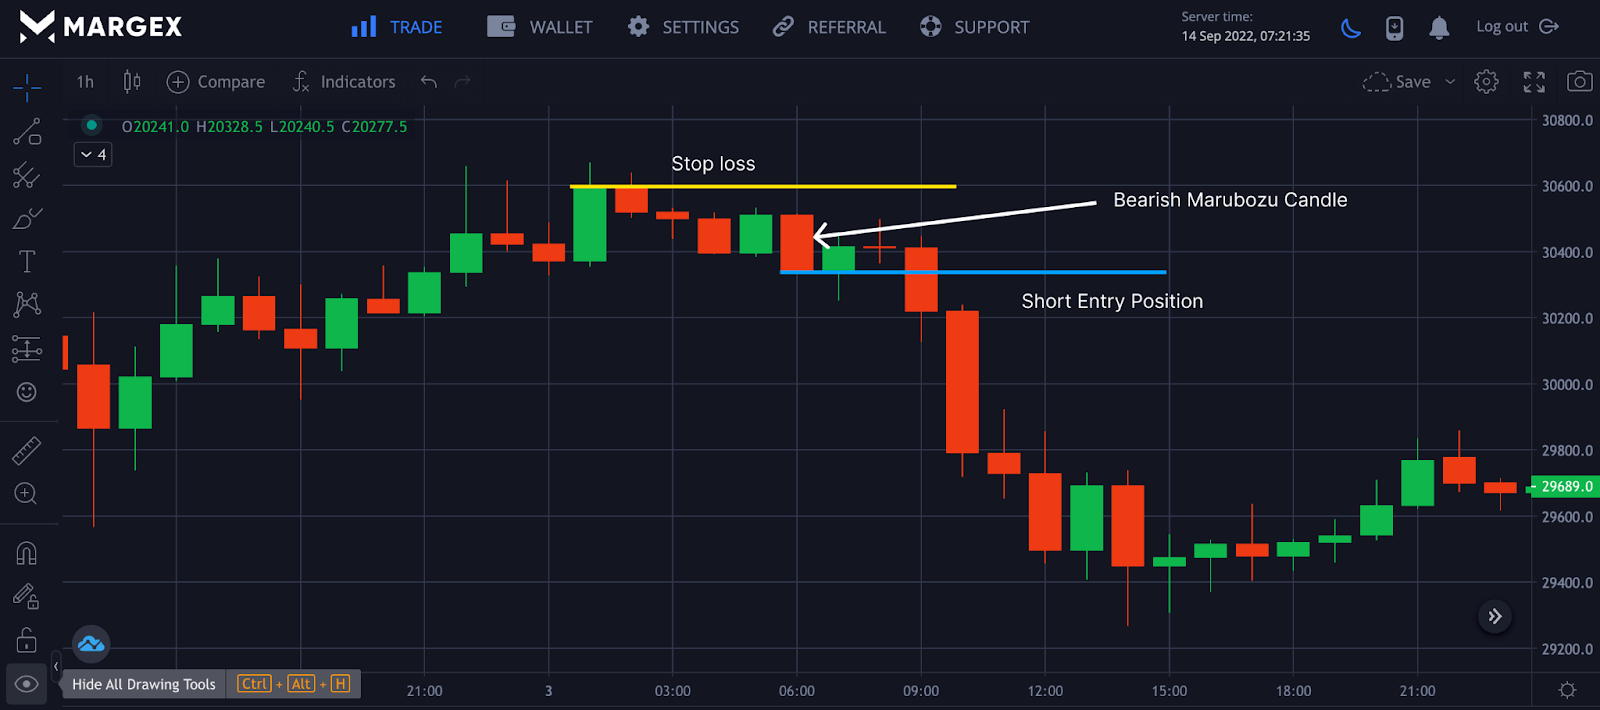
The formation of the bearish Marubozu candle pattern shows the direction of the price; from the image on the 1-hour candle close for a BTCUSD pair, a trader can open a short position on a clear bearish break while setting a stop-loss some distance above the bearish Marubozu candle.
Combining The Marubozu Pattern With Other Strategy
Trading the Marubozu candle pattern alone is not advisable, especially in a volatile market; for a better setup and probability, it is best to trade this candle pattern with a moving average, trendline, and Fibonacci retracement for better confirmation.
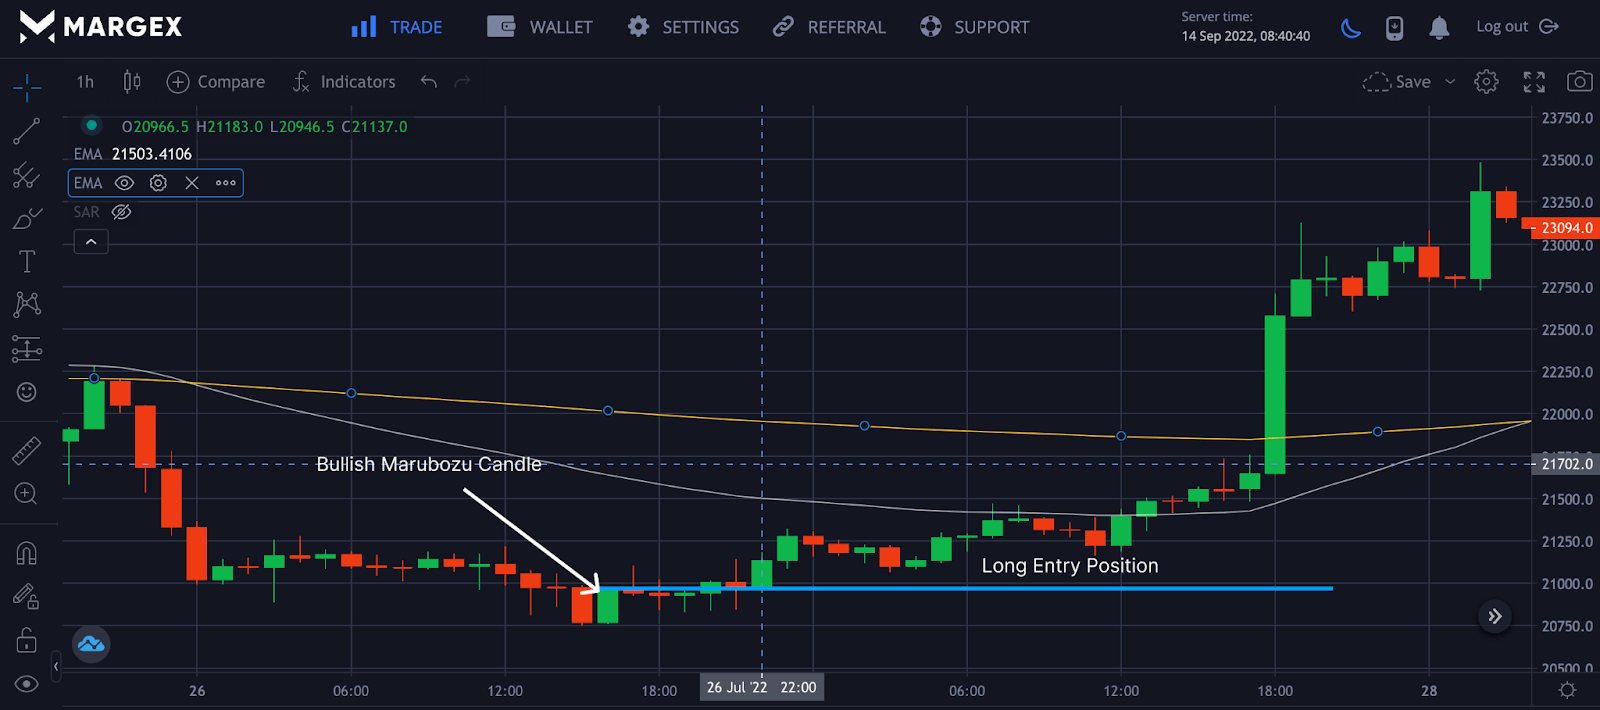
The image above shows a bullish Marubozu with prices moving toward the close. The 50 and 200 exponential moving average (EMA) is used to confirm an uptrend as price trends above the 50 and 200 EMA.
Advantages Of Marubozu Pattern
Below are the advantages of using the Marubozu candle pattern.
- Candle patterns are easy to identify on the chart
- It can be very effective for scalping and making quick gains
- This candle pattern help traders discern market sentiment, and the direction price would be headed
Disadvantages Of Marubozu Pattern
The following are the disadvantages of using the Marubozu chart pattern.
- This chart pattern can be exposed to extreme price action leading to traders being prone to false breakouts.
- Since stop-losses are placed a few distances from the candle pattern, stop-losses can be triggered in some cases or stop hunted.
Accuracy Of The Marubozu Pattern
The appearance of the Marubozu candle pattern is a strong sign that the trend could go into an uptrend or downtrend over a period. The location of the Marubozu candle pattern has a huge influence on the trend or direction of the prices due to the market’s price action.
The formation of a bullish Marubozu candle pattern at the end of a downtrend would signal the price going upwards in the direction of the candle pattern. It can be confirmed with other strategies before opening a long position for that trade.
The formation of a bearish Marubozu candle pattern at the end of an uptrend would signal a blow-off top and the price going downwards in the direction of the candle pattern. Confirming this trend, a trader can open a short entry position.
However, it is very important to determine the position of the Marubozu candle pattern before going long or short on an entry position to avoid trend reversal or continuation.
Marubozu vs. Engulfing Pattern: The Differences
The Marubozu candle pattern is the single candle formation. It gives price continuation or direction of prices while engulfing patterns are used for price reversals formed from two candlesticks due to price gaps.
FAQ: Frequently Asked Question On Trading Marubozu Candle Pattern
Trading the Marubozu candle pattern can be reliable, but when not applied properly can be a challenge for maximum profitability. Here are the frequently asked questions traders need answers to.
What Happens After A Marubozu Candle?
A Marubozu candle pattern can be bearish or bullish; for a bullish Marubozu candle, the price goes in the direction of the candle, maintaining an uptrend, while a bearish Marubozu indicates the price going in the direction of the candle pattern, which is a downtrend.
What Does The Marubozu Candlestick Pattern Indicate?
The Marubozu candlestick pattern indicates the price direction, either bullish or bearish, and shows price continuation. The position of the Marubozu influences price continuation, as the candle pattern can be seen at the beginning, middle, or even at the end of a trend.
Is Marubozu Pattern Effective?
The Marubozu candle pattern is a strong and effective pattern used to determine the direction of prices. This gives the traders an insight into either opening a long or short position. It is best not to trade the Marubozu candle pattern in isolation as it can be exposed to false breakout due to price actions. Trading the candle pattern with other strategies will lead to better risk management and profit taking for better trade entries and profitability.