
Trading requires mastery of different strategies and techniques. Also, indicators are essential tools that aid traders in making better decisions. What is a net volume indicator?
Net volume indicators are technical analysis tools that deal with the volume of an asset. They subtract the uptick volume of an asset from its downtick volume over a specific time frame.
Keep reading this article to learn more about this tool and how to apply it to your trades. You will also find the answer to the question, what is net volume?
Understand The Net Volume Indicator And How It Works?
A net volume indicator is a technical analysis tool that measures the volume of an asset. Net volume is the difference between an asset’s uptick and downtick volume over a specific period.
A positive net volume indicates that buying pressure and volume increase is greater than selling pressure. The selling pressure is higher in the market for a negative net volume.
Although the standard volume of an asset can zigzag due to market pressure, the net volume takes note of the trading volume and the average price.
This indicator works by measuring historical data and presenting them on a price chart as bars showing volume. The time frame of the price level to be measured must be predetermined.
Example of net volume indicator
A trader can apply many net volume indicators to a trading chart. Some popular indicators are listed below.
- Volume-Weighted Average Moving Price indicator: This indicator is most popular among day traders. It calculates the volume-weighted price of an asset over a specific period. Traders buy when the price is above the indicator and sell when it is below it.
- Money Flow Index (MFI) Indicator: This net volume indicator bear similarities with the RSI indicator. It has a single line that displays overbought and oversold levels.
It is calculated by adding the high, low, and close prices and dividing them by 3. Then the money flow ratio is calculated using the formula 100 -100/ (1 + Money Flow Ratio)
It can be used to find overbought and oversold levels on the chart.
Net Volume In Crypto Technical Analysis
Volume is a commonly used indicator for technical analysis in the financial market. An asset’s price chart displays the volume of trades over some time when a net volume indicator is applied to it.
A technical analyst will study the volume data that will be plotted with red and green bars on a chart. It is also plotted with a moving average or price trend line.
The net volume reflects the buyers’ and sellers’ pressure on the price of an asset. It is a reliable momentum indicator. The trading volume in the market can be affected by different factors.
For cryptocurrencies, positive news can influence market sentiment to boost the buying volume at the support level and increase the selling volume at the resistance level.
Resistance level
The resistance level is the price an asset attains, beyond which investors will take short positions and sell. Investors will take profit on trades once they go above the resistance level rather than risk retracement.
At this price level, the selling pressure is higher than the buying pressure in the market.
Support level
The support level is the price at which investors want to purchase an asset. At this level, it is believed the price will not dip further. The support level also gauges market sentiment and is used by technical analysts to form trade strategies.
Note that support and resistance levels can be broken, and new ones formed as the price of an asset fluctuates periodically.
Volume Weighted Average Price (VWAP)
Price is an important parameter for trading. The volume is also important to avoid unprofitable assets. The volume-weighted price (VWAP) is a trading parameter used to determine the average price of an asset regarding its price and trading volume.
You can calculate it by finding the total cost of each transaction and dividing it by the total number of assets traded on a particular day.
Mathematically VWAP = Ʃ Price X Volume
_______________
Ʃ Volume
If the price of an asset is higher than the VWAP, investors will take long positions. When the price is lower, short positions go.
Unfortunately, VWAP is not a very accurate indicator since it relies on historical data, and prices can fluctuate rapidly.
What Are The Pros And Cons Of Using A Net Volume Indicator?
Here are the advantages and disadvantages of trading with net volume indicators.
Pros
Greater precision
These indicators are calibrated to be as mathematically precise as possible. It is a known fact that history usually repeats itself in the financial market. Instead of going through the rigors of manual calculations, you can apply them to your price chart.
Wider choices
With the net volume indicator, traders can choose different strategies based on their observation of the patterns. Trading without this net volume indicator means sole reliance on candlesticks and can be quite cumbersome.
Better trade decisions
With the net volume, indicator traders can make better trade decisions and not emotionally irrational ones. It is difficult to argue with real data and facts, and the indicator usually gives the right signal most of the time.
Cons
Probability
No indicator is 100% accurate. Moreover, the net volume indicator might not account for violent price changes in the market. Crypto markets, for instance, are highly volatile, meaning that the results might be different.
It might not be easy to interpret.
Technical analysis requires a basic understanding of chart patterns and might look complicated for beginners. The net volume indicator is no exception and requires proper understanding to be used for successful trades.
Not always the best choice
Sometimes a trader would need to look at other properties of an asset, like price, and not rely on volume only. A net volume indicator focuses solely on volume and might be limited in giving a trader a rounded view.
Also, it might not be able to predict future price shifts accurately, since a lot of factors are at work in a market.
How To Use The Net Volume Indicator In Trading On Margex
Margex offers a safe and reliable platform to place your trades and apply your strategies.
Follow the steps below to get started.
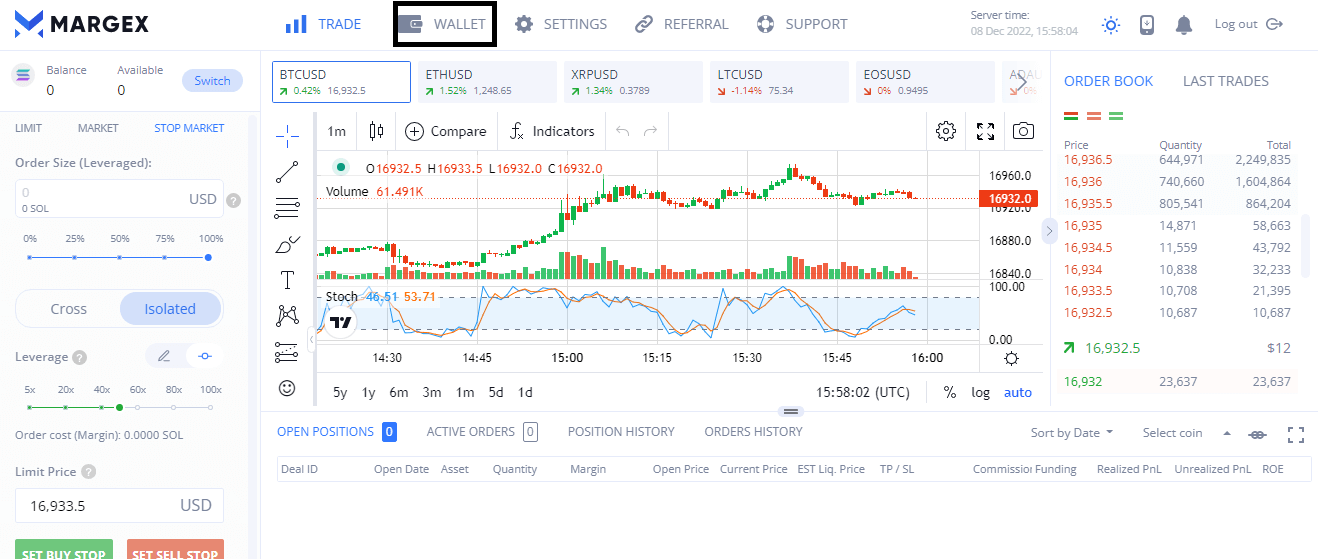
Step1: Sign Up or Log in
Sign up or log in and go to the trade page
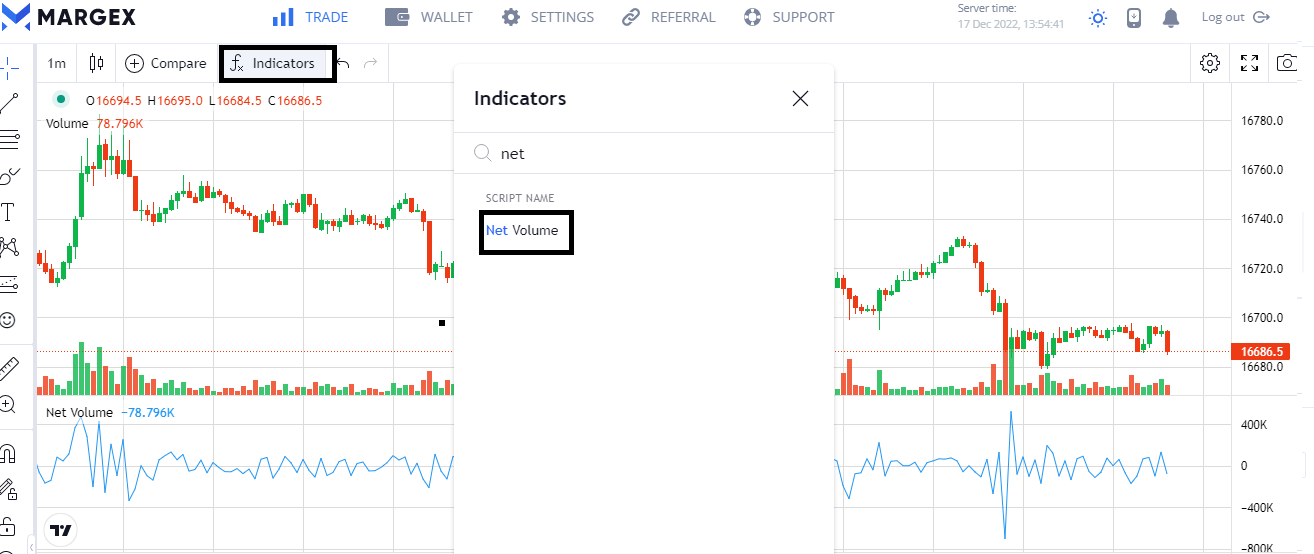
Step 2: Select the indicator
Click on indicators, select the net volume indicator, and apply the breakout strategy.
Step 3: Draw the line
Draw a horizontal line to mark the resistance level on your chart.
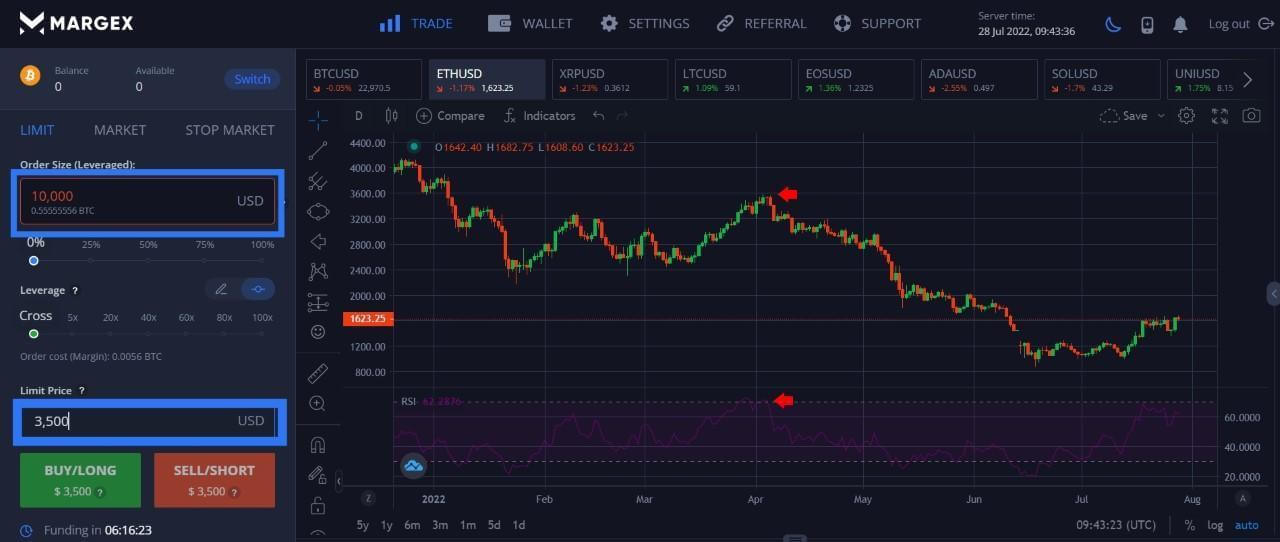
Step 4: Place the trade
Once the asset breaks above the line with at least two candles, it might indicate a breakout. Place your trade above the resistance level. Then your stop loss at the resistance level.

Step 5: Take profit
Once the asset rises, you can watch it and then take your profit. Congratulations, you have traded with the net volume indicator.
Note: This strategy is not financial advice. Traders should do in-depth research and never risk more than they can afford to lose.
Best Trading Strategies With Net Volume Indicators
These strategies can help you profit from your net volume indicator.
Breakouts and volume
Using this strategy, place the trade at the breakout level before the price of an asset goes on an uptrend. Watch out for the false breakout, and always apply your stop loss. Do not hold onto losing positions at all costs.
Trade the trend
If the price of an asset is in an uptrend or a downtrend, it is also a valid strategy to base your trades on the direction of the trend. However, do not enter when the trend must have run its course and is about to reverse.
Use the volume as an indicator of the trend.
Trade Volume Spikes
Volume spikes are a result of news-driven events. It is an increase of at least 500% from the recent volume average. Once this is noticed, it is a spike and a profitable opportunity.
FAQ – Common Questions And Answers
Questions you might have on net volume indicators are below, with simple answers to explain further.
What is the net volume indicator in crypto?
This is a technical indicator that measures the difference between an asset’s uptick and downtick volume in a particular timeframe.
How can a trader make a profit trading net volume?
Net volume can earn profit for traders when they apply popular strategies such as trading breakouts, following the trend, and trading volume spikes. The bottom line is that you must focus on your asset’s net volume.
What do traders understand from the net volume indicator?
It is an indicator of buyer and seller pressure in the market. It also shows the volume of trades in a particular trading session.


