
If you’re new to cryptocurrency trading, you’ll likely become familiar with the words “overbought” and “oversold” in the near future. It is common knowledge that the entire cryptocurrency market is extremely volatile, and understanding the degrees of overbought and oversold is an essential component of cryptocurrency trading. That’s why it’s essential to have a solid knowledge of what they are and how you can recognize them. What exactly do they mean and how can you make the most of this information to your advantage?
In this article, we will discuss what overbought and oversold levels are and demonstrate how to identify them in the market. We will also give you some tips on how to trade when these conditions are present in the market.
What are Overbought and Oversold Conditions?
These two words really give a very good description of themselves, and most of their explanation can be found in their names. Since you are aware that it is important for you to have some knowledge of these market conditions, we will now proceed to discuss them in detail so that you can get an idea of what each of them means. You will also become familiar with their similarities and differences. So what does overbought and oversold mean?
Overbought
To explain this in layman’s terms, an asset is overbought when its current market price is higher than its intrinsic value. When an asset is overbought, it means that its price has been rising for some time due to persistent buys for no real investment reason. This can result in the asset trading at a higher price than it is currently worth.
This phenomenon, although often only lasting for a short time, can persist for an extended period. It is short-lived in the sense that it is an indication that a pullback or correction will occur. This means that it is not sustainable. As soon as the buying frenzy stops and traders realize that the crypto asset is too expensive or that it is trading at a price higher than its intrinsic value, a massive sell-off can occur.
Oversold
Overselling, on the other hand, occurs when the price of a crypto asset has fallen too far from its intrinsic value. Essentially, overselling is the opposite of overbuying in terms of its importance. Similar to overbought, oversold conditions arise when there is continuous price volatility, ultimately leading to unjust market pricing.
The oversold market can also be short-lived or drag on for a long period. This can happen for many reasons, but it is also an indication that a trend reversal is imminent. As soon as the realization of the asset’s perceived value occurs, traders will begin to adjust their positions.
How To Identify If An Asset is Overbought and Oversold
Now that the definitions are out of the way and you have a general understanding of what they mean, the next step is to develop the ability to recognize when crypto assets have been overbought or oversold.
Trading can be a lucrative venture, but only if you know what you’re doing. An important trading skill is being able to keep an eye out for these conditions as they help to make informed trading decisions. If you’re able to study them well and figure out the level from which the reversal may happen, you’ll be able to enter trades in better positions. Obviously, this should be your target.
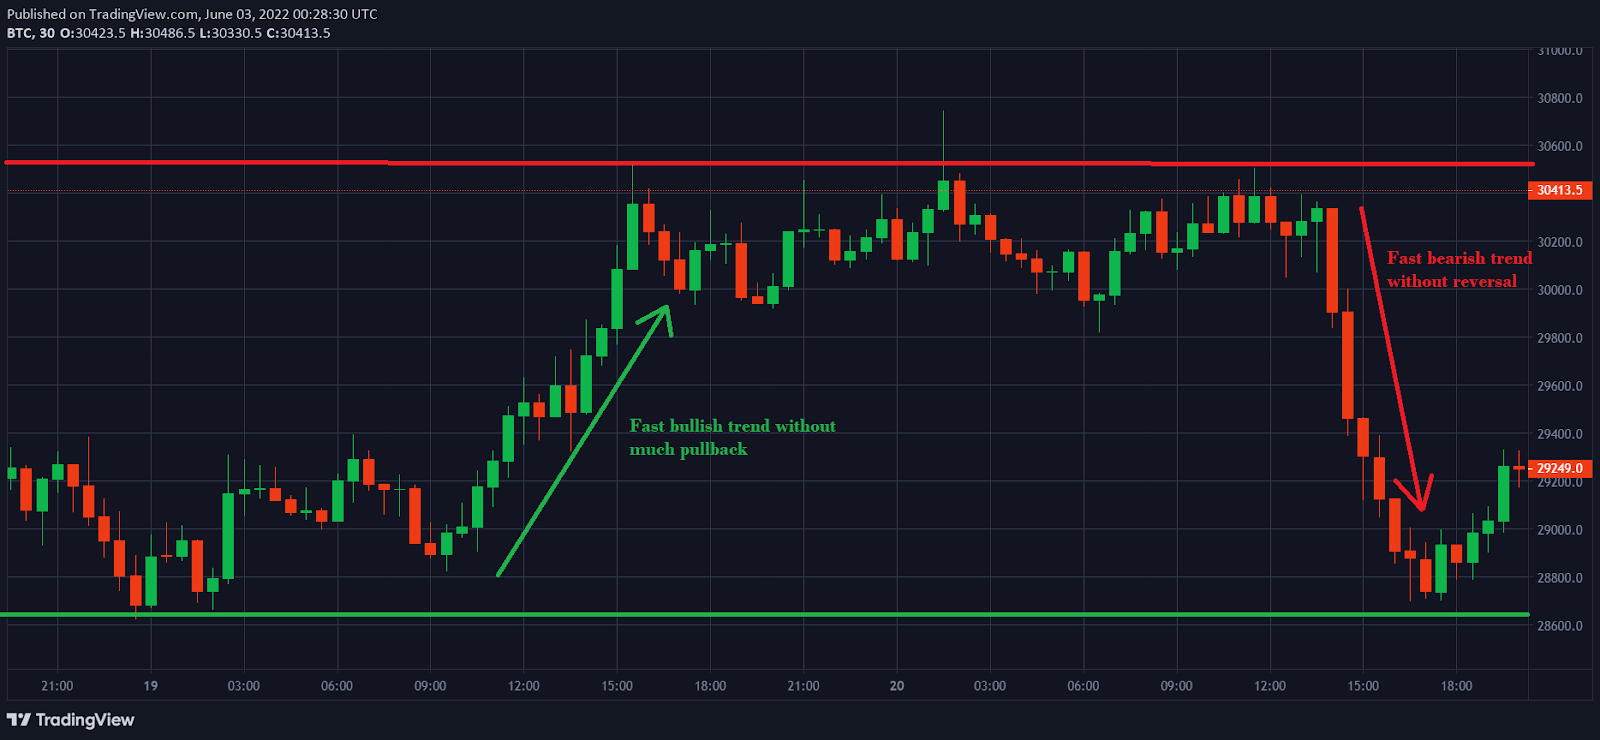
A good method of identifying overbought and oversold assets is by simply looking at the chart. A continuous bullish uptrend without any major pullbacks is an example of an overbought asset. A continuous bearish downtrend without any major bounces is an example of an oversold asset.
Although looking at charts is one way, the best way to identify overbought and oversold stocks is technical analysis using indicators. Effective technical analysis will lead you to your desired destination. A good technical analyst will be able to determine not only the way the current trend is moving, but also whether an asset has been overbought or oversold.
What are overbought and oversold indicators?
You already know what good technical analysis will do for you, but you need the appropriate tools to make your analysis. These tools are called technical indicators.
An overbought or oversold indicator is a technical analysis tool that measures how much a security has deviated from its fair price range. There are many indicators available on Margex, and some of them are more complex than others. Some of the most popular and effective ones are the relative strength index (RSI), Bollinger Bands, the Stochastic oscillator, and the Moving Average Convergence Divergence (MACD).
Margex’s user-friendly interface makes even the most complex instruments easy to use, but more on that in a bit. Let’s have a quick overview of the indicators mentioned above.
Relative Strength Index (RSI)
The Relative Strength Index (RSI) was first introduced in 1978 by J. Welles Wilder Jr. in his book called New Concepts in Technical Trading Systems.
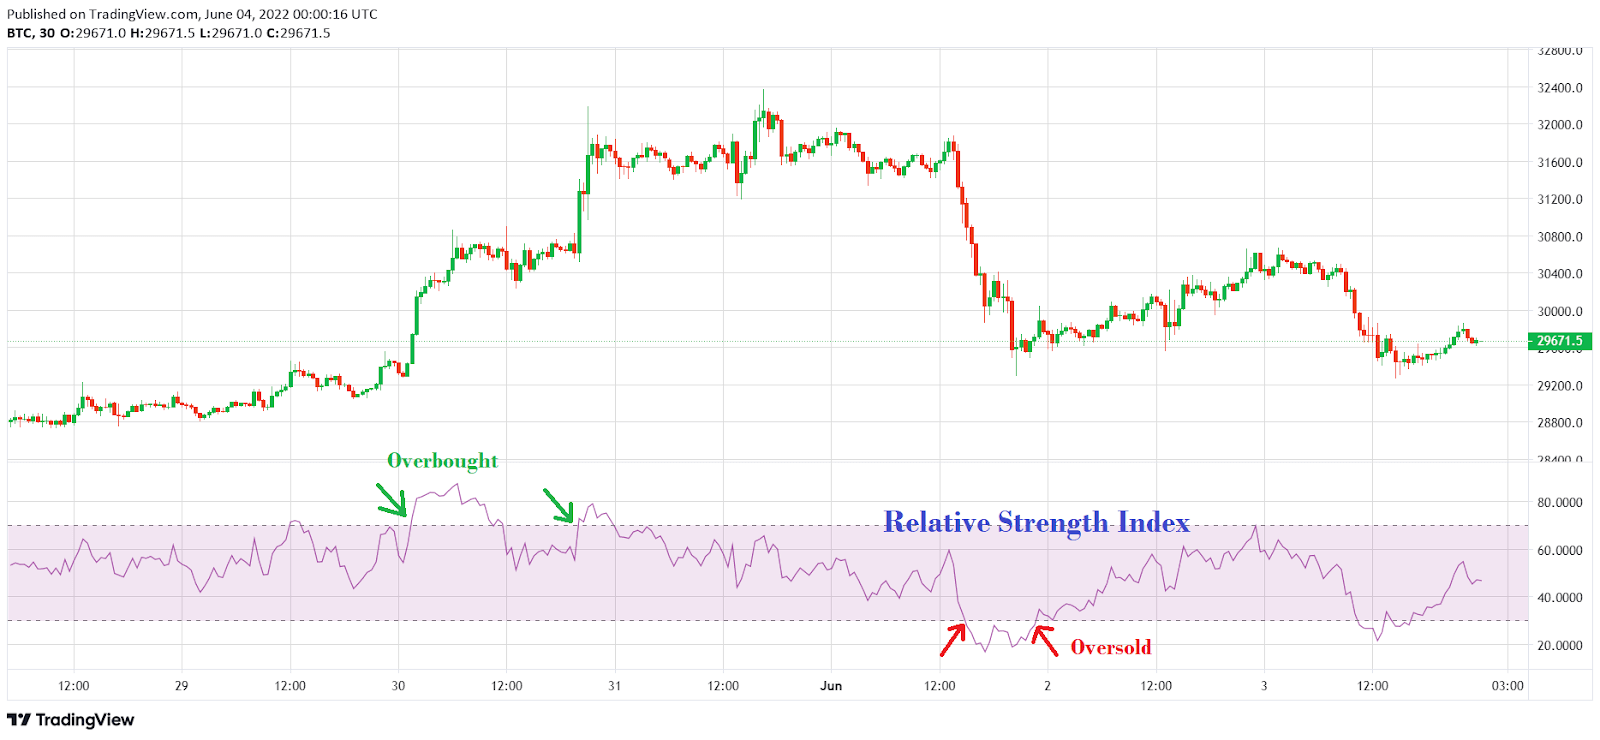
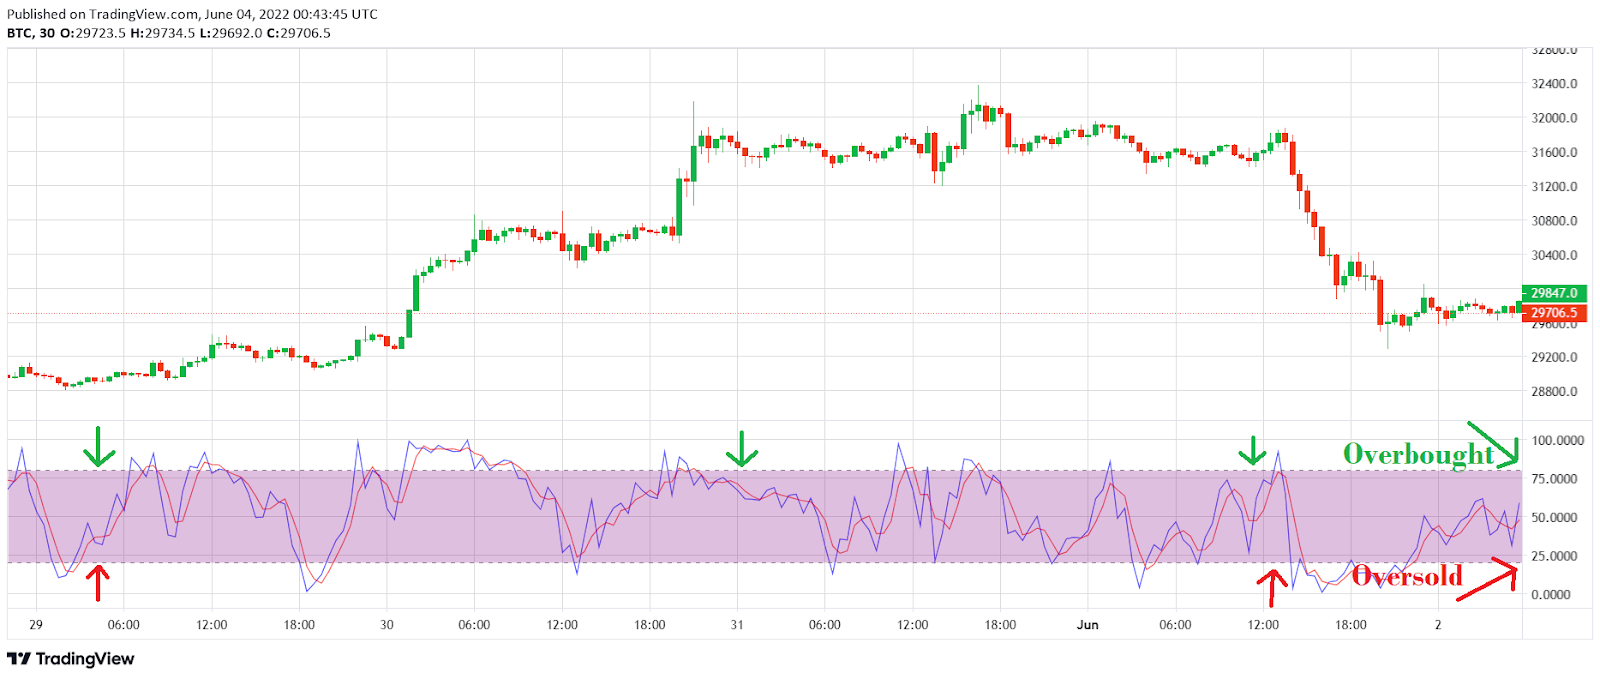
This is probably the most popular overbought and oversold indicator in crypto and stock trading. It is a momentum indicator that moves between two extremes which calculates the speed of the recent price change (usually 14 periods) of a cryptocurrency.
Reading the RSI is a relatively easy task because it is always fluctuating between 0 and 100. When the reading is above 70, the asset is considered overbought and a downtrend is possible. When the reading is below 30, it is oversold and an uptrend is possible.
It’s worth noting that the RSI is most effective in a ranging market. The market can also stay overbought or oversold for a long time, so it’s best to wait until it drops below 70 or rises over 30 before placing a trade.
Stochastic Oscillator
While the RSI tracks the speed of price change, the Stochastics Oscillator uses the Stochastics formula to compare the current price level to its range over time.
First introduced in the 1950s, the oscillator monitors the price movement within a given period (usually 14 periods). It’s similar to the RSI because it fluctuates between 0 and 100. However, instead of 70 and 30, it uses 80 and 20 as overbought and oversold levels.
The Formula for the Stochastic oscillator is
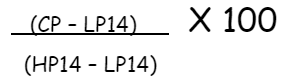
Where
CP is the current price
HP is the highest price over the last 14 periods (minutes, hours, days.)
Lowest P14 is the lowest price over the last 14 periods (minutes, hours, days.)
When used with the RSI, the Stochastic oscillator will be able to predict price corrections and breakouts.
Bollinger Bands
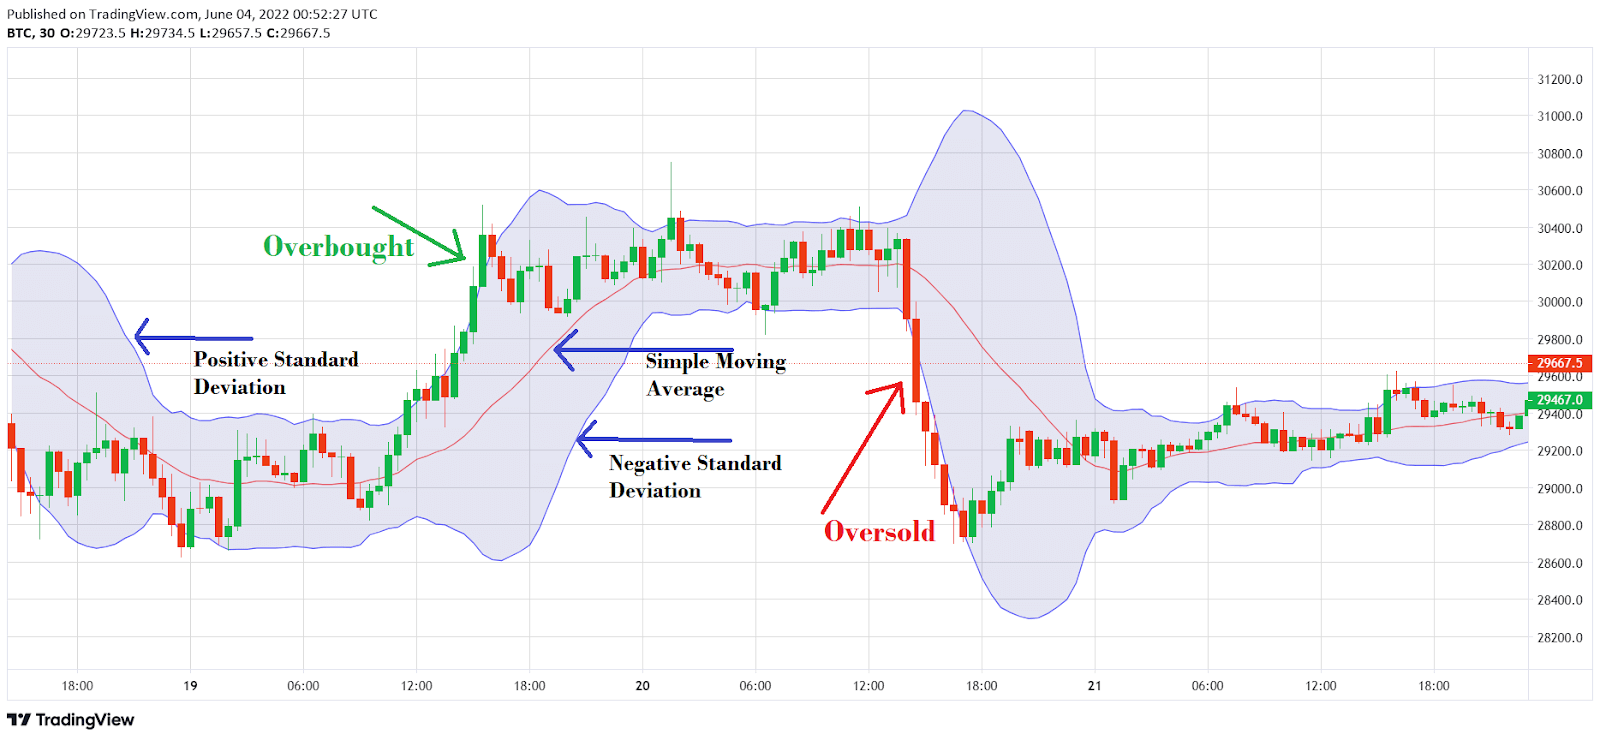
Bollinger bands, invented by John Bollinger in the 1980s, are also used to identify overbought and oversold markets. A Bollinger band consists of three lines: a simple moving average in the center, a positive negative standard deviation above the middle band, and a negative standard deviation below the middle band.
When the price goes over the upper standard deviation line, the market is said to be overbought. When it falls below the lower standard deviation line, the market is said to be oversold.
Moving Average Convergence Divergence (MACD)
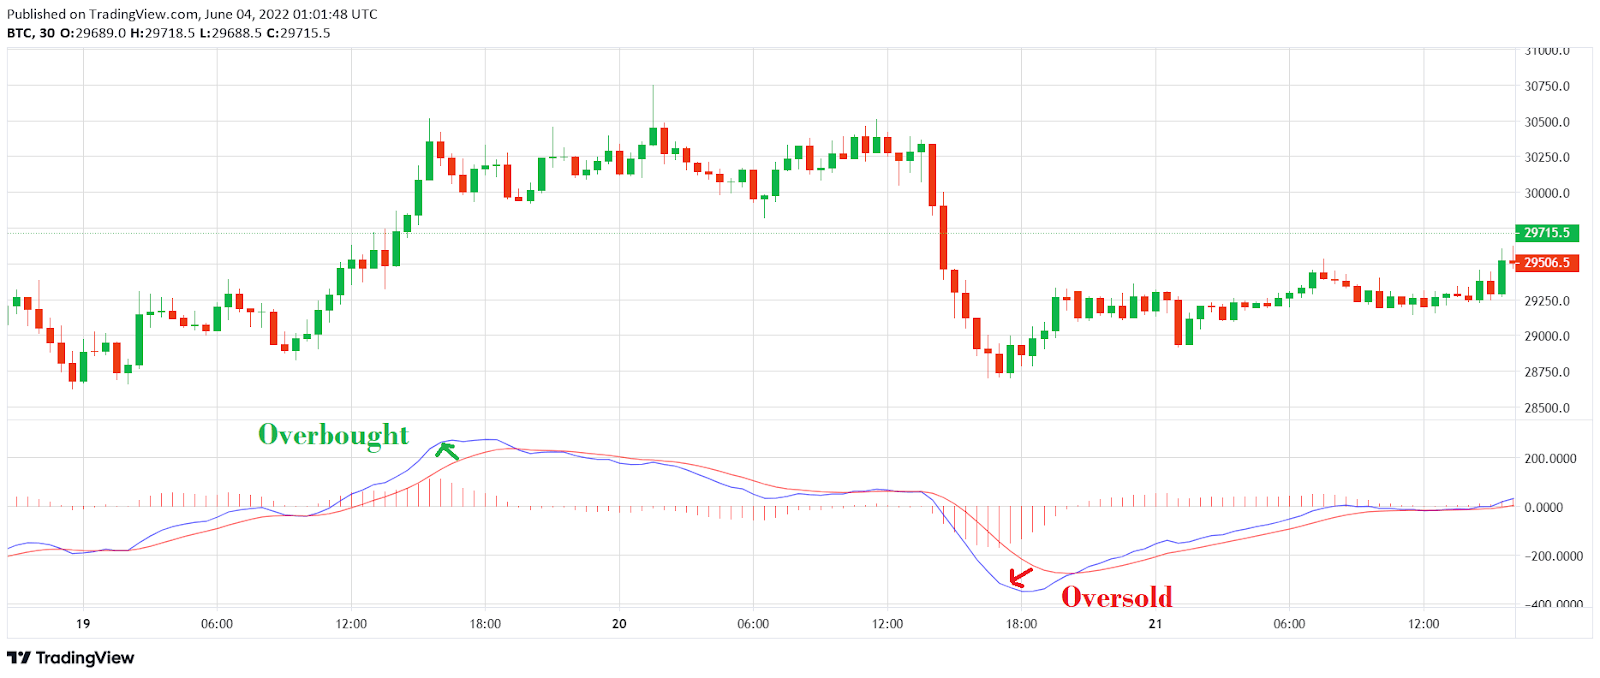
This indicator measures the difference between two exponential moving averages (EMAs). It is used to determine the strength of price fluctuations between the two EMAs and may be used to anticipate what direction the price will go.
The MACD, usually blue, is calculated by subtracting the 26-period EMA (SlowLength) from the 12-period EMA (FastLength). Then there is a red signal line, which is just a 9 period EMA line.
The MACD can be a bit complex but I’ll explain in simple overbought and oversold terms. When the signal line is much below the MACD line, the market is overbought. When the signal line is far above the MACD line, the market is oversold.
How Reliable Are Overbought and Oversold Signals?
When it comes to trading, overbought and oversold levels are a useful tool for making well-informed judgments. By recognizing whether a cryptocurrency is overbought or oversold, you make more accurate buying and selling choices. This reduces your risk of losing money.
However, you must be careful with these signals. Sometimes, a price reversal might not occur. Therefore, you should wait for the price to reverse or bounce before entering a trade. You can also pan out and do other analyses to understand the long-term situation of the market. Remember that you should always try to combine several indicators to have a better grasp of price direction.
How To Trade Overbought and Oversold Levels on Margex
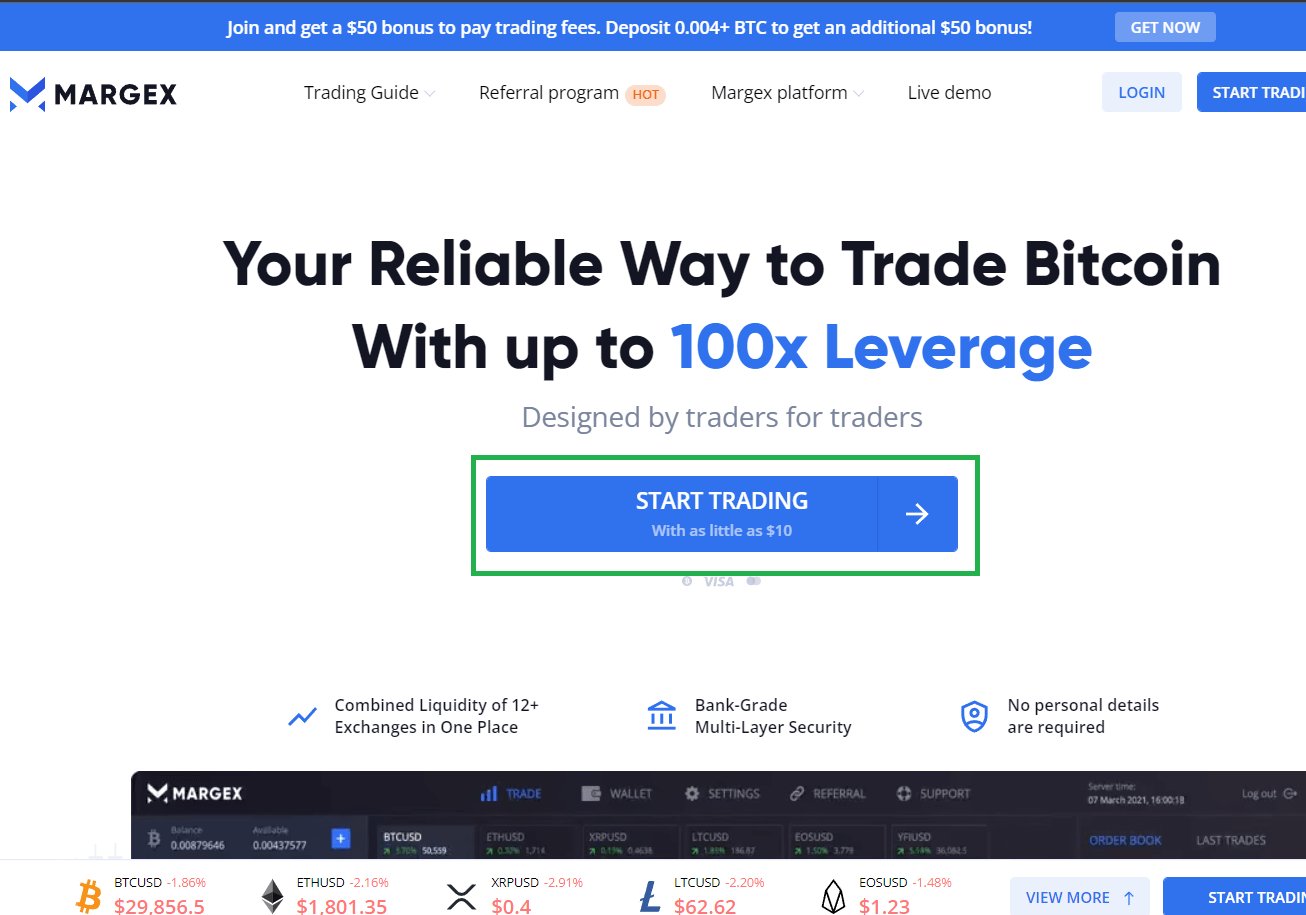
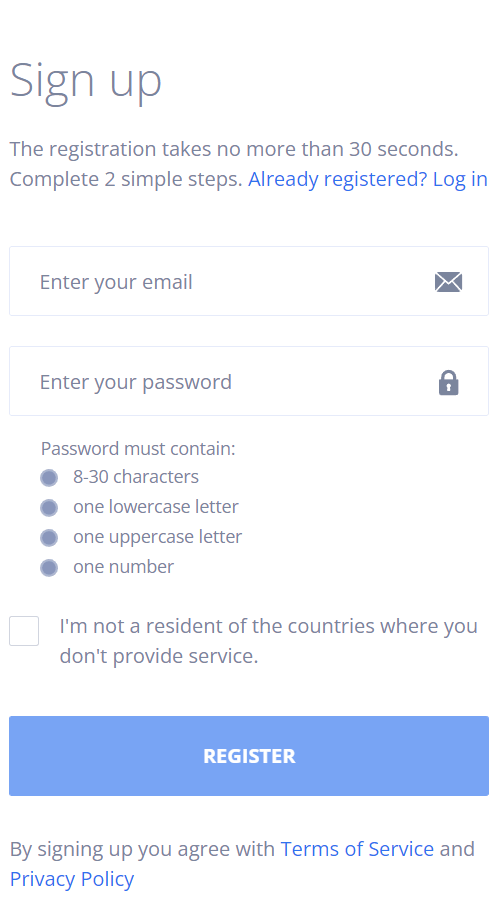
Step 1: Visit Margex.com to create a live trading account. Once you click on “Start Trading,” you’ll be directed to a Sign Up page where you’ll be prompted to fill in your details.
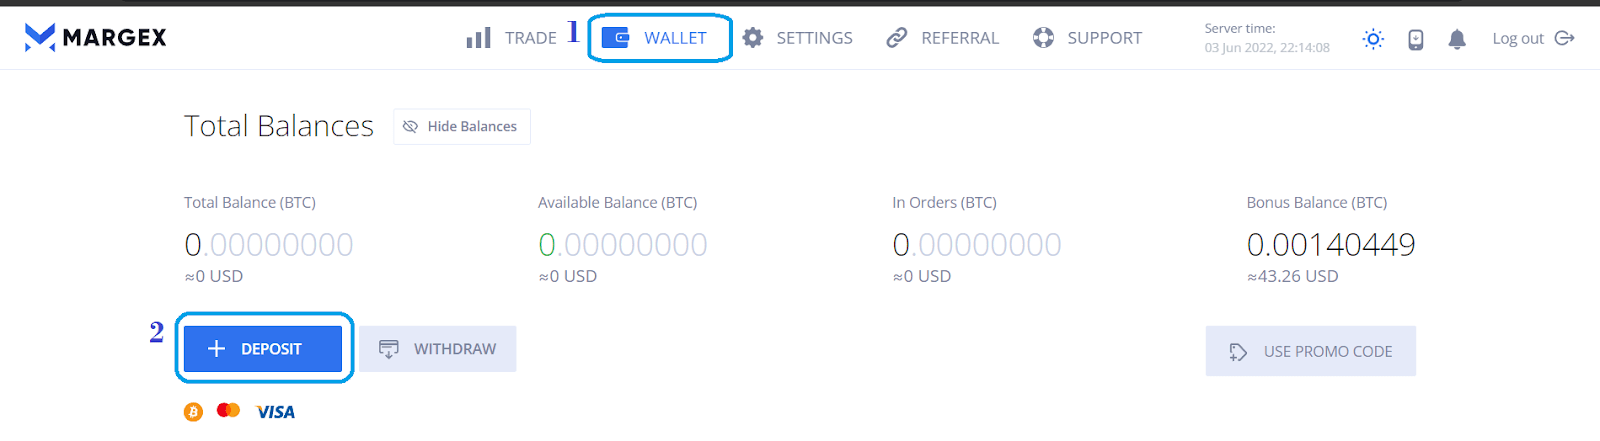
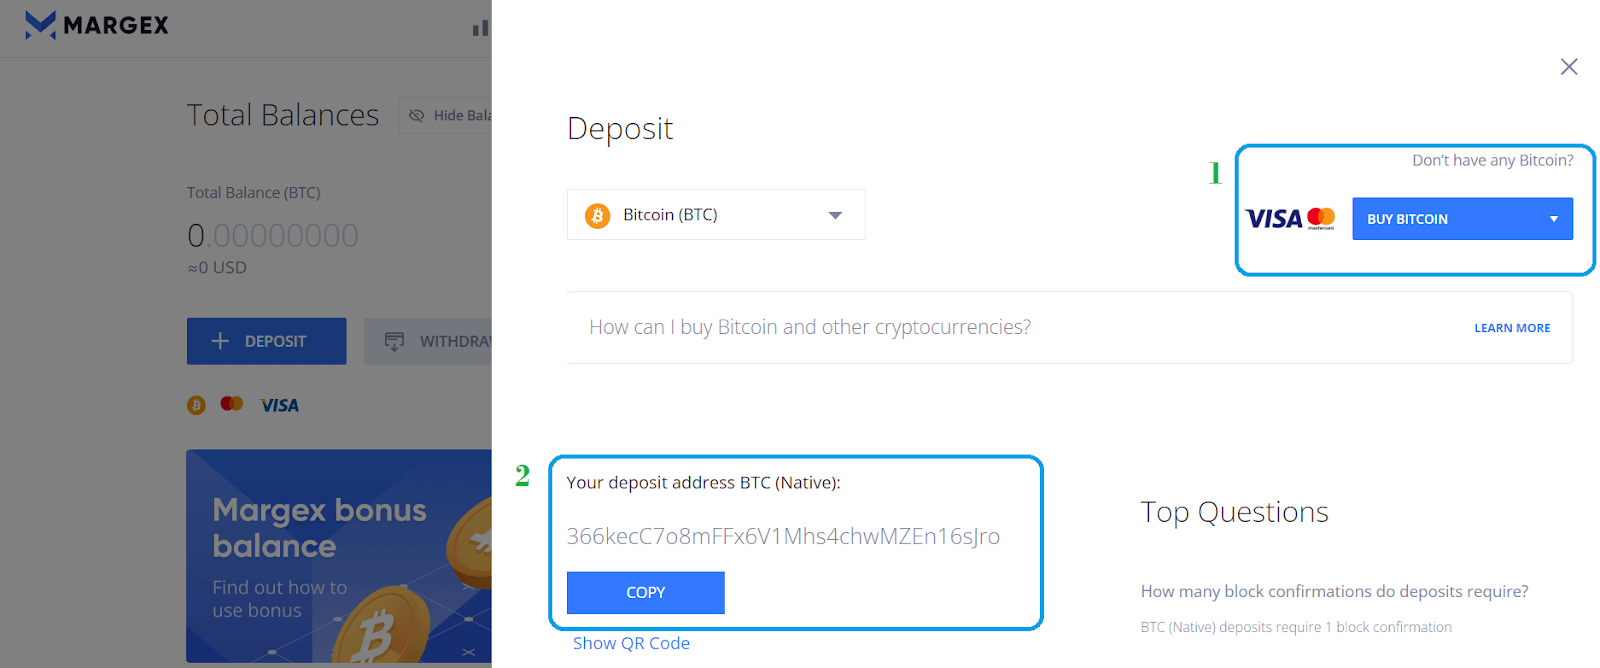
Step 2: Next, you need to deposit to begin trading. Click on the “Wallet page” and select “+Deposit.” You can fund your account by buying crypto through Changelly or ChangeNow. You can also deposit by copying your wallet address to transfer crypto to your Margex wallet.
Step 3: Return to the “Trade” page after a successful deposit to begin trading. You can select the cryptocurrency you wish to trade from the list of trading pairs available.
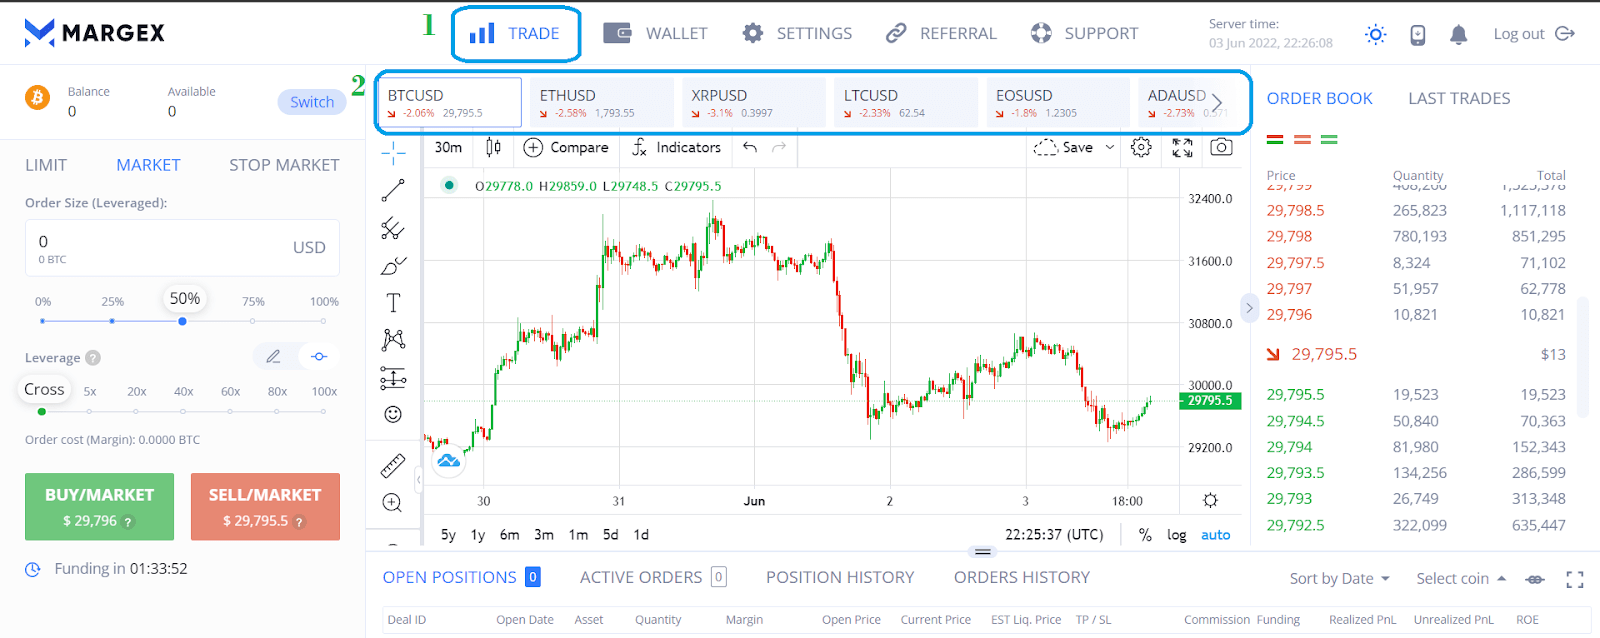
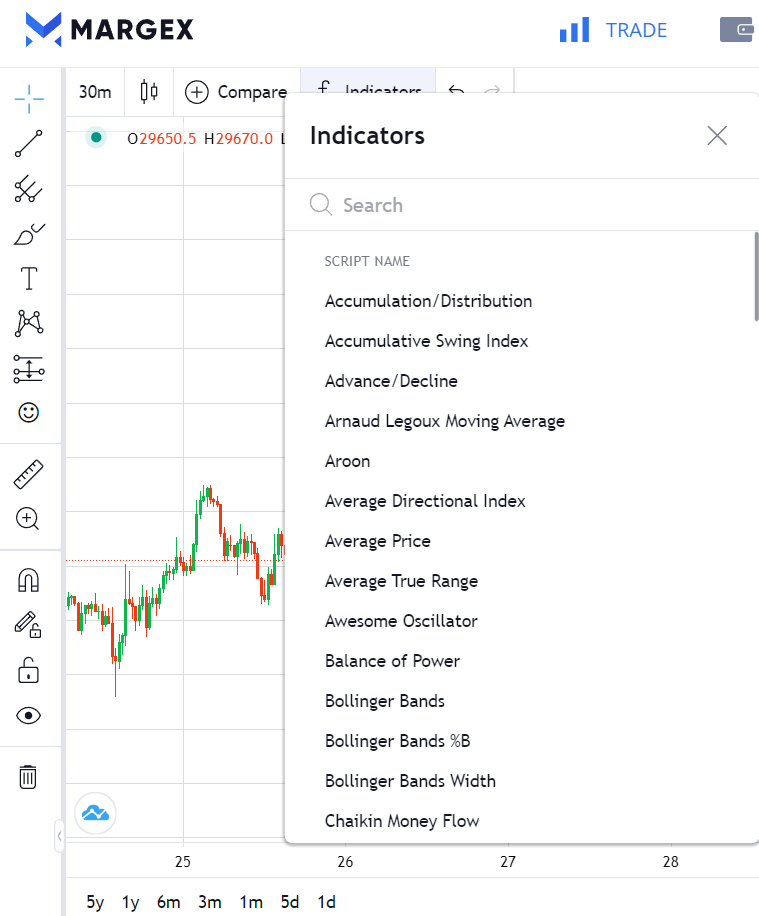
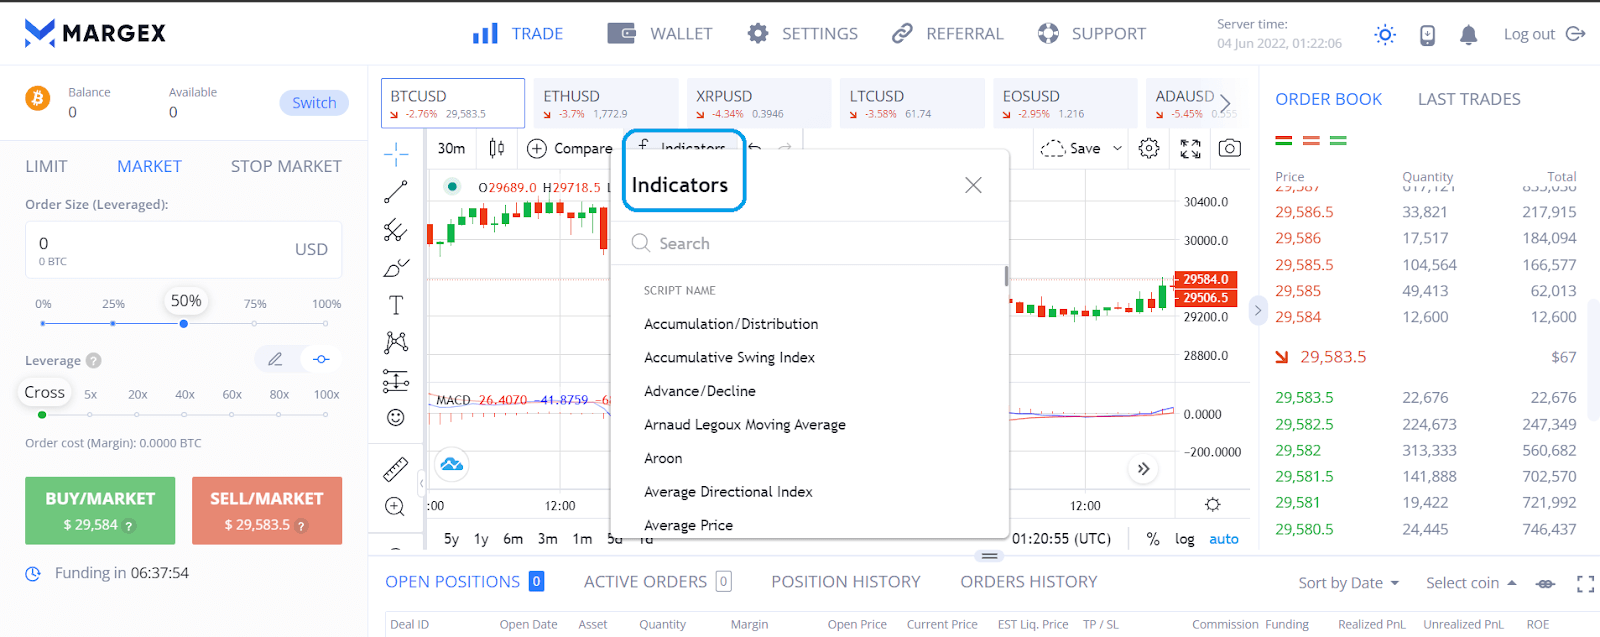
Step 4: Next, click on the “Indicators” tab to select any of the various indicators used to identify overbought and oversold conditions. For example, the Relative Strength Index. You can also combine multiple indicators for your analysis.
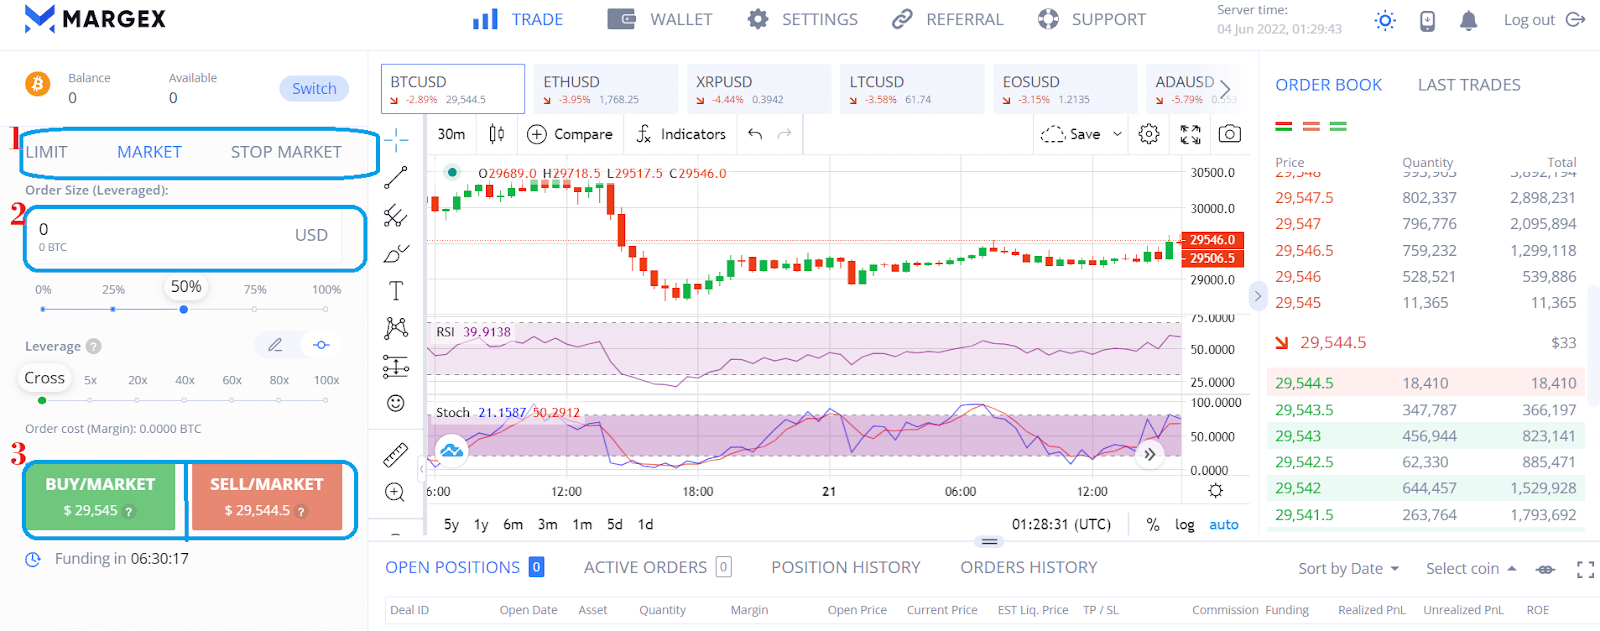
Step 5: The only thing left after you’ve completed your analysis is to start trading. You can choose from the limit, market, and stop market order types. Then you decide whether you want to go long or short. You can customize other things like the order size and use up to 100X leverage. Don’t forget to monitor and close your trade when due.
Examples Of Overbought And Oversold Conditions
Both overbought and oversold conditions can stem from news events around a particular crypto asset which leads to investor reaction. For example, a tweet from an important name like Elon Musk in support of a cryptocurrency like Dogecoin can draw the attention of investors. As more and more people buy, the asset price increases and a bullish trend is formed. This in turn, can lead to more buying. The hype around a project built on a blockchain can lead to its native cryptocurrency being overbought. A reversal can happen as soon as the hype begins to fade. Financial figures speaking against a cryptocurrency can lead to an oversold price.
FAQ
Is overbought or oversold better?
None of them is better than the other. Both overbought and oversold price conditions are simple and important concepts of crypto trading to be aware of. By understanding these concepts, you can make more informed decisions about when and what type of trade to enter.
Should I buy when RSI is oversold?
Yes, buying when your RSI indicates an oversold market is a good idea. That way, you make profit when a bounce happens. You can, however, wait for a bounce to appear before making a decision.
What is the best overbought/oversold indicator?
The RSI is the most effective indicator for a ranging market, while the MACD is the most effective indicator for a trending market. It is best to combine indicators for more informed decisions.


