
Trading in the financial market, such as crypto, forex, stocks, and indices, does not come with merely buying and selling assets. There is always a need to be updated and require all the necessary skills and techniques needed to outplay major players such as institutions in the financial market.
One of the major ways traders seek to have an edge in the market is through the mastery of technical analysis. Technical analysis of the financial market provides traders and investors with numerous opportunities to profit from the cryptocurrency, indices, forex, and stock markets. Being a very profitable trader and investor in the financial market necessitates much effort, dedication, and constant practice, not to mention psychological know-how.
Finding the best entry, exits, determining trends, and possible trend reversals are among the skills traders explore to become more profitable while maximizing profit with minimal risk exposure and preservation of capital.
Traders over the years and advanced traders sometimes struggle with different trading strategies as they wish to know what works best for the market and how to determine the top or bottom of a trend. This usually involves careful study and consistent practice of technical analysis and chart patterns with the help of indicators and identifying trend patterns.
Because of the advancing stages of the financial market and the volatility of prices, skilled and advanced traders sometimes struggle to identify the patterns that precede a trend and what comes next.
This guide focuses on rounding bottom chart patterns as one of the many technical analysis chart patterns for determining a change in the trend. A rounding bottom chart pattern is an analytical tool that can be useful in a trading strategy in the financial markets.
Technical Analysis And Market Phase: Why They Are Important To Learn
Technical analysis is the use of chart patterns, price actions, oscillators, and others by traders as tools to forecast the price movement of particular assets while executing trading strategies that will improve profitability and return on investment (ROI)
Although the use of chart patterns and other trading tools are what technical analysts use to determine an asset’s current trend, strength, support, and resistance, this information can seem not to be enough with the evolving trends in the crypto space; there are need to use more advanced techniques to predict price movement better.
Traders who combine market phases with their technical skills have better opportunities than traders who trade based on technical analysis as they are limited when it comes to knowing the market phase so as to adjust strategies to fit the market.
Acknowledging the phases in the market would help manage risk and get the best results out of the market. The market is divided into four phases: the accumulation phase, the distribution phase, the advancing phase, and the declining phase.
Accumulation Phase
When the market has bottomed, the market enters this phase. This stage is accompanied by innovative or construction ideas for traders, investors, and major players in the crypto space looking to buy and research top projects to make a very attractive return on investment when the market reverses bullishly.
Distribution Phase
Sellers are more dominant in this market phase, turning the market’s bullish sentiment into mixed signals as prices stay locked in a range for a few weeks or months.
Uptrend
With prices rising and creating swing highs, euphoria sets in as many people and beginners with little knowledge of crypto trading want to get involved, avoid the fear and greed of missing out, and jump on new trending things, such as memes and NFTs.
Downtrend
The final stage is usually the most painful and unfavorable for cryptocurrency traders and investors. Most assets depreciate and fall far below their initial value, potentially leading to capitulation.
A good understanding of the market phases combined with technical analysis could make a trader look invincible. Depending on the market trend, the trader will have a good idea of when to go long on a position or short. Let us consider how we can identify a rounding bottom chart pattern after a declining phase or bearish trend has occurred. A rounding bottom pattern helps traders to enter a long position as a trend reversal is imminent.
What Is A Rounding Bottom?
A rounding bottom pattern is a trend reversal pattern used by traders to identify the end of the downtrend signaling an imminent price reversal. The rounding bottom chart pattern is also known as the saucer bottom pattern with a “U” shape. A rounding bottom pattern or an inverse of a rounding top pattern gives traders an edge as the market could make a reversal from a downtrend with a gradual shift from a bearish trend to a bullish trend.
The rounding bottom chart pattern comprises a “U” shape rounded bottom and a neckline resistance. The rounding bottom pattern looks like a U shape comprised of an initial downtrend followed by an uptrend.
Once the is a break and close above the neckline resistance, this signals that the pattern is complete, and a trader could look to enter a long position.

The image shows a rounding bottom pattern made up of the left downtrend, right uptrend, and neckline resistance. This chart pattern occurs in any timeframe but finding the pattern and trading it right is what matters.
How A Rounding Bottom Works
A rounding bottom chart pattern looks like the cup and handle pattern, with them both having a U shape. The only difference is the rounding bottom pattern not having a downtrend called the handle for cup and handle pattern. The initial downtrend that makes the rounding bottom pattern results in excess supply leading to a decline followed by an uptrend indicating demand by buyers to push the price to the upside. The rounding bottom chart pattern completes a successful breakout, indicating a market reversal from a bearish trend to a bullish trend.
How To Identify A Rounded Bottom Pattern
The rounding bottom chart pattern is a bullish pattern used by traders to identify trend reversal from a bearish trend to a bullish trend. This chart pattern looks like a U shape; as soon as this pattern is formed, draw a resistance, also known as the neckline resistance, and assume this is a neckline for the rounding bottom pattern. The rounding bottom chart pattern is made up of the sell orders by traders that equal buy orders separated by a consolidation price between selling and buying pressure.
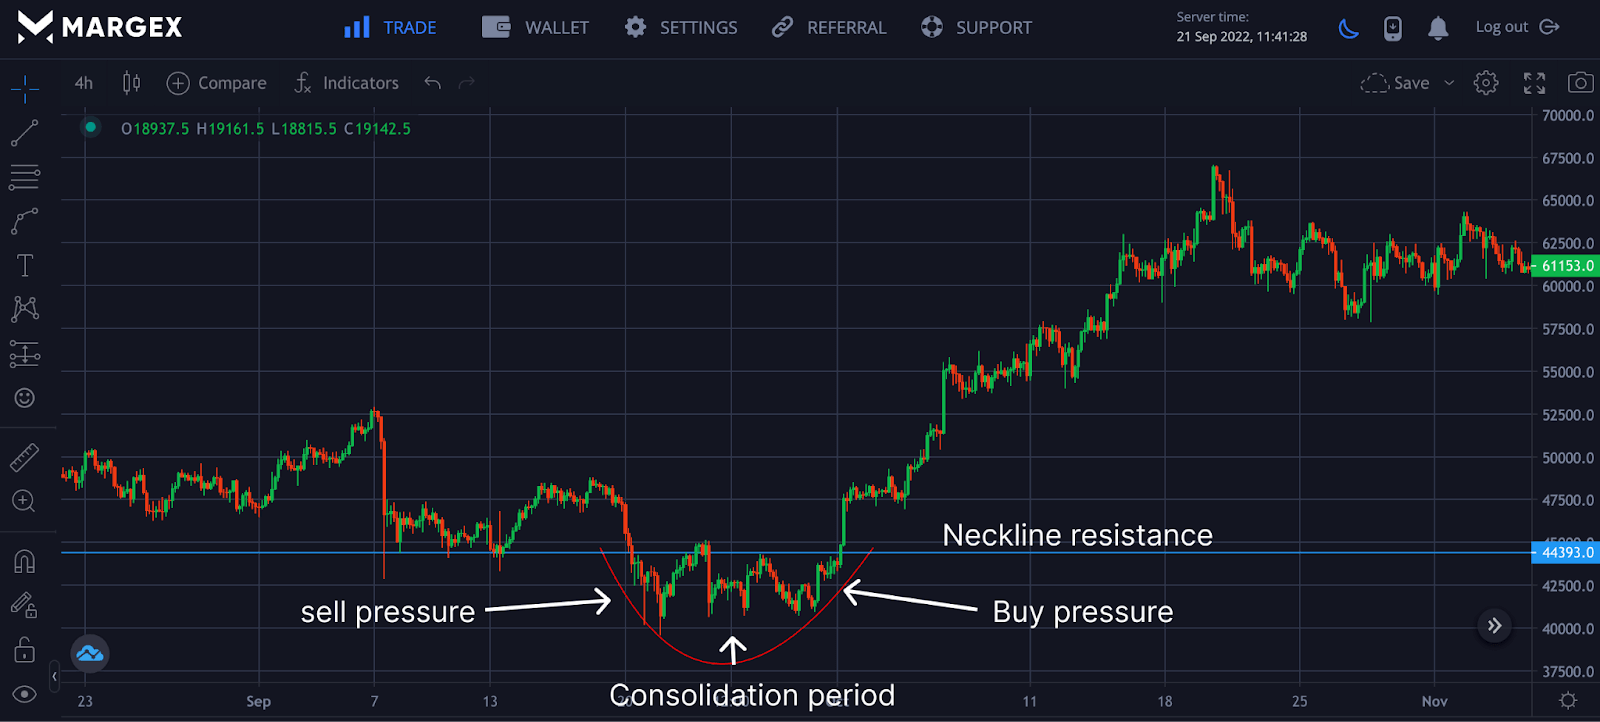
From the chart above using BTCUSD on the 4H chart as an example, the U shape is formed with selling and buying pressure separated by a consolidation period of prices. A break out above the neckline signals a rally and completion of the rounding bottom chart pattern. A trader can look to go long on the breakout above the neckline resistance. A clear picture of the above chart is a guide to trading the rounding bottom pattern.
- Identify the consolidation period of prices after sell and buy pressure.
- Identify the neckline resistance and draw out the line, as this will guide you for a long position on a successful breakout.
- On successful breakout from the neckline resistance, enter a long position while setting the stop-loss a few distances from the neckline resistance.
How To Trade The Rounding Bottom Pattern In 6 Steps
Now that we have the basic knowledge of trading the rounding bottom pattern, let’s see how we can trade this strategy using six simple steps.
Confirming The Rounded Bottom Figure
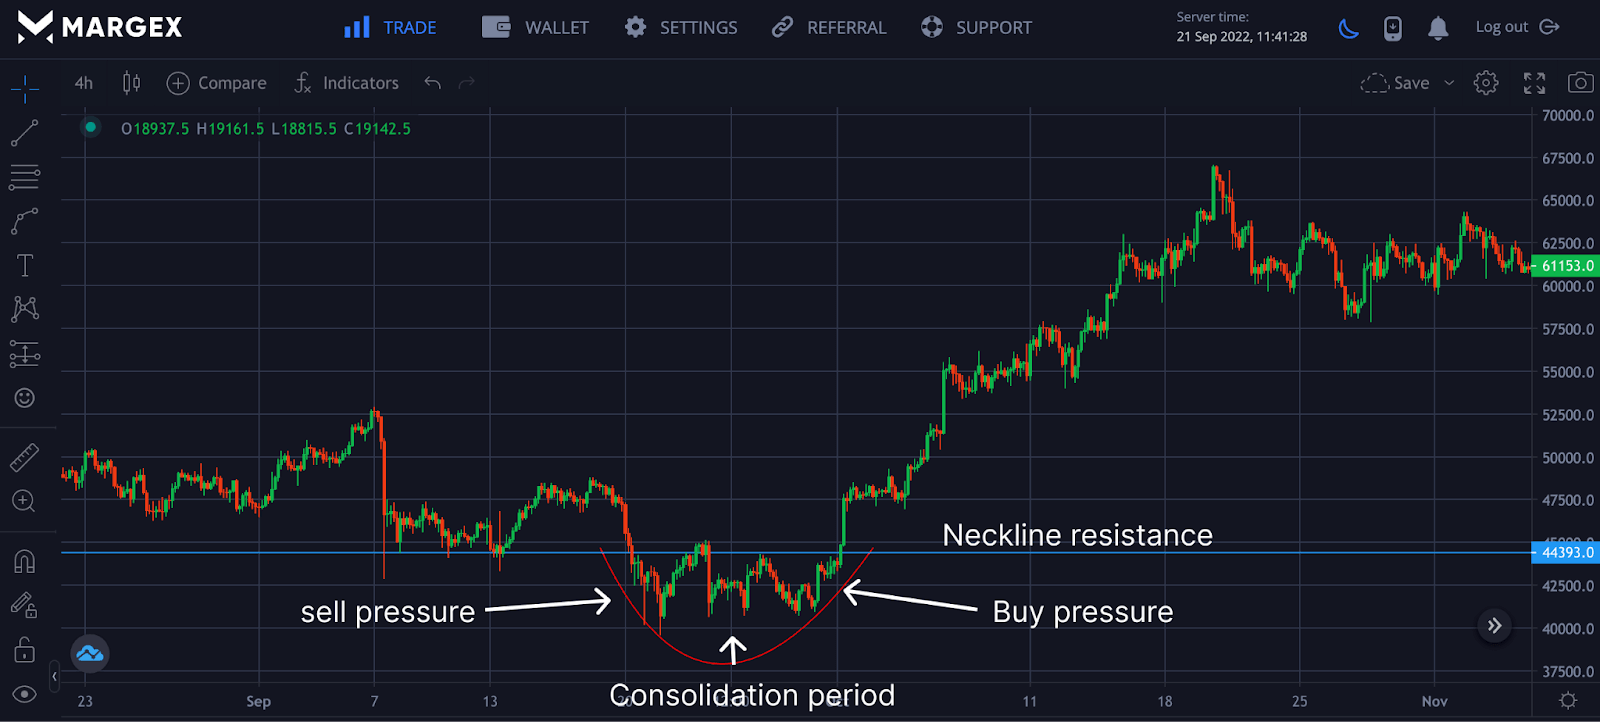
The rounding bottom chart pattern is made up of sell pressure followed by buy pressure with a period of price consolidation before buy pressure, as seen in the image.
Rounded Bottom Neck Line
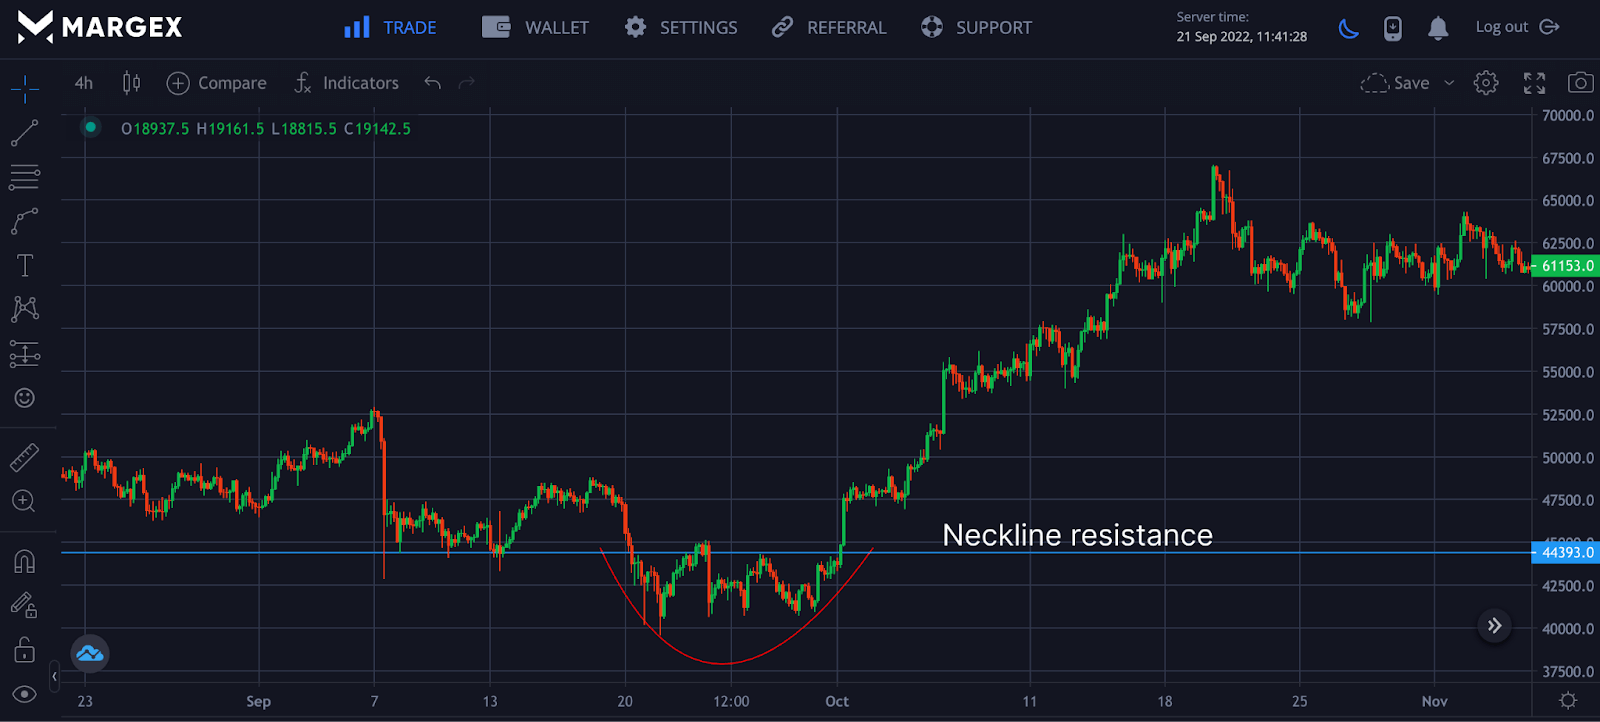
Identifying the neckline resistance after confirming a possible rounding bottom pattern is formed.
Rounded Bottom Breakout
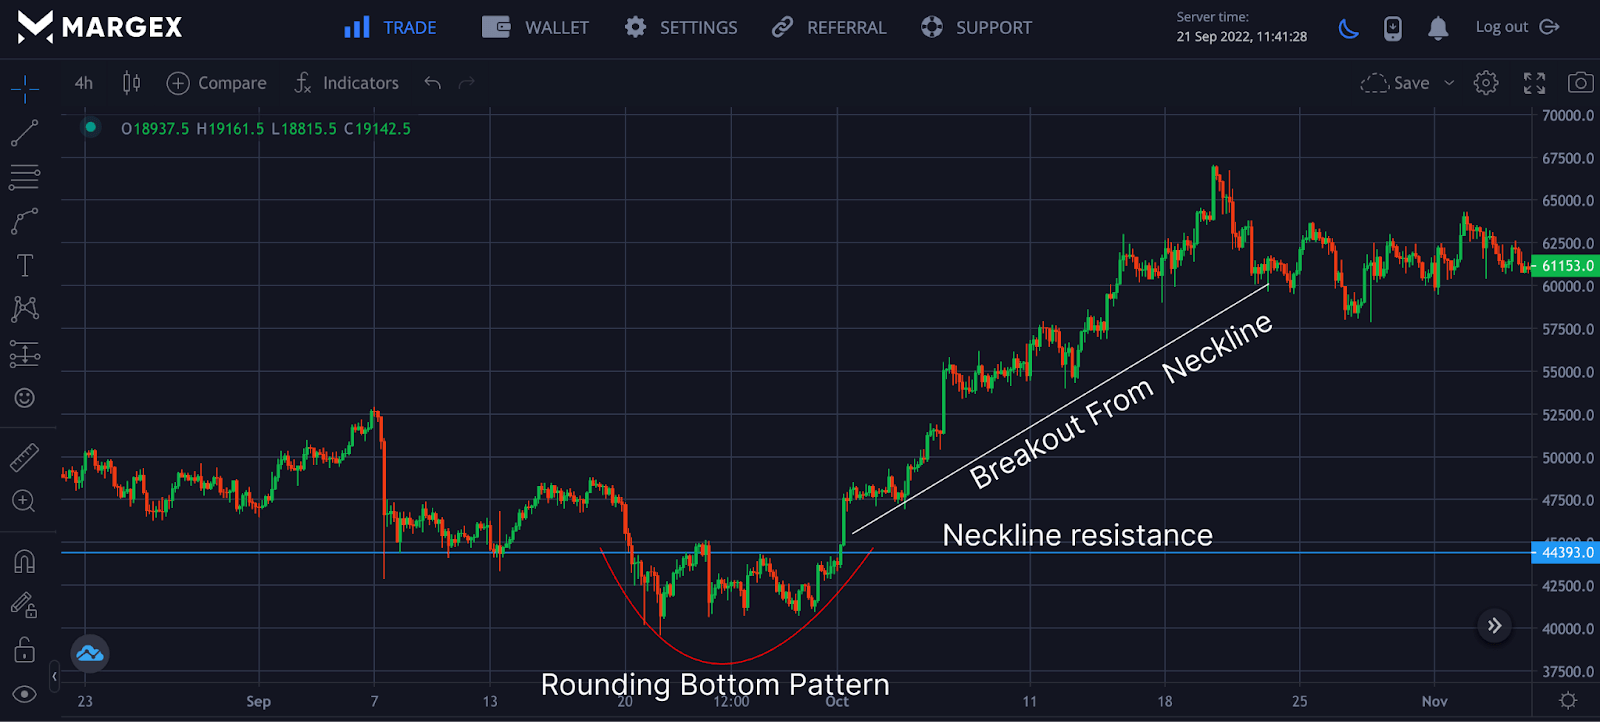
The rounding bottom pattern is complete when the price breaks out of this trend above the neckline; the pattern is said to be complete with traders looking for an opportunity to long the breakout.
Round Bottom Trade Entry
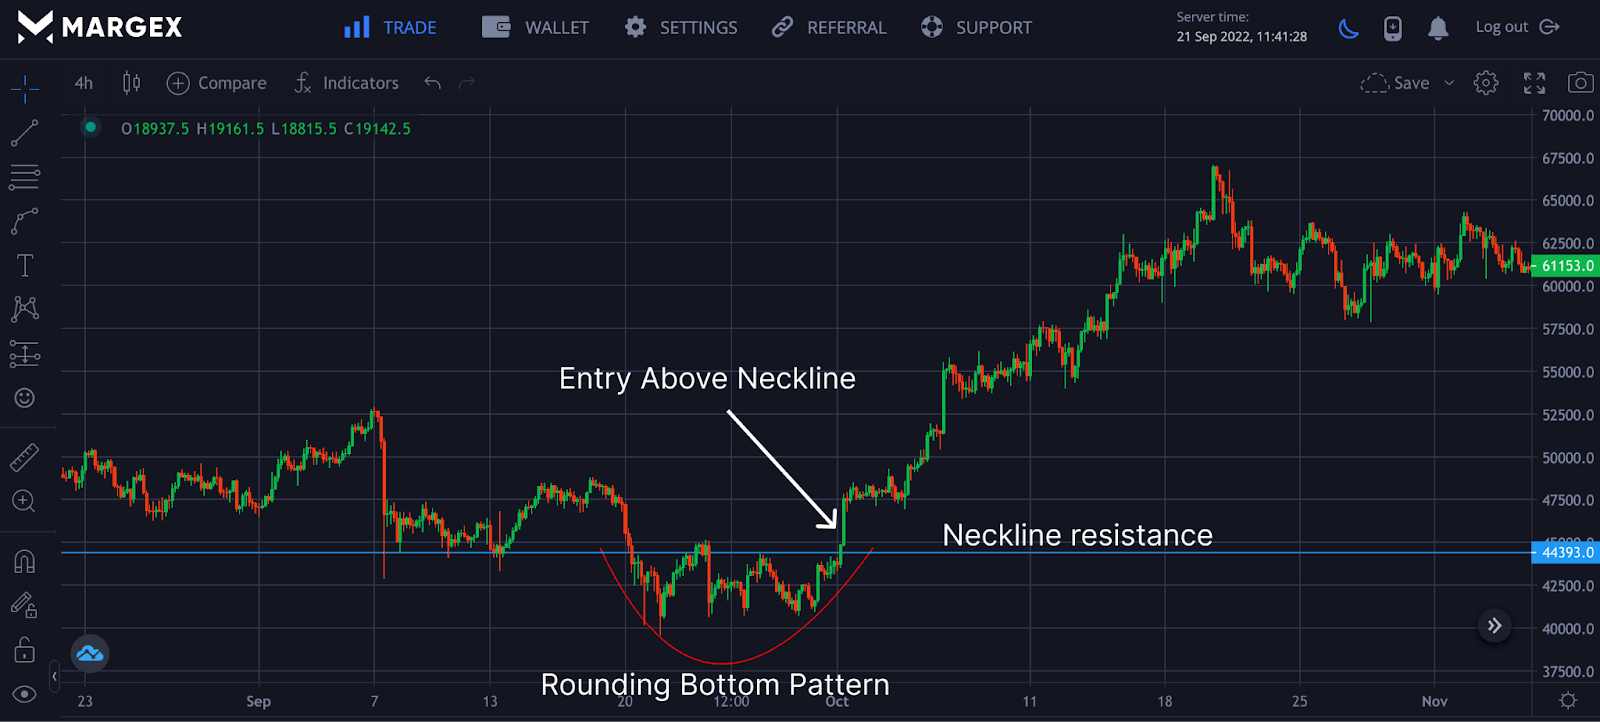
On successful breakout above the neckline, you should look to enter a long position on retest or a few distances above the neckline breakout.
Round Bottom Stop Loss
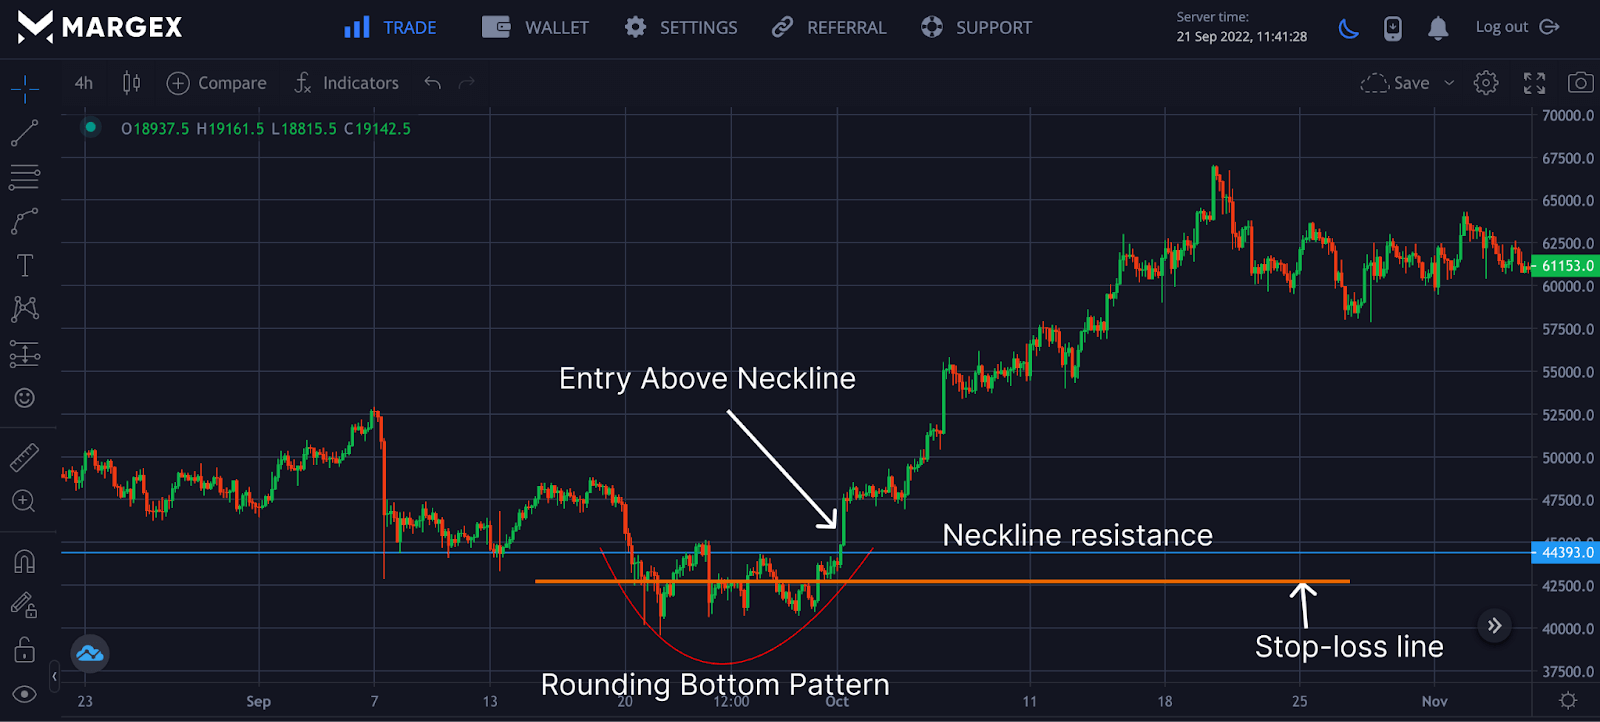
Like other technical analysis strategies, the rounding bottom chart pattern is not 100% certain and would be good to play safe with the help of stop-loss to minimize the risk exposure. Stop-loss orders should be set a few distances from the neckline and could be the previous swing low to be on the safe side and avoid stop hunting.
Rounding Bottom Target
The target is twice the size of the rounding bottom pattern, and as soon as the target is hit, you should look to exit the position.
Rounding Bottom Trading Example
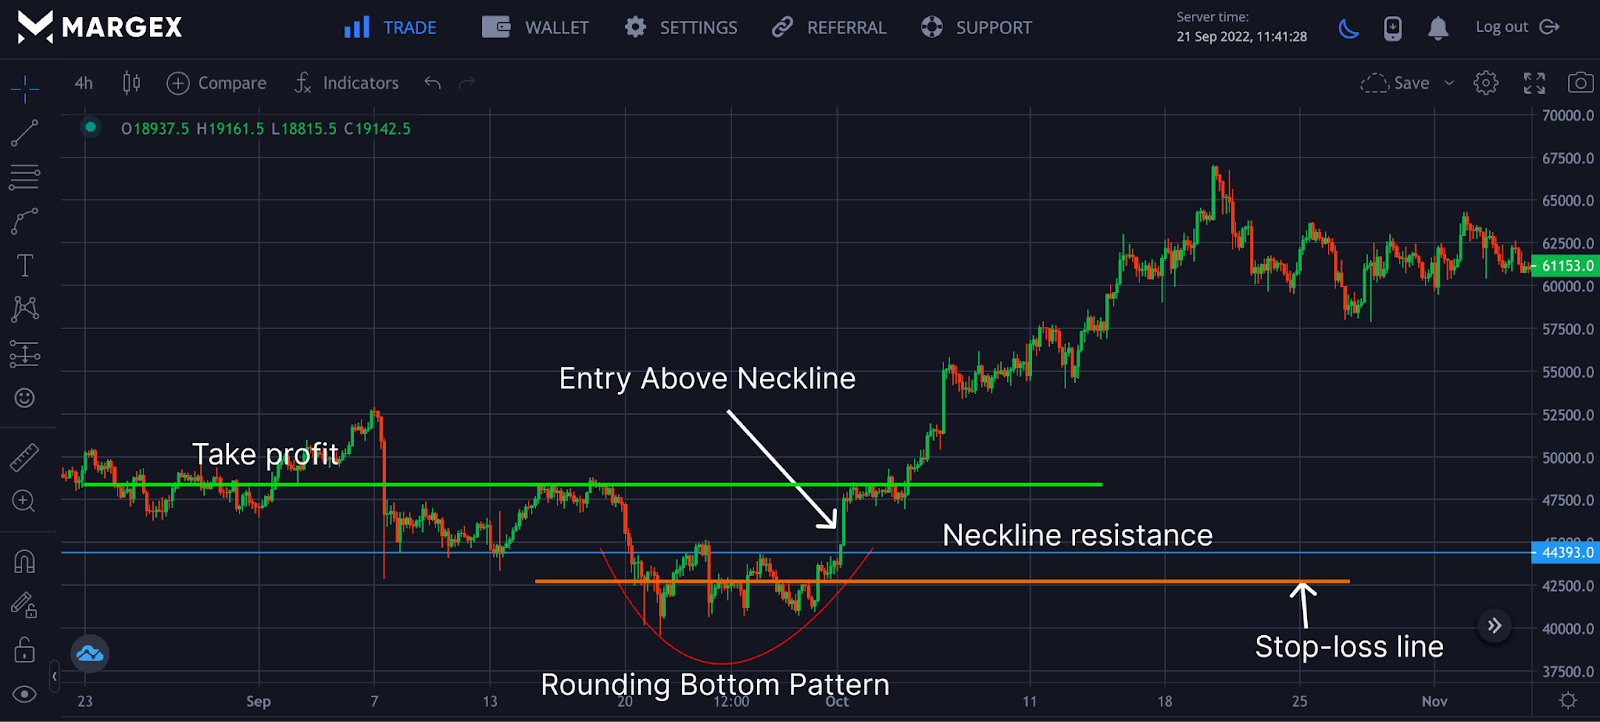
Haven considered the steps necessary to identify and trade the rounding bottom chart pattern; let us consider how to apply this using the 4H timeframe with the BTCUSD pair as an example. On identifying sell pressure followed by buy pressure with price consolidation separating sell and buy orders, try to identify the neckline resistance.
Wait for the breakout above neckline resistance, showing the rounding bottom pattern is complete, before opening a long position.
Set your stop loss a few distances from the neckline resistance, which could be the previous swing low. Set your take profit. This could be twice the size of the rounding bottom pattern or the next major resistance in the same timeframe.
How to Trade Margex Using the Rounding Bottom Candlestick Pattern
Margex is a bitcoin-based derivatives platform that allows traders to trade up to 100x in leverage size, and at the same time, you can stake your tradeable assets with the help of their unique staking feature to earn up to 13% APY returns.
All you need to do is to create a Margex account, and if you are an existing user, you can log in to access all the features of Margex, including free trading tools, for your convenience.
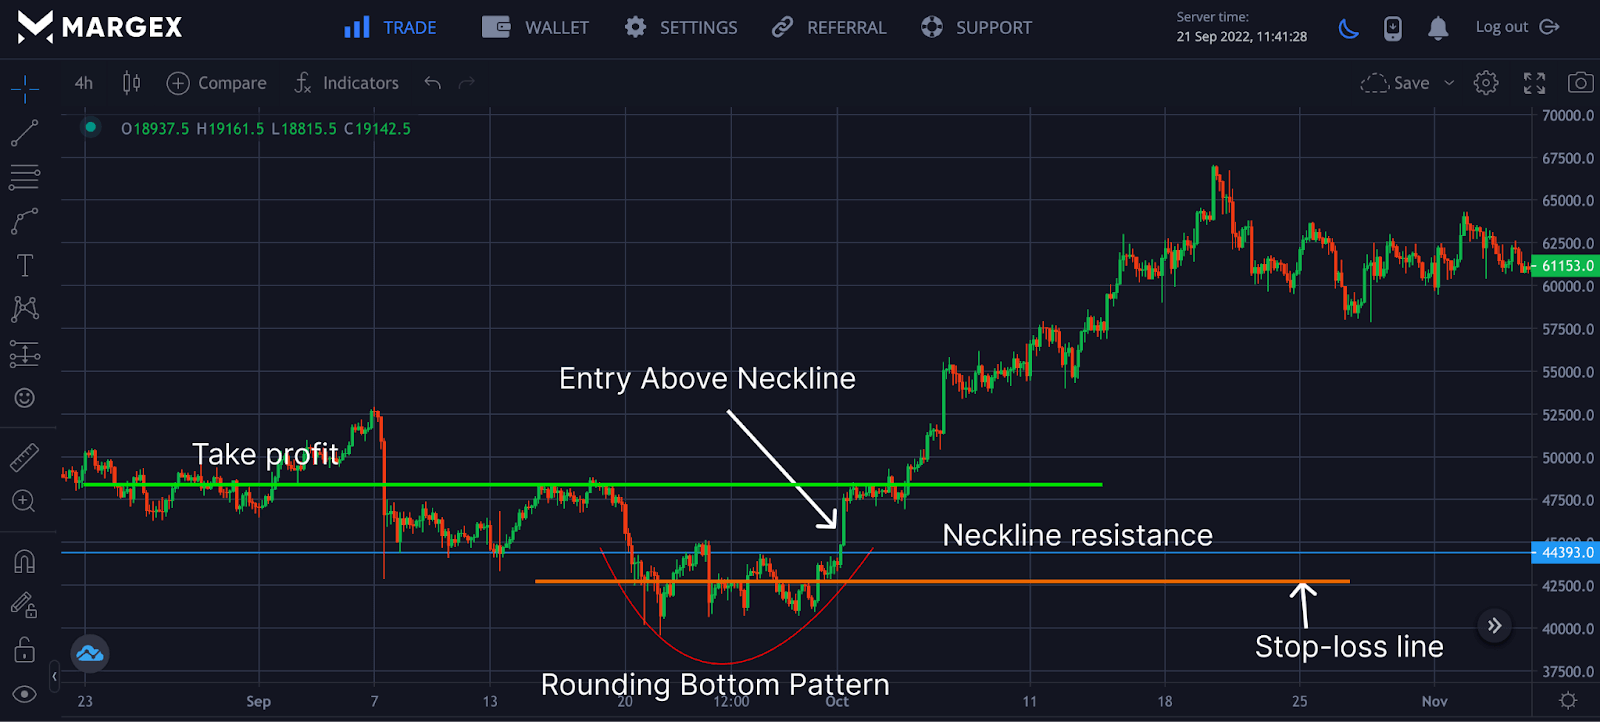
Margex unique UI helps even beginner traders to trade easily and utilize the technical analysis tools available to spot great bullish patterns like rounding bottom pattern from the chart above or bearish patterns to open a long or short entry position.
Add Momentum Indicators – MACD And RSI
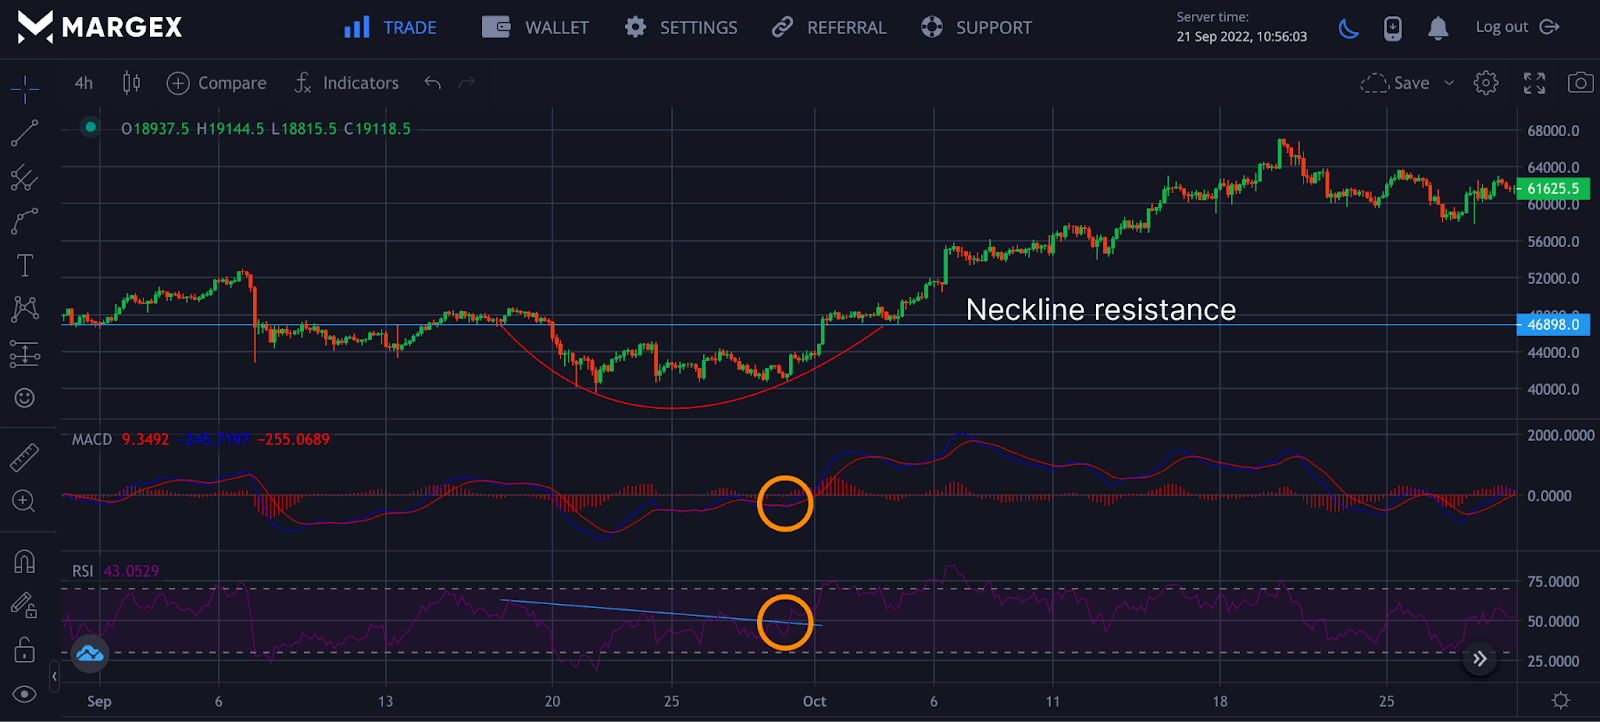
To verify the end of a trend with this pattern, it is necessary to combine it with Moving Average Convergence Divergence (MACD) and Relative Strength Index (RSI) to confirm the trend reversal.
From the chart, the MACD made a crossover while the RSI broke out of the downtrend, indicating a change in trend, as this was confirmed by the breakout above the neckline of the rounding bottom pattern. This indicated a shift from sellers to buyers; a trader can look to open a long position.
Rounding Bottom Pattern And Fibonacci Retracement Levels
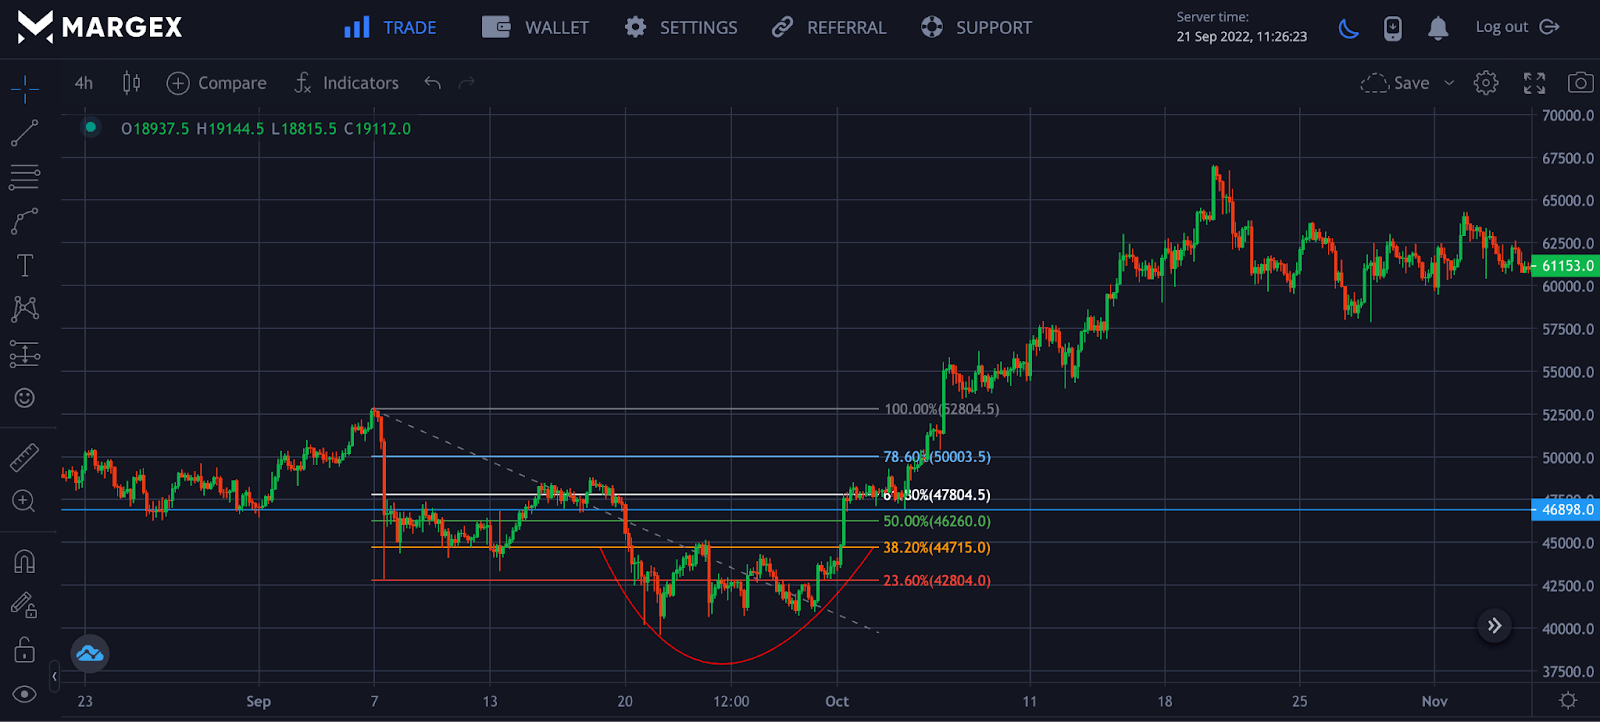
The rounding bottom chart pattern is a trend reversal strategy employed by most traders to spot the end of a trend.
The Fibonacci retracement is another technical analysis tool used to trade the rounding bottom pattern strategy. The values of 0-38.2% Fib show the round bottom pattern was formed with a breakout above 38.2% as the price rallied to 61.8%, where profit was taken.
The Fib value is drawn from one swing high to a swing low.
A Variation Of The Rounding Bottom Pattern
The cup and handle chart pattern is a variation of the rounding bottom chart pattern. The cup and handle chart pattern deviates slightly away from the rounding bottom pattern with a slight bearish pullback on a breakout making the handle. The cup and handle pattern is traded similarly with the rounding bottom pattern on successful break out above the neckline.
Rounding Bottom: Trading Tips
As discussed above, here is a quick tip to trade the rounding bottom strategy.
- Identify price consolidation between sell pressure and equal buy orders.
- Identify neckline resistance to confirm this is a rounding bottom pattern.
- Wait for a breakout above the neckline before opening a long position.
- Set stop loss and take profit.
The Rounding Bottom Pattern – Pros and Cons
Like every bullish pattern, there would be pros and cons when using the rounding bottom strategy in your trading setup.
The pros of using a rounding bottom chart pattern include well-defined stop loss and take profit and can be used with other trading tools like Fibonacci retracement ratios and momentum indicators.
The cons of using the rounding bottom pattern include difficulty identifying and spotting them. This strategy is more suited for long-term trades and mostly employed by long-term investors.
Frequently Asked Questions On Rounding Bottom Chart Pattern
How Accurate Is Rounding Bottom Pattern?
Traders leverage rounding bottom pattern formations as possible confirmations for a bullish price reversal. The rounding bottom pattern is only as accurate if applied and utilized properly by traders and cryptocurrency investors.
Traders may need to put into consideration factors such as resistance zones at the neckline of the rounding bottom, the timeframe used in spotting rounding bottoms, and bullish confirmations from the use of other technical indicators.
Leveraging trading platforms and exchanges such as the Margex trading platform enable
Traders have access to a variety of technical tools and indicators in trading rounding bottoms.
Is A Rounded Bottom Bullish?
A rounded bottom formation may signify a bullish bias or a bullish price reversal after a long consolidation period. Traders identify and spot rounding bottoms as areas of interest to enter a long position in the cryptocurrency markets.
Most traders may use a weekly chart timeframe to inform decisions on a rounding bottom formation as it gives a clear picture of rounding bottoms, downtrends, and price consolidations for a long period of time.
In the event of rounding bottom formations, smart traders may employ other technical indicators such as the volume indicator to validate and aid confirmations on buy entries.
When Is The Right Time To Enter A Position Using The Rounding Bottom Chart Pattern?
Traders may enter a long position when the price of an asset moves and trades above the neckline of the rounding bottom.
Traders and investors may keep an eye on rounded bottom patterns at the end of a bearish trend since it most likely signifies a bullish reversal chart pattern.
Applying technical drawing tools may also help traders identify key resistance at the neckline of the rounding bottom.
Once the price has broken resistance, traders may enter a long position while using other technical indicators to validate a bullish reversal.
How To Measure The Profit Target When Using The Rounding Bottom Chart Pattern?
Traders may effectively measure profit targets when using the rounding bottom chart pattern by looking and paying attention to the size of the round bottom pattern when it forms.
With that in mind, traders may use technical drawing tools in equating the size of the rounding bottom pattern to that of the prospective breakout candles on the price chart.
Once a breakout occurs and candlesticks reach equal sizes of previous rounding bottom formations, traders may consider closing a position in profit when the price reaches the target
What’s The Difference Between The Rounded Bottom Pattern And The Cup And Handle Chart Pattern?
The rounded bottom pattern and the cup and handle pattern are obviously comparable in appearance and formation.
A rounding bottom pattern, however, is a bullish trend reversal pattern that appears in some cases after a downtrend or long price consolidations.
Whereas a cup and handle chart pattern is a bullish continuation pattern that may see increased price action and bullish momentum in volume and price of an asset.
Unlike the cup and handle chart pattern, the rounded bottom pattern does not include the “handle” as seen on a cup and handle pattern but rather features a neckline and a rounded bottom.


