
Forex, stocks, cryptocurrency, indices, and other financial markets present many opportunities for all traders and investors. Still, due to economic changes, technology, and other sentiments, the financial market keeps seeing a change or evolution in the strategies employed by traders to maintain a good profitable system.
Cryptocurrency traders have adopted so many technical indicators ranging from simple moving average (SMA), exponential moving averages (EMA), average directional index (ADX), Ichimoku, and SAR indicator, all in the name of finding the trend of the market and high probability setup to outsmart the market makers.
Over the years, it has been widely spoken that the market moves in trends, and to be a profitable trader, you need to make the trend your friend, as this will help you make profitable gains. Determining the trend in the market though simple but can prove to be daunting when you are not used to the crypto market.
Knowing the direction of the market saves you as a trader time, energy, and money from putting it in the wrong direction. Knowing the market trend and combining this strategy with trend-following oscillators and indicators like parabolic SAR will increase your profitability immensely. The parabolic SAR was developed by J.Welles Wilder, the same creator of the indicator Relative Strength Index (RSI).
In this guide, we will focus on identifying a trend, using the SAR indicator to trade the trend, and how to set stop loss using the SAR indicator.
What Is Parabolic SAR?
Parabolic SAR, also known as the Parabolic stop and reverse, is a trend-following technical indicator employed by traders to determine the market’s direction, entry and exit, and price reversals for a particular trade.
Trend-following indicators are technical analysis tools that convert mathematical data, graphs, and charts to show the market’s visual representation of price direction.
These indicators include Bollinger bands, Moving Averages, and the SAR indicator.
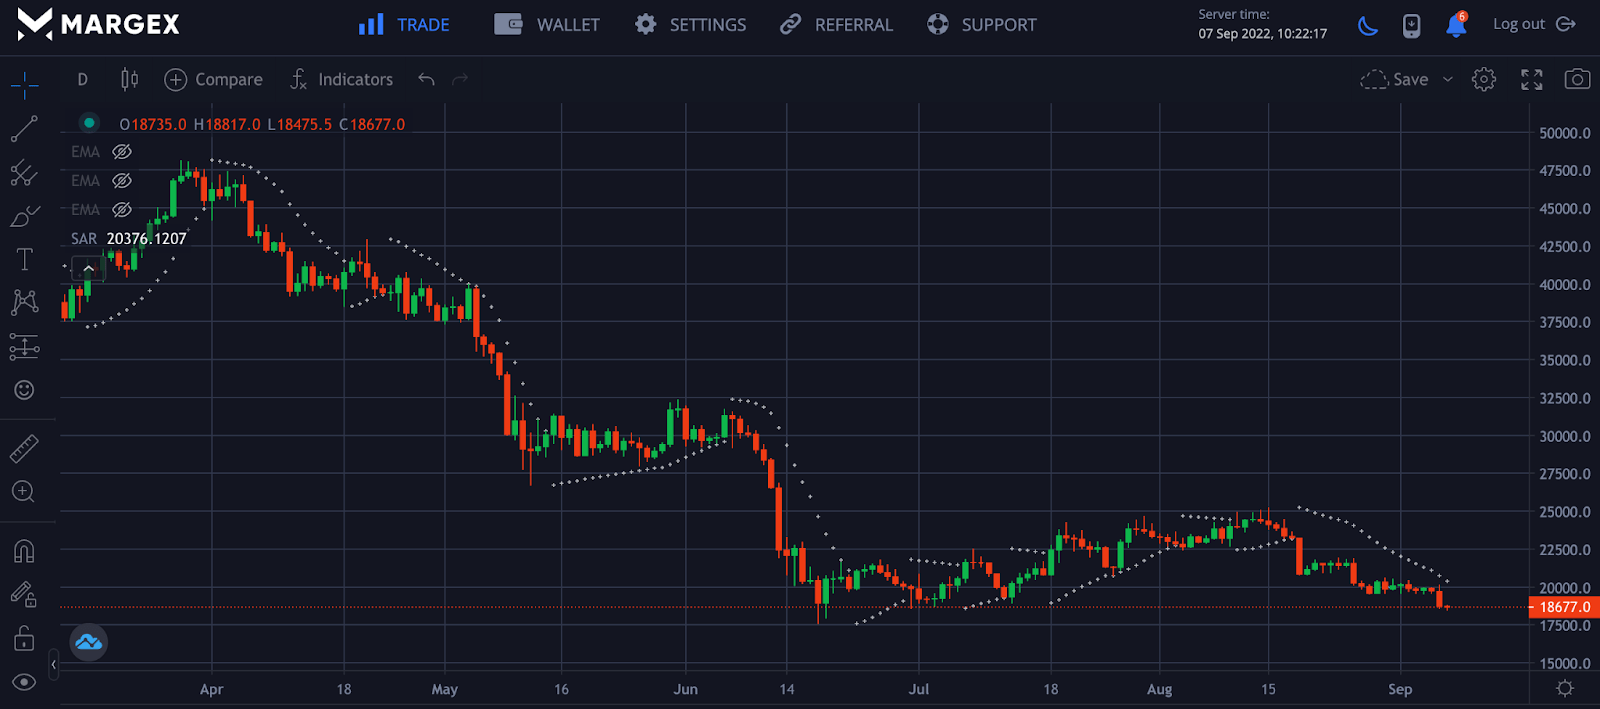
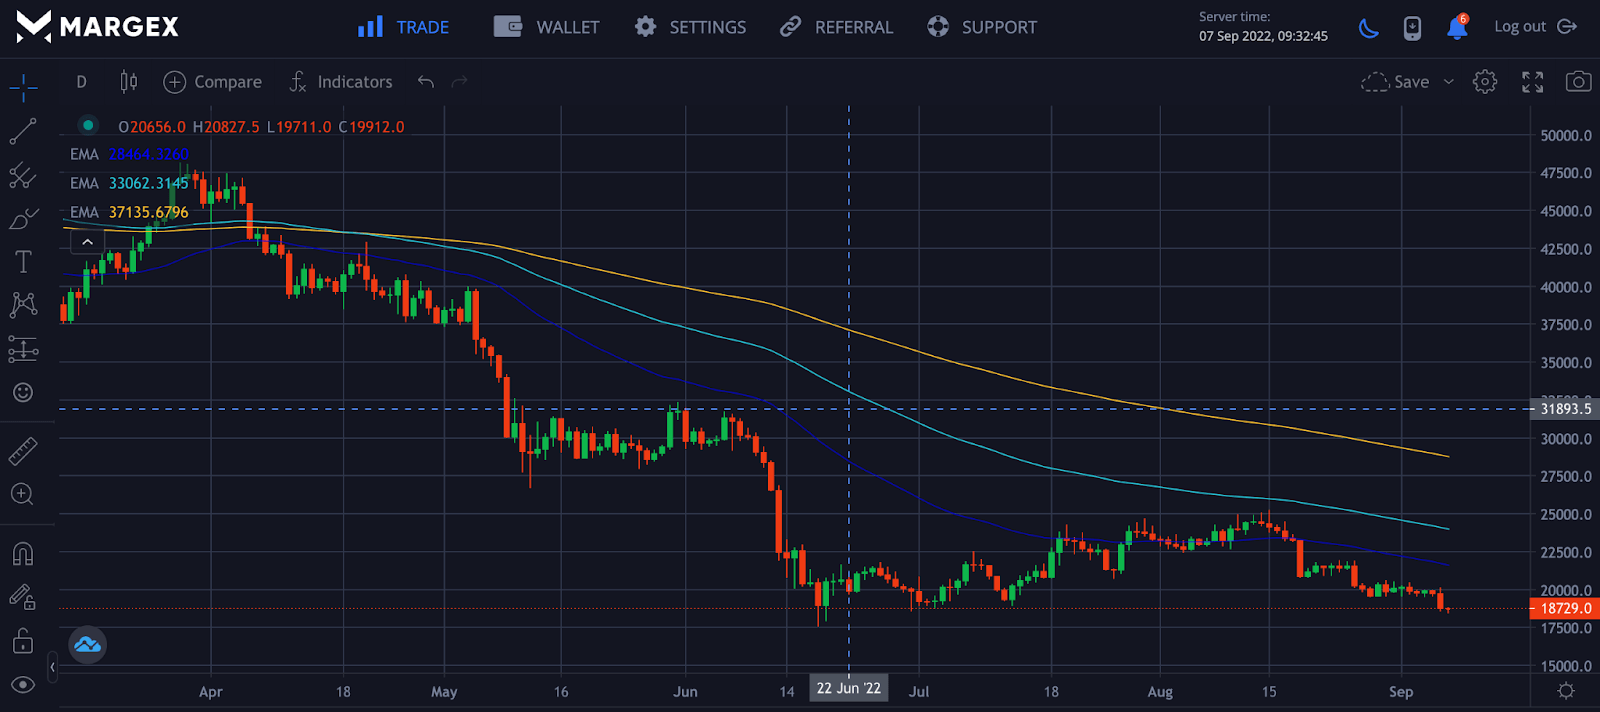
The chart above shows the parabolic SAR as a trend-following indicator to show BTCUSD price direction.
The SAR indicator is also used for trailing stop-loss as it helps traders to capture price reversals and large profitable trends as they occur due to price actions of the crypto market.
How Parabolic SAR Works
The technical indicator SAR converts price actions, volume, charts, and others into a visual representation of the market directly to the trader. On the chart, this is seen as dotted lines that appear under the candlesticks in a bullish or uptrend market, and in a bearish or downtrend market, the SAR indicator appears above the candlesticks.
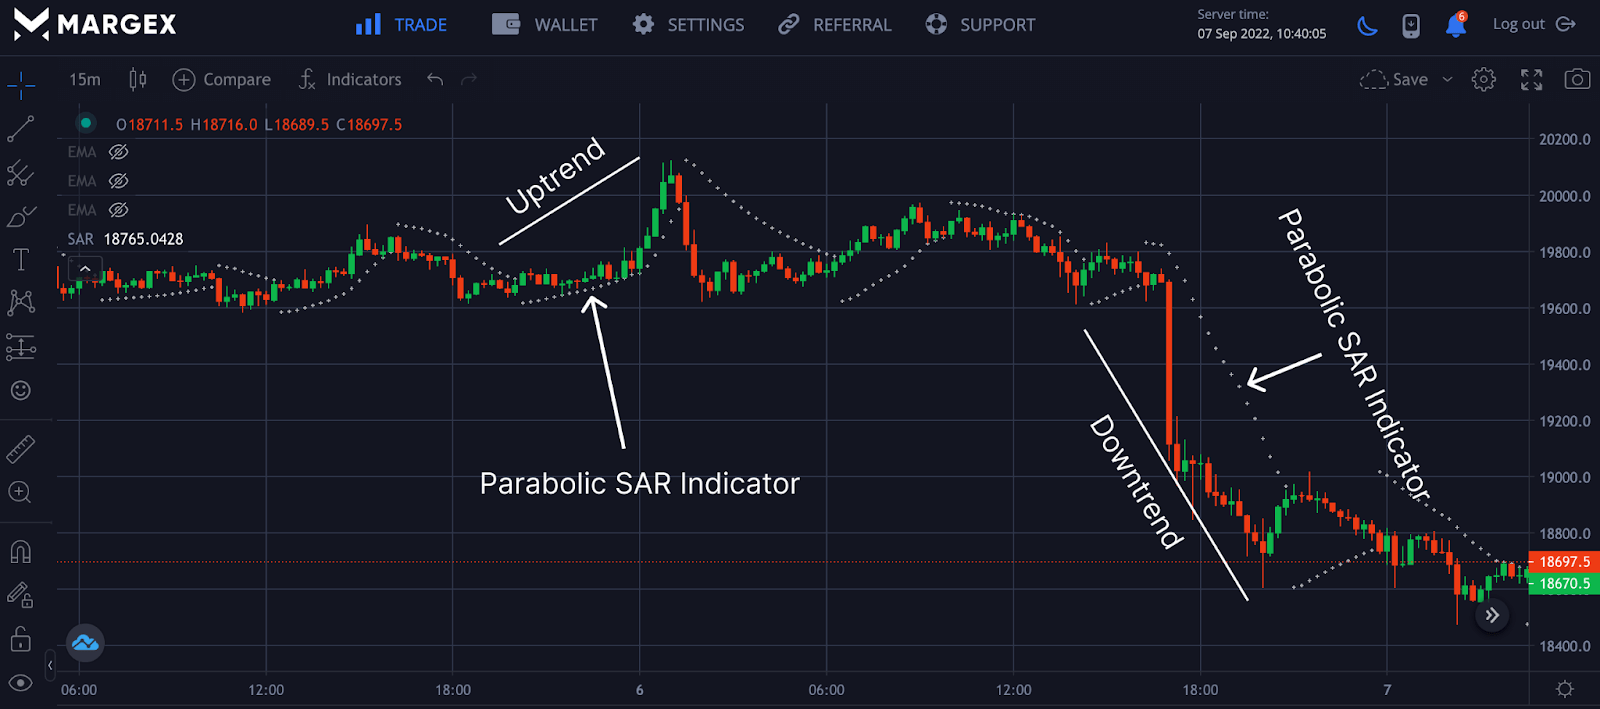
When the SAR indicator appears below the price, it signals a change in trend to a bullish signal or an uptrend price movement from the chart above. But if the price appears above the price, this signals a bearish or downtrend price signal for traders to go long or short for a particular crypto asset.
The Parabolic SAR works best in a trending market as it helps traders capture trends and make profitable gains, but this SAR indicator struggles in a choppy or ranging market as it throws false signals; it would be best if this indicator is traded with other indicators such as the 50 and 200 exponential moving average (EMA) for more and better accuracy.
The SAR indicator is used with the PSAR strategy known as the parabolic time/price system. The term SAR meant the point traders must enter a trade with a long position and exit following short positions. Widely known presently as the parabolic SAR to determine entry, exits, trend reversal, and stop-loss by traders.
Calculating The Parabolic SAR Indicator
The Parabolic SAR is a complex mathematical indicator when calculated manually. With the current technological advancement, this indicator is readily available on Margex exchange for free to enable you to trade this indicator with ease.
This indicator was developed by J.Welles Wilder long before using computers; the aim was to help traders ride trends or bullish signals, spot reversals as the SAR’s dots change location, and exits trades. Basically, the dots for the SAR indicator appear below in an uptrend and above for a downtrend price action.
However, traders should have a piece of background knowledge and information on the calculations.
Parabolic SAR Formula
Stop, and Reverse (SAR) are points calculated based on present market data. For example, to know the SAR value of today, yesterday’s SAR values are used, and today’s SAR values can be used to know tomorrow’s SAR values.
In a bullish trend, the SAR values are obtained from previous swing highs, and for a downtrend or bearish trend, the SAR values are obtained from previous swing lows. The SAR indicator uses the highest and lowest points in a trend direction called extreme points (EP) together with an acceleration factor (AF) to determine where the indicator dots are placed.
Below is the formula for an uptrend PSAR or downtrend PSAR;
Uptrend PSAR = Prior PSAR + Prior AF (Prior EP – Prior PSAR)
Downtrend PSAR = Prior PSAR – Prior AF (Prior PSAR – Prior EP)
AF – Acceleration factor ( default value of 0.02 increases with EP and a maximum value of 0.2)
EP – Extreme low and high points and it is updated anytime a new EP is reached.
Traders can adjust the AF to get sensitivity in price reversals; the higher the AF, the sensitivity increases. As AF decreases below the default value of 0.02, the sensitivity reduces and provides few trend reversal signals.
How To Trade On Margex Using The Parabolic SAR
Margex, a Bitcoin-based derivatives exchange, enables cryptocurrency traders to trade and stake various crypto assets with up to 100x leverage.
The user interface of the Margex is intended to simplify trading for beginners, and some of its built-in features are intended to assist traders in becoming more profitable.
Moreover, trading and staking the same assets on Margex with up to 13% APY makes this exchange stand out from other crypto trading platforms in the industry. Other key features include;
- The user interface was created with the goal of making deposits and withdrawals as simple as possible.
- Margex allows you to change the leverage of your open position, you can adjust or change your leverage as a trader.
- Staking rewards are claimed daily and added to your staking balance with the help of the Margex automated system.
- Margex provides a free gateway to interact with the DeFi space and eliminate security concerns associated with DeFi as they are highly conscious of security due to their procedures.
You will have access to these new features and technical analysis tools if you have a Margex account, which is built with real-time prices to help you make money trading.
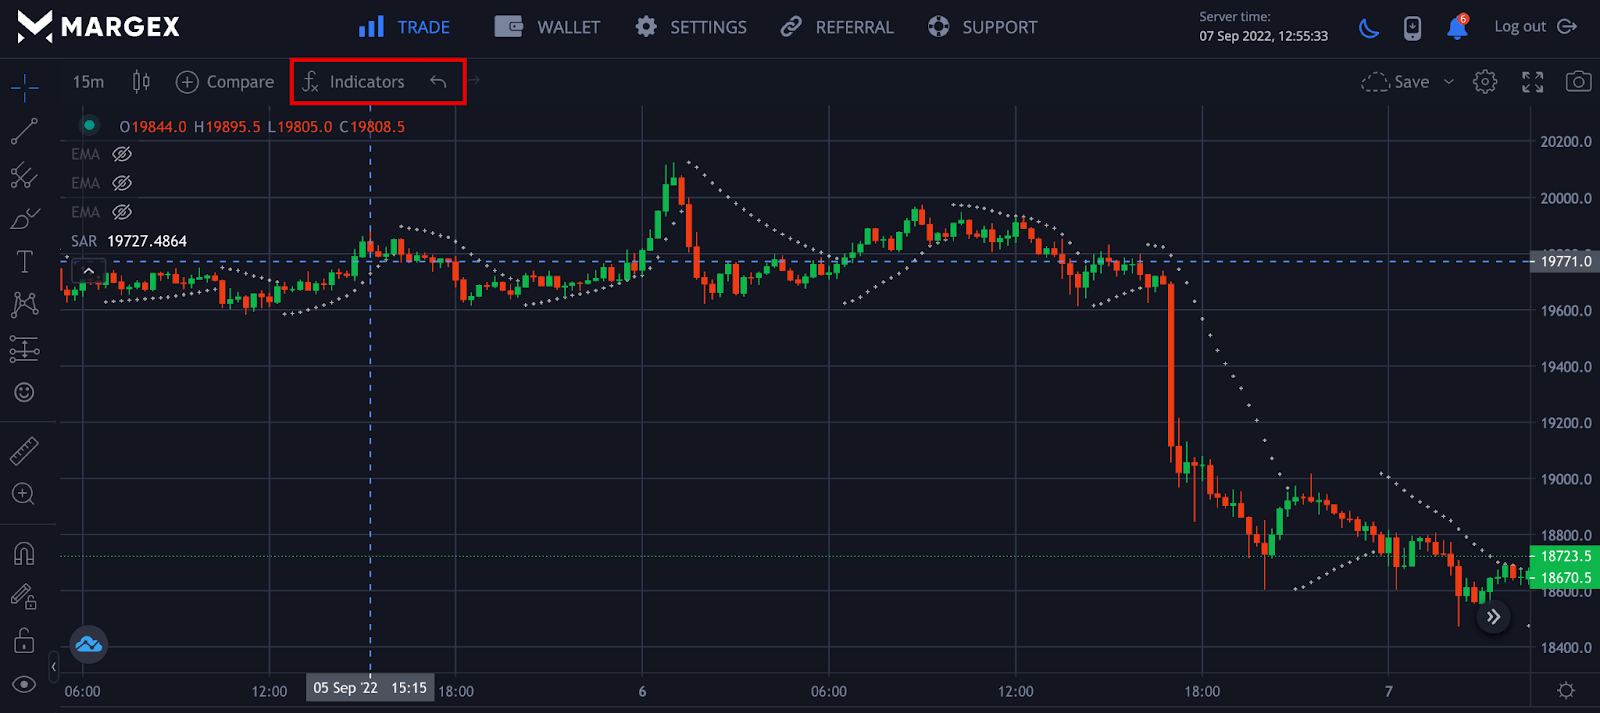
On the Margex platform, click on the indicator icon marked with the red rectangle and search for parabolic SAR or SAR. You will be given options to pick; selecting parabolic SAR will be added to your trading chart.
From the above chart, the SAR Parabolic dot is above the candlesticks or price signals a downtrend momentum. In contrast, the appearance of the parabolic SAR dot below the price signals an upward direction change. Traders need to confirm this trend reversal with other reliable trading strategies that have worked.
Parabolic SAR Strategies
The Parabolic SAR indicator, though simple, has so much benefit in helping traders capture trends, especially when combined with other strategies in the crypto market, as the PSAR could become a trader’s favorite.
It is noteworthy that the PSAR indicator is most effective in a trending market, not a choppy market, as it can give false signals when prices range. Since the crypto market move in trends, this PSAR indicator is perfect for traders.
Parabolic SAR Breakout
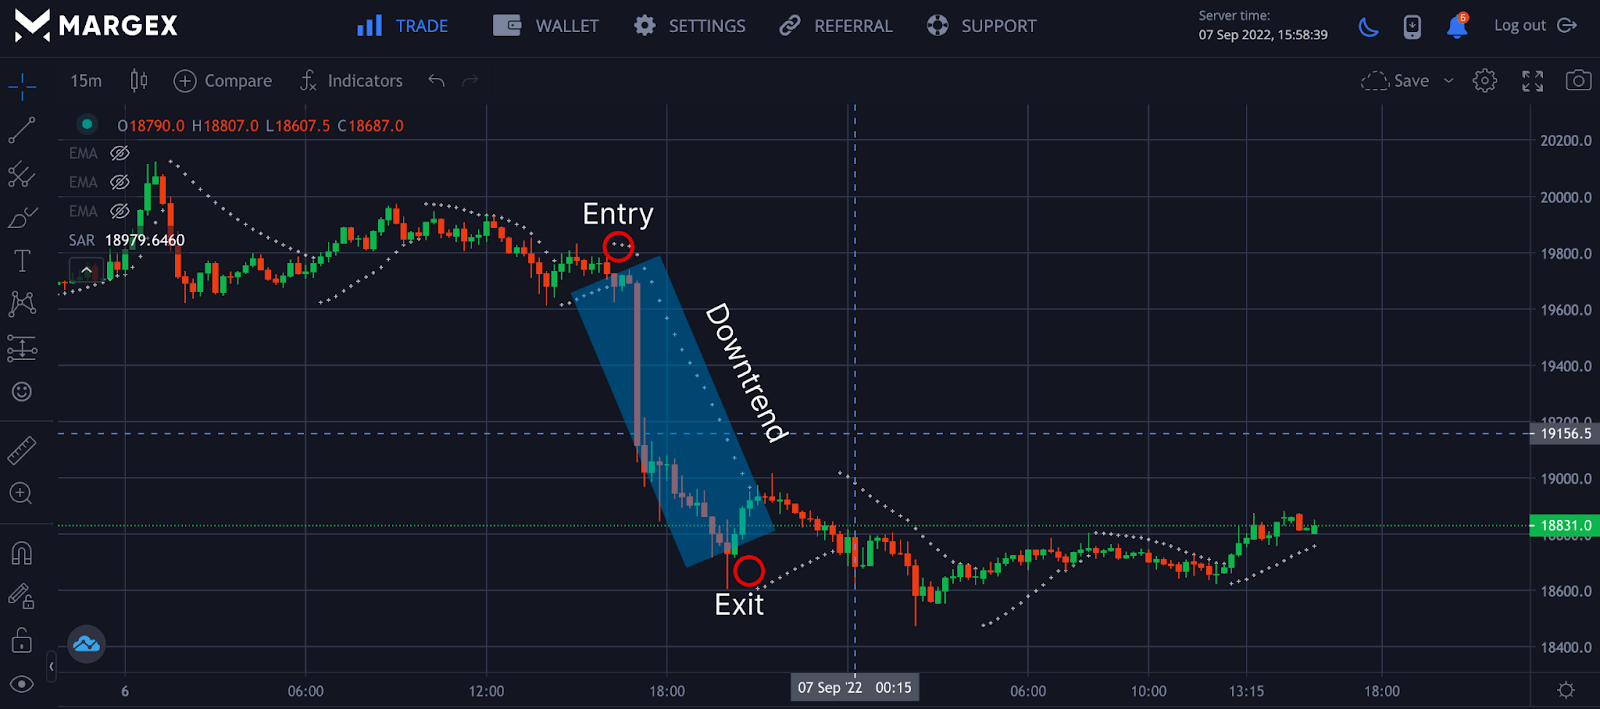
The Parabolic SAR indicator can be used for an instant breakout; for every flip to the other side of the price, PSAR indicates a potential price reversal is imminent, and once the is a change in trend with a PSAR confirmation, a trader can go long or short on a particular trade.
For the BTCUSD pair chart above, the PSAR dot appeared above price, signaling a potential price reversal to the downtrend with the entry and an exit as the PSAR indicates a change in price direction to the upside.
Double Parabolic SAR Strategy
A double PSAR strategy uses two timeframes, a higher timeframe of 1-day and a lower timeframe of 4-hour.
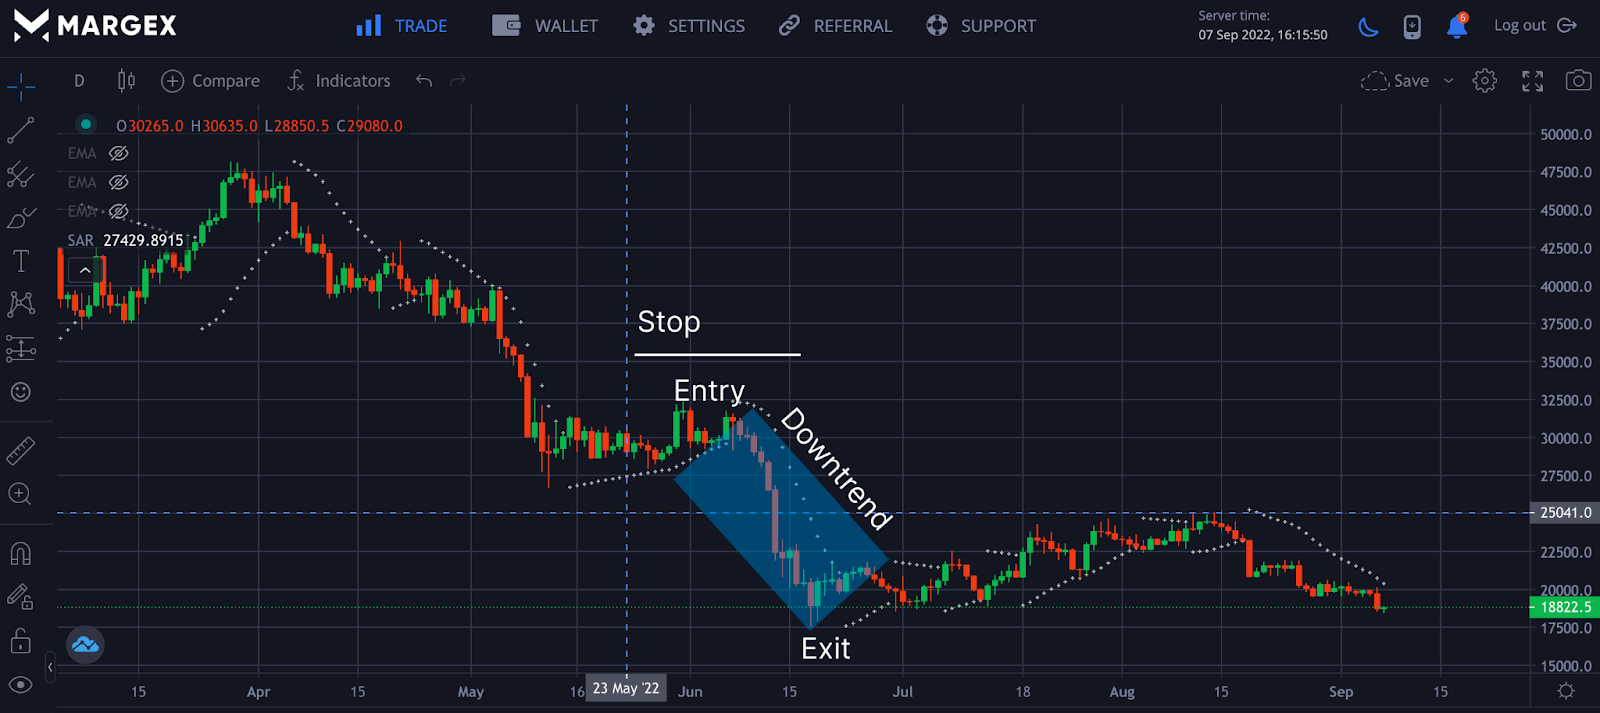
On the 1-day timeframe, the Parabolic SAR indicator shows a change in trend to a downtrend as the dot appeared above the price.
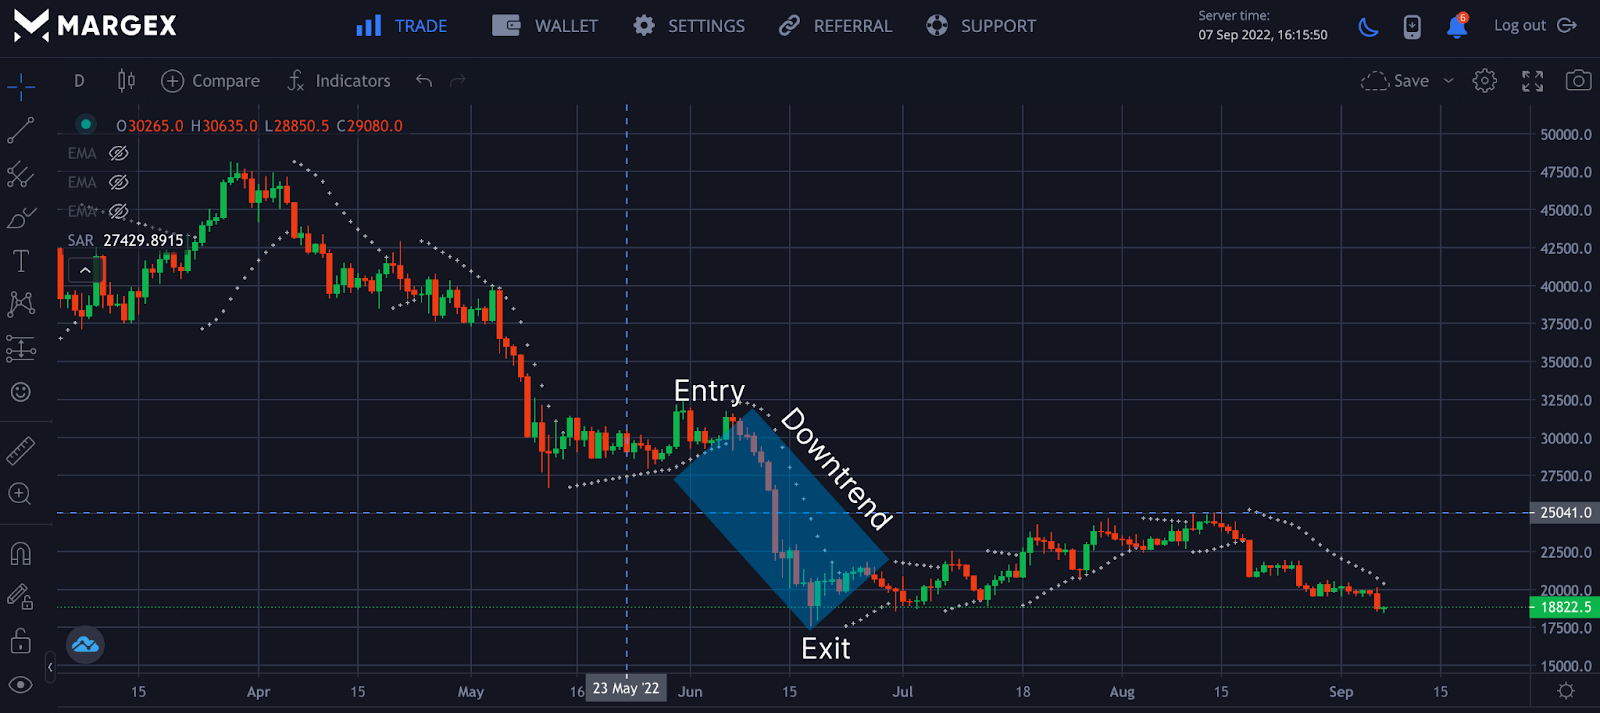
To confirm this trade, we would open this in a lower timeframe of 4-hours at the same price; if this is confirmed, a trader will open a short position and exit the trade on confirmation of the change in trend on the 1-day timeframe.
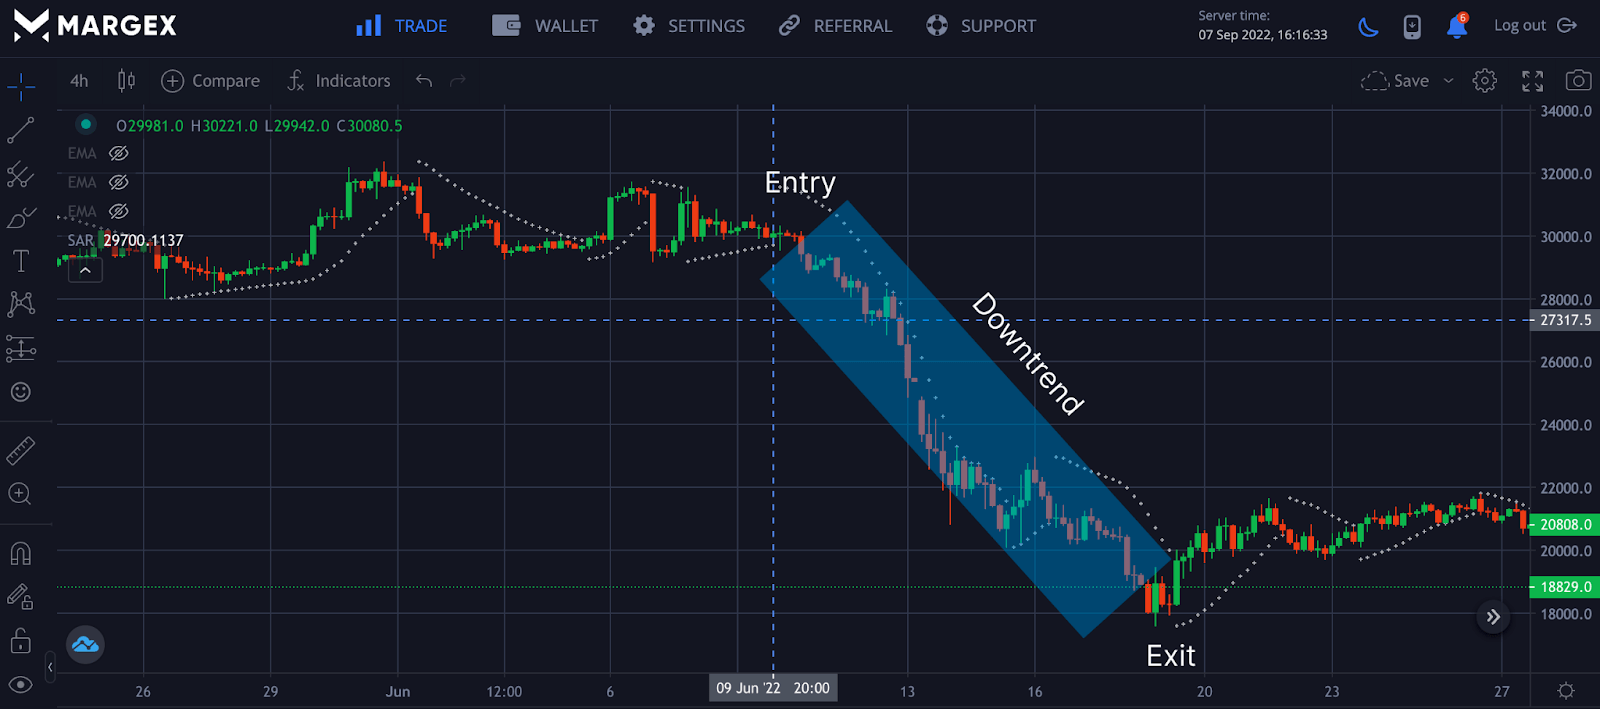
The image above shows the double PSAR indicator trade taken for BTCUSD for a short position at $32,000 and exiting the short position at $18,500 on confirming with the higher timeframe of 1-day.
Parabolic SAR Scalping Strategy
Scalping is a short-term trading strategy carried out by traders within a lower timeframe to make quick returns or gains by opening multiple positions. Scalpers often trade using the one-minute, thirty-minute, or sixty-second chart.
For scalping, it is best to use the double PSAR strategy, but in this case, we can use the 15-30 minutes chart as our high timeframe while using the 1-minute chart to enter trades and exit our trades based on the higher time frame selected.
How To Use A Parabolic SAR Trading System
The Parabolic SAR indicator is available on the Margex platform. To access this indicator, you need to open an account on Margex, where you can trade different currencies and stake these currencies to make money at the same time; sounds interesting, right?
You can also practice all the PSAR strategies to become profitable for free.
Parabolic SAR Indicator Settings
On the Margex platform, click on the indicator icon at the top of the trading interface, then type “Parabolic SAR” in the search bar. Click on the indicator to add it to your trade setup.
Hover on the left side of the interface where you see “SAR,” then click on the settings icon to change the setting of the SAR indicator.
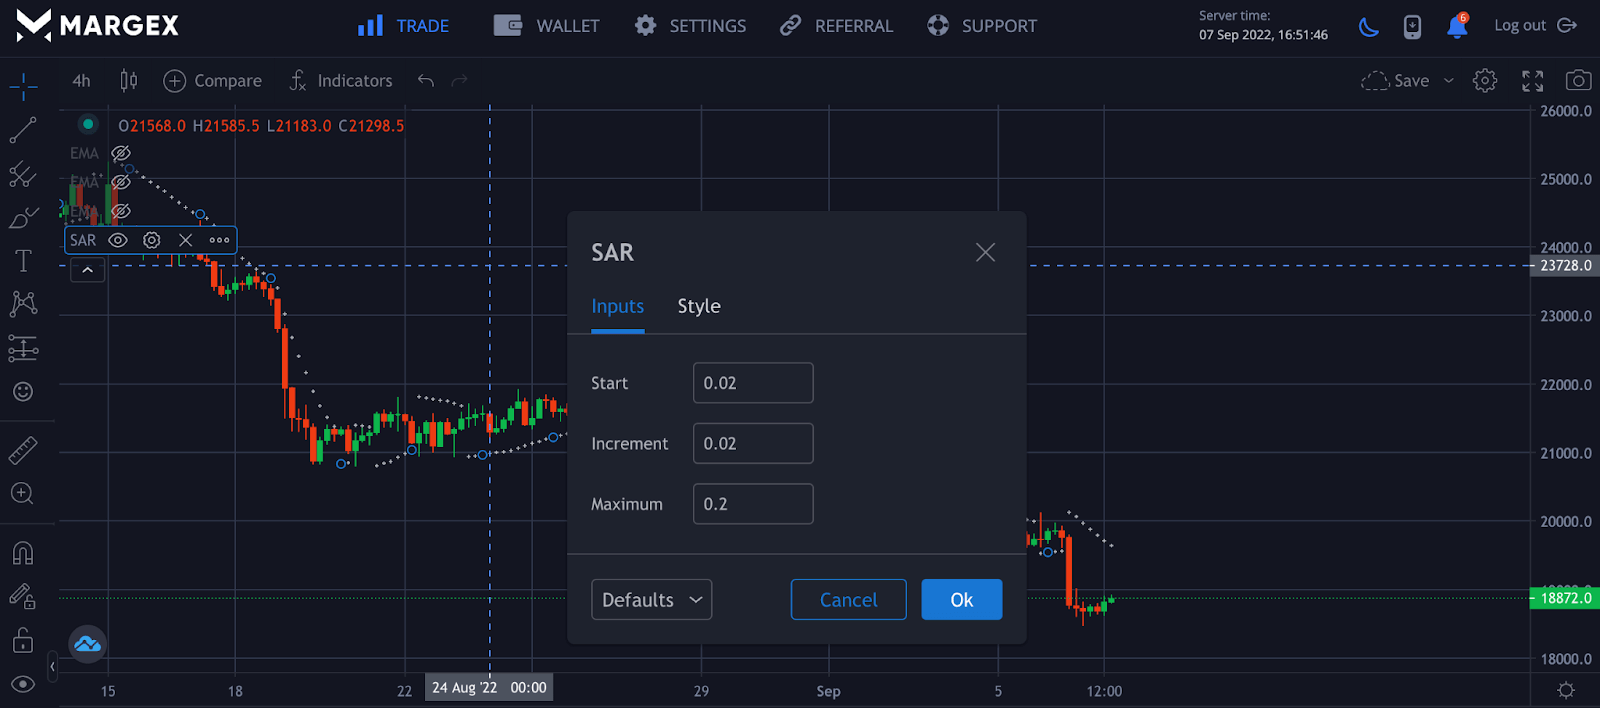
The default setting has been set to 0.02; reducing this value will reduce the sensitivity to change in price, and as you increase it, the sensitivity of the SAR indicator to change in price will increase. The maximum value for the SAR is 0.2
Parabolic SAR Indicator On MT4
The Parabolic SAR indicator is available on the MT4 trading app for forex traders; all strategies discussed can be applied; although the acceleration factor AF could have a different name, everything works pretty the same.
Parabolic SAR And Stop Losses
Although the Parabolic SAR looks simple, it can be adapted to suit different strategies; it can be used for trend direction, entry, exits of trades, and trailing stop-loss.
It is best not to trade this indicator in isolation for better and optimum results. To set stop loss or trailing stop-loss.
Trailing stop-loss should be set at a few distances from the SAR indicator entry position, and the take profit could be 1.5 x stop-loss. Trading based on this strategy is not the ultimate but managing your portfolio from loss of capital by using a proper stop-loss order should the price go against your trading plan.
Pros And Cons Of The Parabolic SAR
All trading indicators have pros and cons, and the Parabolic SAR indicator is not left out. The PSAR indicator is known for the quick response and indicating a possible change in price, entry, and exit of a trade position, and it helps a trader to use a trailing stop-loss.
A major con for the SAR indicator is that it produces false signals in a ranging market; it would be best not to trade the SAR indicator alone, especially in a ranging market, as it will result in a huge loss of capital.
FAQ: Some Frequently Asked Questions On Parabolic SAR
There are several mind-boggling questions people ask regarding Parabolic SAR. In this FAQ section, we will discuss some recurring questions about this technical indicator.
Is Parabolic Sar A Good Indicator?
Parabolic SAR is one of the oldest price indicating tools in finance. Thus all the several experiences it has gathered over the years have given it an edge over other price indicators like itself.
Parabolic SAR is an all-in-one indicator that offers top-notch service in analyzing how to trade financial assets like commodities, currencies, indices, and shares, also assisting in spotting the current trend direction of investment. In addition, as a stop and reversal system, it is efficient in trailing stop loss and highlighting potential price reversals.
Which Indicator Works Best With Parabolic Sar?
Even though the Parabolic Sar indicator is very efficient, J Welles Wilder Jr, the creator of the Relative Strength Index (RSI) formula, recommends that traders complement it with alternative indicators after establishing a price trend for increased efficiency.
Having several indicators to confirm the signals on the primary indicator is very important because sometimes an indicator can send false alerts, and acting on such signals can be disastrous, leading to the loss of funds.
Parabolic Sar complements well with indicators like ADX (average directional index), Moving Average, or Stochastic.
Is Parabolic Sar Profitable?
The difference between exits and entries determines the profitability of trades. Psar efficiently captures profits by entering business during a steady market uptrend. It also provides warning signals in the event of a downtrend allowing traders to take the necessary actions promptly.
How Do You Use Parabolic SAR Effectively?
To know how to use PSAR most effectively, a trader needs to understand how it works. When using this indicator, ensure that you leave its parameters intact. However, some traders have devised their own trading parameters based on the best strategy for them.
Further, to get accurate results ensure to use the indicators when there is a market uptrend; failure to do that may result in a false report. In addition, PSAR indicators work well with candlesticks instead of lines and bar charts.
It is also essential to recognize the position of the dots on the PSAR indicator. Once the dot is below the price, it represents an uptrend, but the moment it goes high above the price, there is a downtrend in price.
Does Parabolic SAR Repaint?
Stop loss order is one of the risk management techniques essential for each trade because it prevents capital loss if PSAR never repaints candlestick dots on a price chart. The moment a candlestick closes with a PSAR plotted on the chart, it will remain there, even if there is a change in the timeframe or the chart is closed down. However, there may be changes in the instrument readings of the last candlestick before closing.
How Can You Use A Parabolic SAR Indicator To Set Your Stop Loss Order?
Stop loss order is one of the risk management techniques essential for each trade because it prevents capital loss in the event of a downtrend in price.
You can either wait for a trade signal and candle price bar to close before making an entry or decide not to wait. If you wait, the dots on the wall will flip sideways; when it does, you can use them as a stop loss point.
On the other hand, when you decide not to wait for a signal or closing of the price bar, it is recommended if going long to place the stop loss point below the recent swing low and, if going short, to put it above the recent swing high.
What Timeframe Works Best With Parabolic SAR?
PSAR works well with all timeframes, like other indicators. It is excellent for swing traders on the higher timeframe and intraday traders within the one-minute or 15min timeframe. The formula to determine the best time frame depends on individual trading strategy.
However, some believe the best timeframe for PSAR is 4 hours chart, but every trader has a preference.


