
Separating line pattern is one of the most used technical indicator used by traders to forecast financial markets. It typically consists of two candles formation that indicates the current trend in the market.
There are bullish and bearish variations of the dividing line pattern. Cryptocurrency and foreign exchange (FX) traders and market participants often look for this candlestick pattern to signal a possible entry or exit point to purchase or sell a currency pair.
This article explores how to trade separating lines candlestick pattern and discusses strategies to help optimize trades.

What Exactly Is The Separating Lines Pattern?
When an uptrending bullish bar is followed by a downtrending bearish candle that opens at the start of the prior bar, or when a downtrending bullish bar is followed by an uptrending bullish candle that opens below the open of the prior bar, a continuation pattern known as the Separating Lines pattern is formed.
Depending on the prevailing trend, the two-candle continuation pattern may be either bullish or bearish. It manifests itself when two lines are traveling in opposing directions.
Bullish separating lines
It is a two-candle bullish continuation candlestick pattern that appears amid a bullish trend. There has been a momentary reversal, but this signal shows that the present bullish trend will resume.
Generally speaking, investors see a bullish dividing line as confirmation that the present bullish trend will persist after a little pause. It consists of two candles, the first of which is bearish and the second of which is bullish. In addition, it has the following features:
- This first candle is a bearish one.
- The second candle either gaps over the body of the preceding candle or opens strictly at its opening.
- The second candle shuts above where it began.
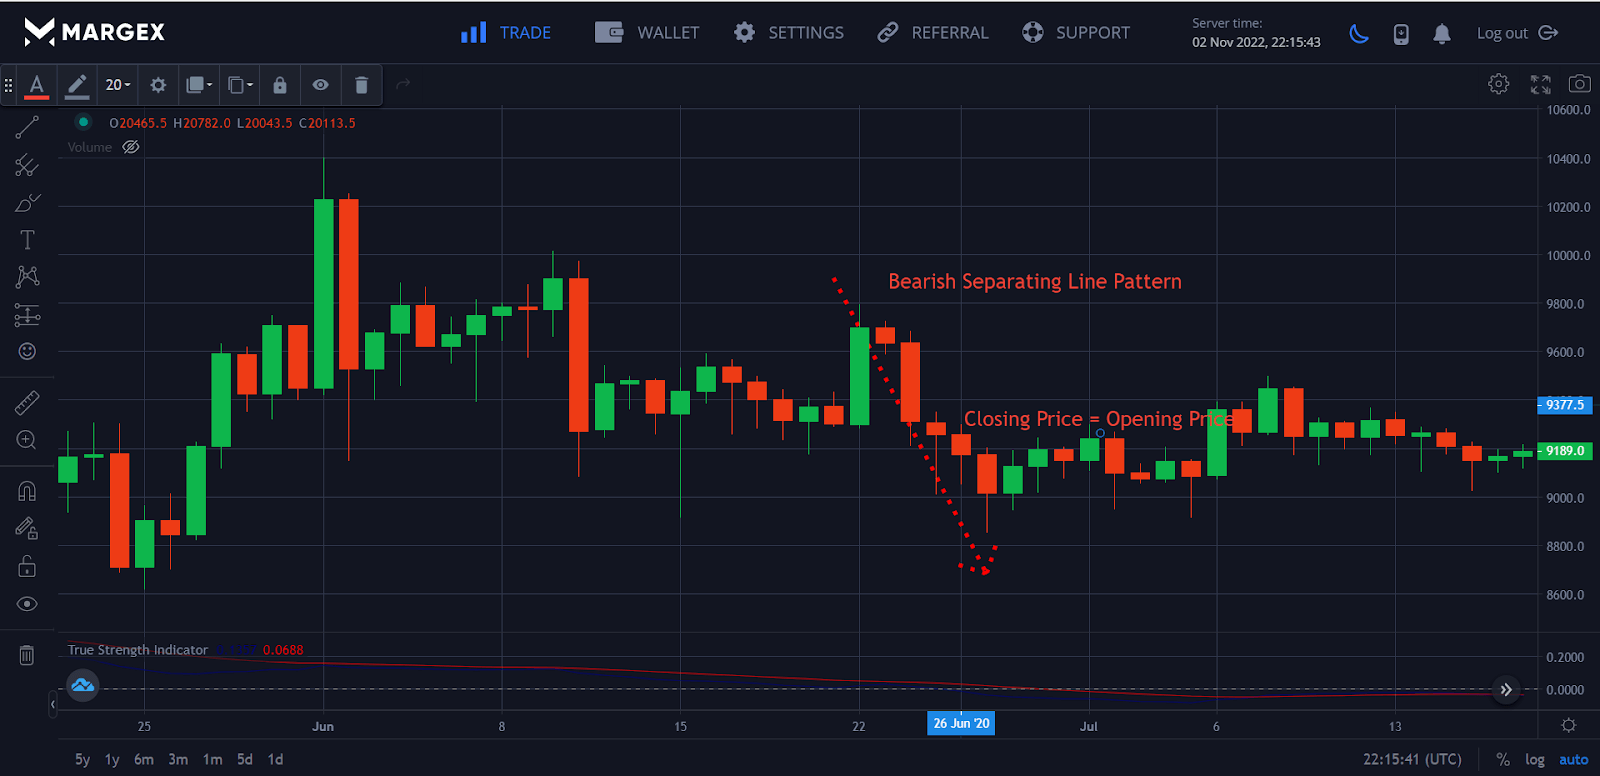
Bearish separating lines
Bearish continuation patterns include the dividing line to the downside. In a downward trend, the initial line is a long white candle. Black candles form the second line, a thin vertical strip. There will be a simultaneous opening of both bars and then a gradual divergence in price. To create a bearish pattern,
- The first candle must develop a bearish trend and be positive in value.
- To be negative, the second candle must open below the opening of the first candle.
How To Identify Separating Line Pattern
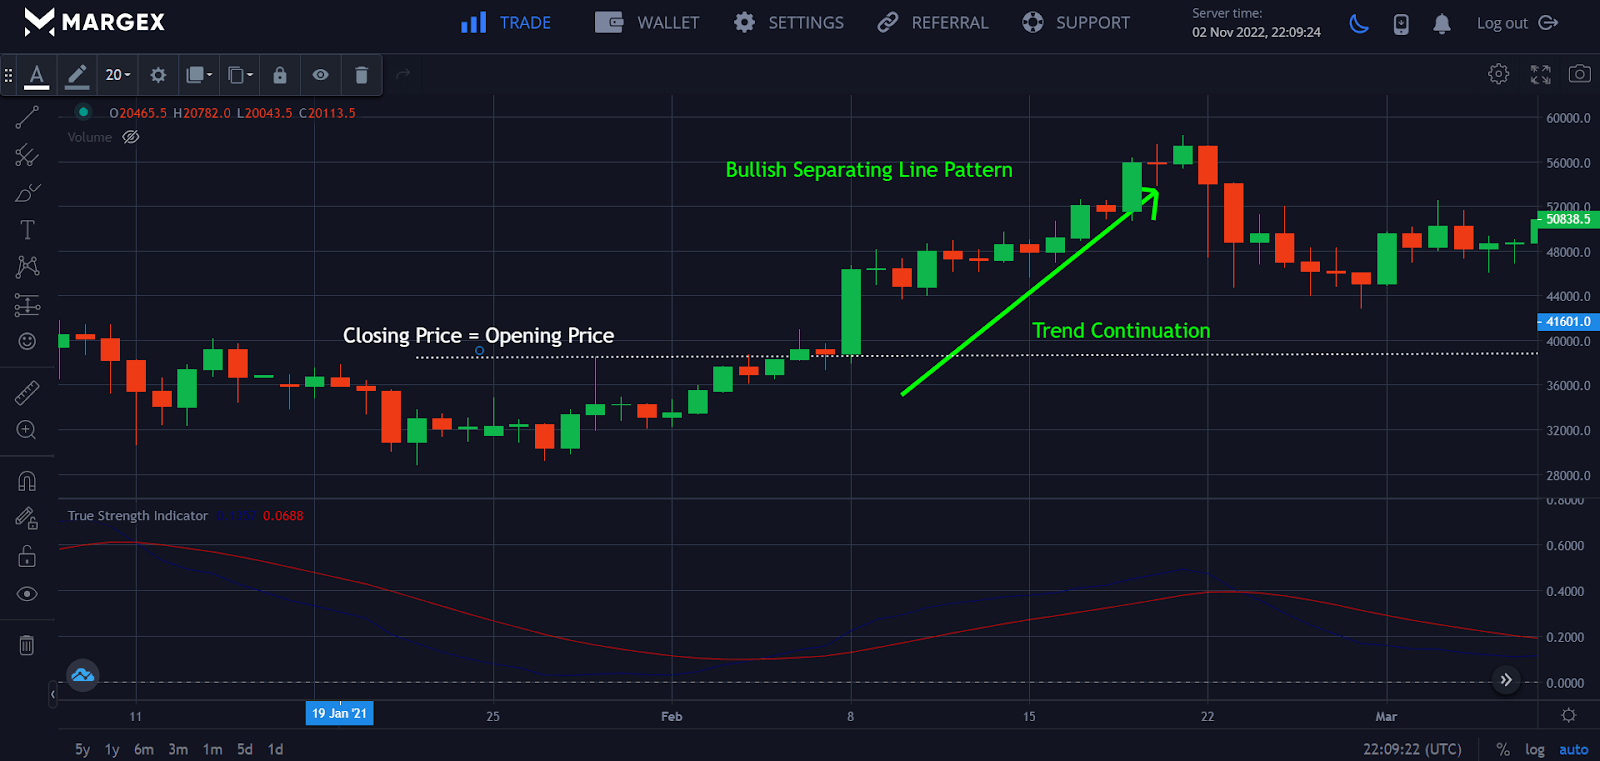
One of the advantages of utilizing Separating Line Patterns to make trading choices is that they are easily recognized. Once chosen, implementing a trading strategy is a simple procedure. The chart below clearly shows a bullish dividing line pattern.
Criteria
When an upswing is in effect, a day that is the polar opposite in color of the trend will arise. A new day starts when the preceding one opens. The bottom of the second day ought to be the starting point for an upward trend.
Pattern psychology
A black or red body develops during an upsurge. Bulls are worried about this, but then prices fall back to the previous day’s opening the day after. When this occurs, bulls regain faith that the trend is still active and begin buying again, pushing prices upward. There is a restoration of faith, and the upward trend continues.
The candlesticks indicate where the money is entering and leaving a stock. A considerable benefit comes from recognizing and comprehending the trader psychology behind the candlestick indications. It allows a trader to participate in stock investments with a high chance of going in the desired direction.
The information gained by traders who properly use the candlestick signals will allow them to enhance their trading strategies for the trading entities in which they engage. You do not have to purchase or sell stocks blindly based on the research advice of an analyst or depend on pre-packaged systems that may or may not perform.

Trading Separating Lines Candlesticks: How To Do It
When trading with distinct line patterns in candlestick trading, one of the most common interpretation is to concentrate on the market volume and security volume.
To continue refining the pattern, we will now explore two trading techniques that take advantage of it. The techniques below are wonderful examples of how we might attempt to construct a trading strategy. However, although they indeed serve well as inspiration, they have yet to be ready to be exchanged live!
A few elements that might assist and guide your trading choices under this technique are described below –
Market environment
This is an excellent method for identifying substantial movements in who is entering and departing the market. This pattern indicates that the general market environment is conducive to the continuance of a price trend.
Identify and confirm trade opportunity
You are searching for a second candlestick in a pattern that’s double the size of the first.
Determine trade entry, stop loss, and take profit levels
When trading the dividing line pattern, the steps for deciding when to enter, identifying stop losses, and determining to take profit levels are outlined below.
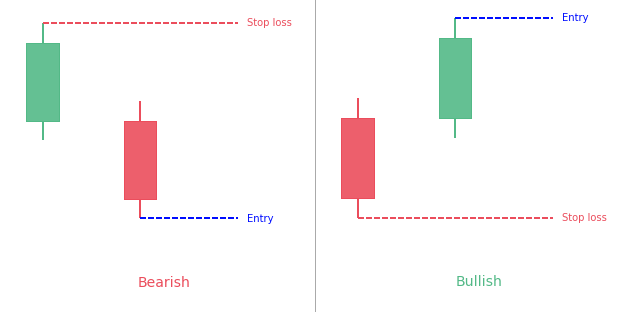
Market Entry
Whether you are trading the bearish or bullish dividing lines signal will determine the best market entry. However, as both patterns are continuations, you will buy or sell in line with the current trend.
This is how:
- Bullish: During an ascent, a candle with bullish dividing lines forms. Buy above the pattern’s second bullish candlestick to enter the market.
- Bearish: A downtrend is present when the bearish dividing line appears. Sell below the formation’s second bearish candlestick to enter the market.
Stop Loss
With the establishment of the dividing lines, finding a stop loss is easy. As seen, it is positioned above or below the pattern:
- Bullish: The stop loss is positioned below the pattern’s first bearish candle. The long position is therefore shielded against excessive retracement.
- Bearish: The stop loss is positioned above the pattern’s initial bullish candlestick. Doing this shields the short position against a sharp upward price movement.
Profit Target
A trading chart formation, pattern height, and risk vs. reward ratios are two of the most frequent methods in which profit objectives are set on the market in forex. Profit objectives for the dividing line patterns are often positioned as follows:
- Bullish: Profit goals are set above the bullish dividing lines candle’s upper extreme.
- Bearish: The lower extremity of the bearish dividing lines candlestick serves as the location for profit objectives.
By setting profit targets in these ways, the trader may benefit from bullish or bearish trends that emerge after candle gaps.
It is possible to make much money by trading separating lines, especially if you enter the market just before a hollow or black candle continues. To see this in action, look at the following BTCUSD example.
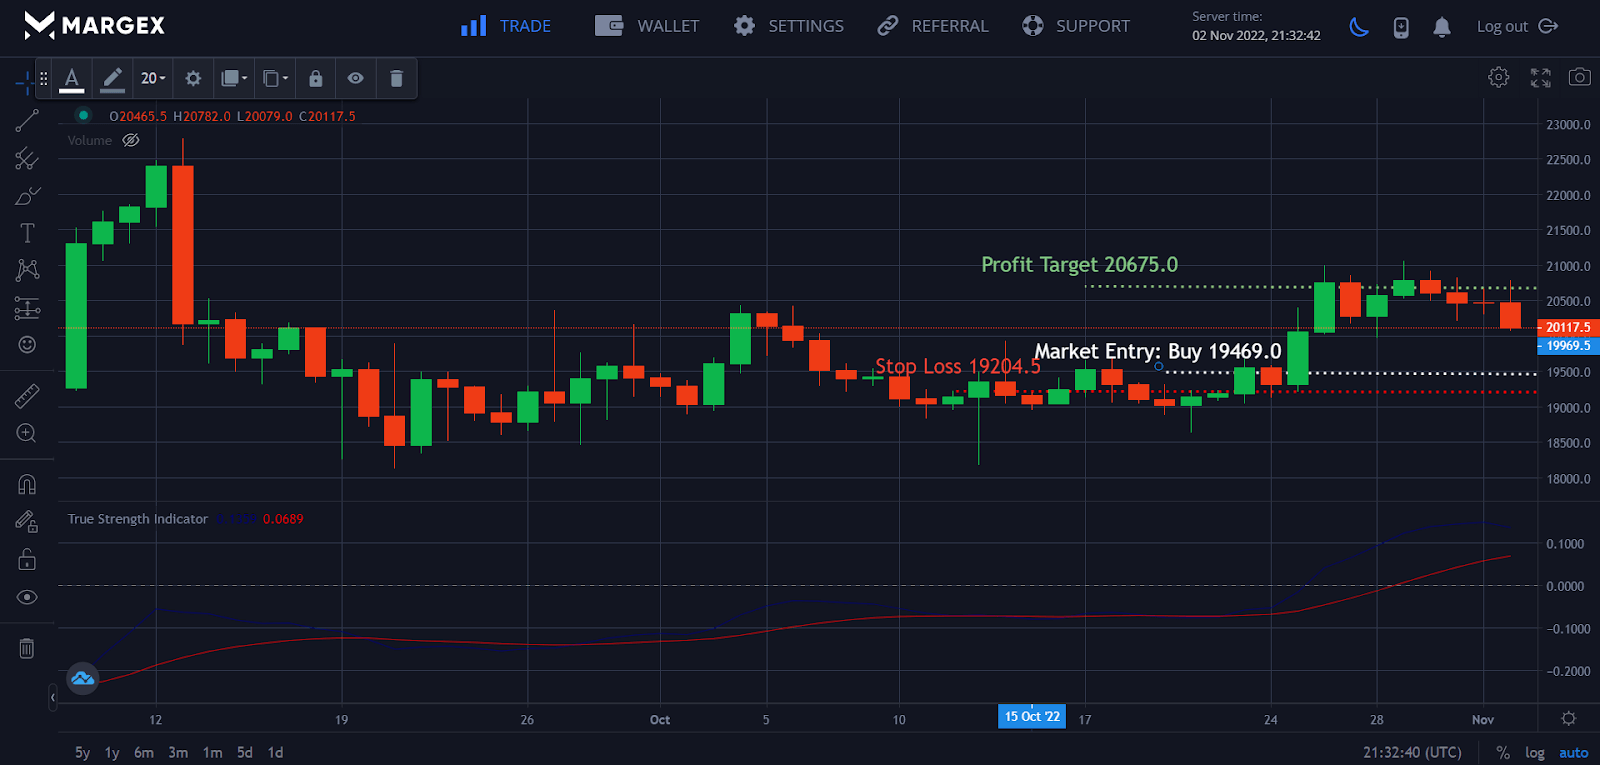
The specifics of this BTCUSD trade are as follows:
- A strong bullish trend has been identified.
- It found the bullish separating lines pattern. There was a bearish candle at the start and then a bullish candle at the end, and they both closed and opened simultaneously.
- Above the second candle, at 20675.0, a buy order was placed.
- Below the first candle, at 19204.5, a stop-loss order was placed.
- Under the assumption of a risk-to-reward ratio of one-to-one, a take-profit goal of 19469.0 was set.
You should however know that although separating lines candlestick provides relevant insights into price movements, they also have their cons. During market volatility these patterns can generate false signals due to the sudden gaps in price changes.
So you could get an initial pattern that indicates an upward trend which could suddenly change due to the volatile market. This is common in highly volatile markets like cryptocurrencies that experience sudden price surges.
In addition, separating patterns don’t provide a bigger picture about an asset as it only captures the most recent price movements. Therefore traders can be stuck in the current price action without observing the long term implications for the asset.
To increase the effectiveness of separating patterns it is crucial to integrate other analytic methods. The best way to achieve this is to cross-analyze other patterns to get concrete directional signals. Furthermore, traders should also ensure that they have strict risk management plans to help mitigate losses and enhance profitability.
Conclusion
The separating line candlestick pattern will usually appear on stock, index and crypto charts. Because of the extreme volatility, there is less chance of a gap inside the candlesticks in forex.
Remember to distinguish this gap from the gap that formed over the weekend on the forex charts. It is advisable to trade separating candlestick patterns only with other technical tools, such as moving averages, basic levels, supply and demand zones, etc.
A trend continuance indication is the separating line pattern. It is made up of two candlesticks that have identical closing and starting prices.
Separating line patterns are classified into two types: bullish and bearish. Bullish separating lines pattern form during uptrends, whereas bearish lines form during downtrends. Buy above the pattern’s second candle to trade the bullish dividing lines. To trade the bearish, sell below the indicator’s second candle.
FAQs
What is a separating line pattern?
When a bullish bar is followed by a bearish candle that opens below the opening of the preceding bar or vice versa, the Separating Lines candlestick pattern is formed as a continuation pattern. This two-candle continuation pattern may be bullish or bearish, depending on the preceding trend. If two lines are traveling in opposing directions, this will occur.
What is the bullish separating lines pattern?
A bullish separating lines candlestick pattern is a two-candle bullish continuation candlestick pattern that occurs amid a bullish trend. It indicates that the present bullish trend is set to resume after a little pause.
What is the bearish separating lines pattern?
In technical terms, a Bearish Separating Line is a bearish continuation pattern. It shows a trend in the opposite direction of the Bullish Separating Line. This pattern consists of an initial white candle in a downward trend, followed by a black gap opening the next day. The opening price for the second day is the same as the first day’s, making it a substantial black candle.
When trading the separating lines candlestick pattern, is a stop loss necessary?
When trading the formation, having a predetermined risk-reward ratio and a stop loss, either mental or physical, in place is highly advised. Having a stop-loss in place helps prevent financial disaster in a market downturn.


