
Trading in the cryptocurrency markets can be a lucrative and fun-filled venture for traders who are open-minded to learning and reviewing profitable strategies and technical indicators from time to time.
The financial and cryptocurrency markets present trillion-dollar opportunities for smart traders with the skills and technical know-how to navigate and get a huge chunk and share of the wealth it possesses.
Millions of traders worldwide have taken to constant learning and smart approaches to discovering new and effective trading indicators that aid them in becoming profitable at a high consistency.
Traders who subject themselves to rigorous learning and knowledge-building of strategies and effective technical indicators can never go wrong as they improve and add value to their trade experience and become more confident and profitable in trading the cryptocurrency markets.
This article will focus on insights into the Standard deviation indicator, how it works, what it tells traders, its calculation, and the pros and cons of its application to trading the crypto and financial markets.
What Is The Standard Deviation Indicator And How Does It Work?
The Standard deviation indicator is a technical indicator that measures the magnitude of previous price actions and movements of a digital asset or cryptocurrency to forecast how volatile the price movements of that asset may be in the future.
Traders in the cryptocurrency and financial markets can utilize the Standard deviation indicator in determining whether a cryptocurrency’s price volatility and direction will move to the upside or experience downward movements.
A very high Standard deviation value of a cryptocurrency pair displayed on a price chart means that a significant price movement has recently taken place, but also suggests to traders that there may be a price retracement of that cryptocurrency owing to its sudden price volatility.
On the other hand, a low Standard deviation reading of a cryptocurrency pair shown on a price chart may suggest to traders that there may be an occurrence of bullish price volatility in the future or longer timeframes.
The Bollinger bands are also calculated using the standard deviation indicator, which is almost a synonym for volatility.
The Standard deviation indicator also gauges how far the price of a digital asset and cryptocurrency deviates from the moving average.
In other words, if the Standard deviation indicator’s value is high, the market is volatile, and candlesticks appear as long and widely spread.
On the other hand, if the Standard deviation indicator value is low, there is less market volatility, and prices are relatively close to the moving average.
Given that the Standard deviation indicator reflects market behavior, which fluctuates between very active and sluggish market price movement, it is simple to understand and interpret by traders and market participants.
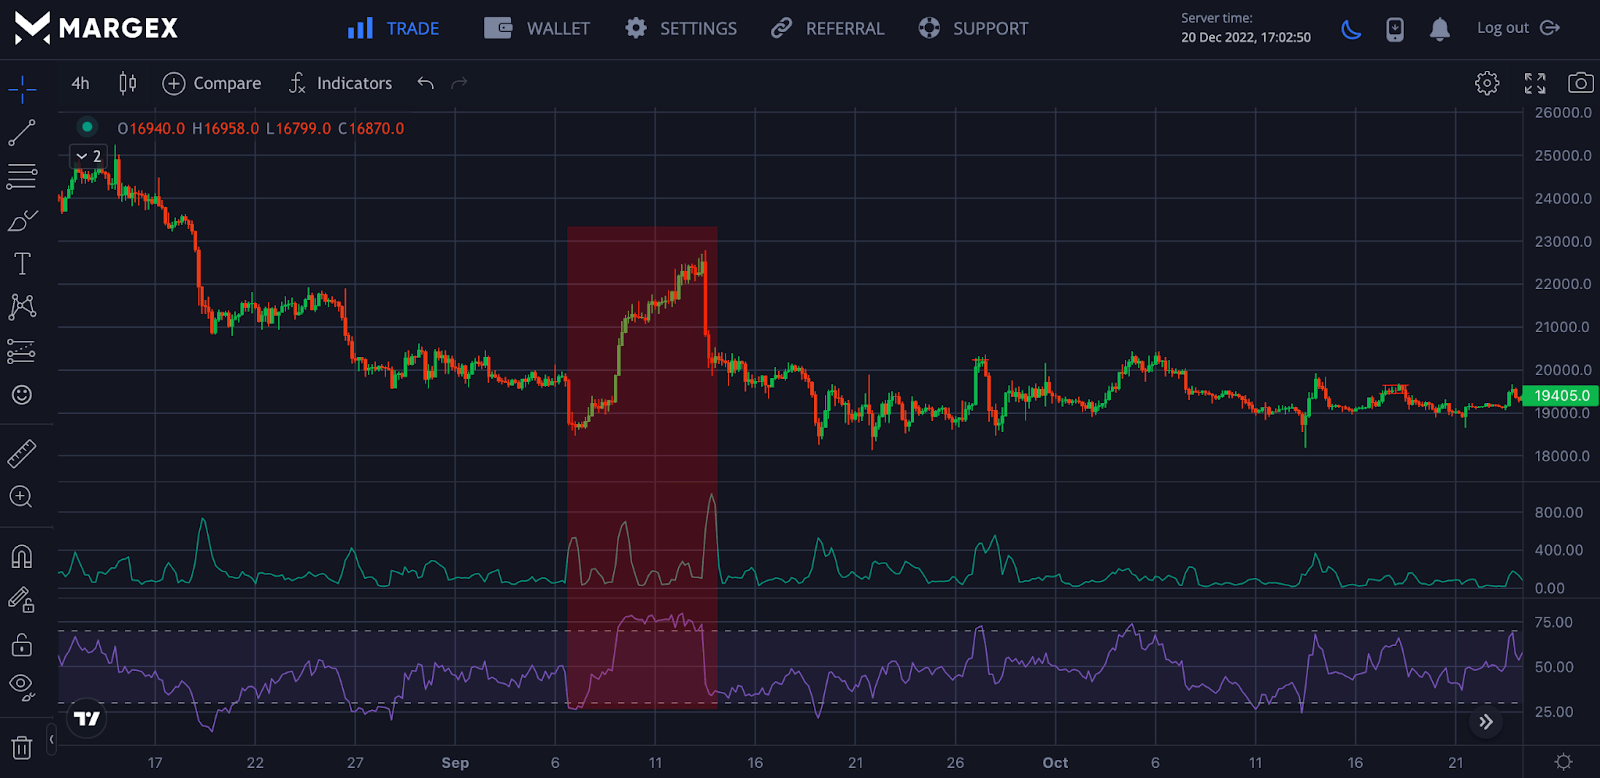
Example Of Standard Deviation Indicator

The image above shows the standard deviation indicator indicating the market volatility associated with the crypto market.
What Does A Standard Deviation Indicator Tell Traders?
The Standard deviation indicator gauges market turbulence and volatility and describes price variation compared to a moving average (typically calculated at 20 days).
When the Standard deviation indicator readings of a digital asset or cryptocurrency are high, it is a reflection and signal of the high price volatility of that particular cryptocurrency or digital asset pair.
When its indicator readings are low, it directly reflects a cryptocurrency pair’s low price movement with the potential for high price volatility and bullish momentum.
Smart traders take advantage of and leverage the trade data provided by the Standard deviation indicator alongside other indicators for multiple trade entry validations.
The data values and readings provided by the Standard deviation indicator can be helpful information to traders on potential market entry opportunities for long and short positions, respectively.
The standard deviation indicator is mainly used as a trader guide and market indicator in identifying trade opportunities in highly volatile cryptocurrency price movements and uptrends and downtrends.
Standard Deviation Indicator Formula – How To Calculate It
The Standard deviation indicator can be seamlessly utilized by traders only if its formula and calculations are understood thoroughly.
To calculate, use the statistic average square deviation formula below to determine trade readings and values :
The formula for calculating the Standard deviation indicator is Sqrt (SUM ((CLOSE – SMA (CLOSE, N)) ^ 2, N) /N).
Where
Sqrt stands for square root;
N for the calculation period;
SUM (…, N) is the SMA(N) value, and CLOSE for the closing price.
How to Calculate Standard deviation indicator
• Determine SMA (N)
• Deduct the SMA value from the current TF’s Close price.
• Square the outcome and tally it.
• Multiply the outcome by N.
Take the square root.
Pros And Cons Of Standard Deviation Indicator
The Standard deviation trading indicator, like every other trading indicator, has advantages and limitations that are unique to its application and usage. Let us look at some of the pros and cons of the Standard deviation trading indicator.
Pros
Simple And Easy To Calculate
One of the outstanding pros and benefits of using the standard deviation indicator is its ease of use and simplicity.
All a trader needs to leverage the Standard deviation indicator is to gather historical trade and price data of a cryptocurrency or digital asset and feed the data into a statistical software package or an online trading calculator present on recognized trading platforms such as Margex.
Volatility Measurement Indicator
As previously said in this article, the Standard deviation indicator is primarily used to gauge volatility.
The volatility of a cryptocurrency increases as the standard deviation indicator increases. The future volatility insight of a cryptocurrency provided by the Standard deviation indicator can be helpful to traders in making trading decisions and assessing their risk tolerance before entering into a trade with potential price volatility.
It Enables Traders Determine Stop-loss levels And Entry
Using the standard deviation trading strategy and indicator can help traders become decisive in choosing and setting stop-loss levels when entering into trades.
Traders may place their stop-loss entries at a level with a lot of volatility by using the standard deviation indicator. This will assist and go a long way in avoiding being prematurely stopped from open trades.
Cons
False Signals
A major limitation of the standard deviation indicator is that its volatility signals sometimes are false and go in the opposite direction of actual and real-time price movements.
Multiple Signal Limitations
The Standard deviation indicator measures only the price volatility of a cryptocurrency or a digital asset pair using historical trade data. It does not consider trade factors and price influencers, such as economic news, amongst other fundamentals.
How To Read Standard Deviation On Charts
Standard deviation does not provide trading signals for traders or investors but is used by analysts to have proper knowledge of market volatility. Paying the charts, traders and investors can easily identify price shifts in terms of volatility in the market. A change in the movement of the Standard deviation means volatility to an upward or downward movement could be imminent.
How To Use The Standard Deviation Indicator In Trading? (Step-By-Step Guide With Screenshots From Margex)
Margex is a bitcoin-based derivatives exchange with unique staking features that allow traders to stake and trade the same crypto assets allowing traders and investors to remain profitable.
On Margex, traders have the opportunity to trade with the standard deviation indicator, let us examine how to carry this out.
Step 1: Create A Margex Account
Create a free Margex account if you do not own one and deposit some funds into your account to enable you to put into practice all the technical analysis skills you are learning.
Step 2: Add Zig Zag Indicator To Your Trade
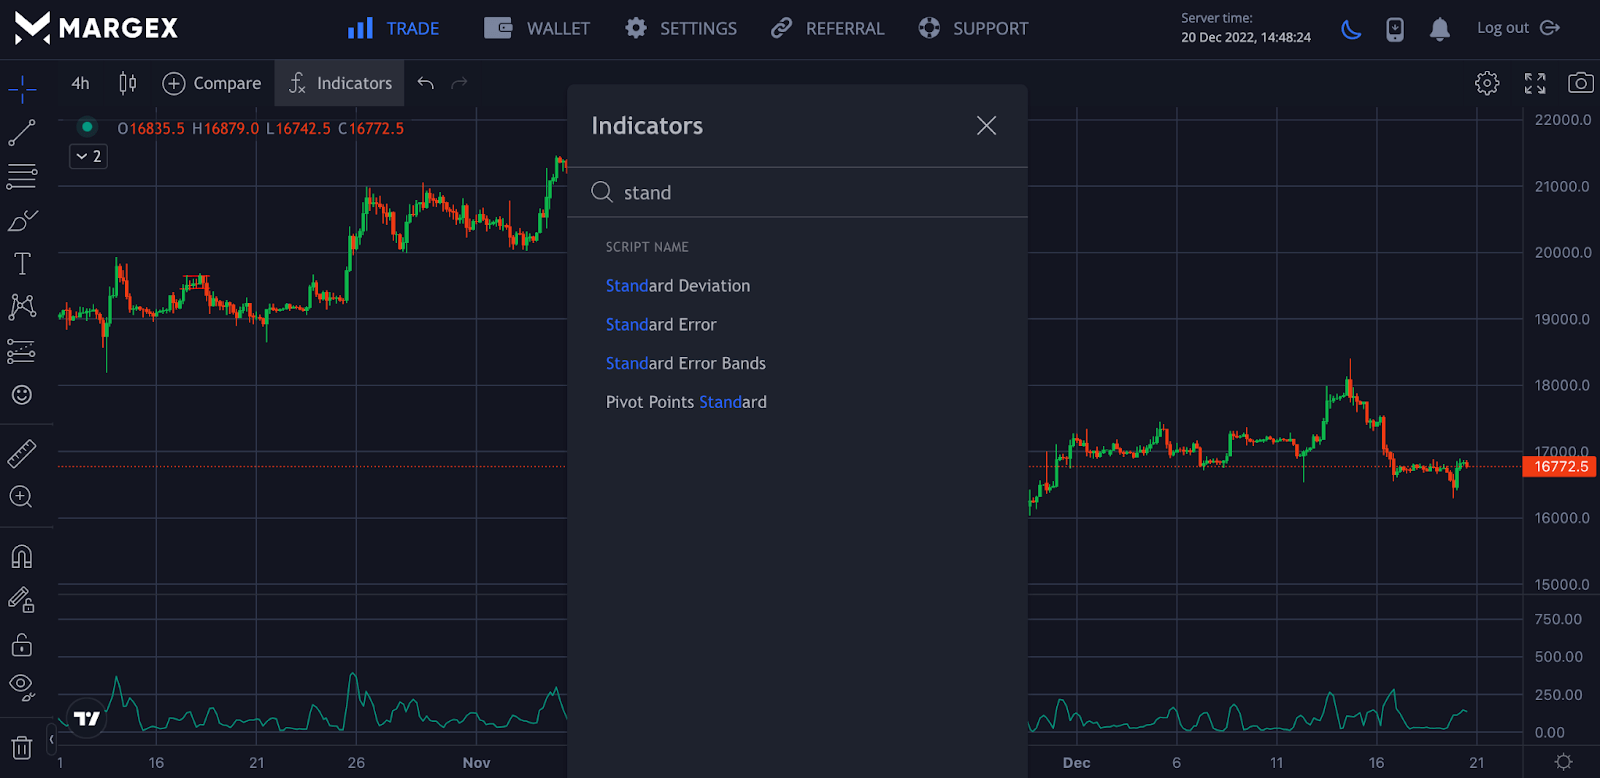
Click the trade button to open the technical analysis tools available. Then, click the indicator button to find the indicator you want to use; in this instance, the Standard Deviation Indicator, as shown in the image above.
Best Trading Strategy With Standard Deviation Indicator
Standard deviation can be combined with other trading strategy to yield profitable price returns. Let us consider an example.
Standard Deviation With RSI
Standard deviation can be used with relative strength index (RSI) to spot huge price volatility and prepare to trade with this is confirmed by other trading strategies. It is ideal to trade the Standard deviation with other technical analysis strategies that would produce better results. This indicator is not a signal indicator but gives traders an idea of impending market volatility.
Frequently Asked Questions On Standard Deviation Indicator
Is Standard Deviation A Lagging Indicator?
The Standard deviation indicator is a volatility indicator utilized by traders in spotting trade opportunities of volatile and non-volatile price movements of a cryptocurrency pair.
This indicator may be used alongside other trading indicators for multiple trade confirmations and signal validations.
Traders are advised to conduct extensive research into volatility indicators such as the Standard deviation indicator before utilizing its application to trading the crypto and financial markets.
How Do You Use The Standard Deviation Indicator?
The Standard deviation indicator is utilized by getting historical price volatility data of a given cryptocurrency and calculating using standard formula or a statistical online trading calculator to predict future price volatility.
The volatility outcomes and readings are not guaranteed and a hundred percent accurate and sometimes are false volatility signals.
Traders are advised to gain extensive knowledge of the applications of other trading indicators and use them alongside the Standard deviation indicator for multiple trade signal validations.
Is Standard Deviation An Indicator Of Risk?
In the event of the high volatility of a particular cryptocurrency and digital asset pair, the Standard deviation indicator may help traders assess their risk tolerance and applications of risk management strategies such as stop-loss entries.
The Standard deviation indicator is a volatility indicator that calculates the future price volatility of a cryptocurrency and digital asset pair.
Traders are advised to apply proper risk management to trading and build knowledge of other indicators and forms of technical analysis to become consistently profitable.


