
The mainstream adoption and evolution that has taken place in the crypto industry are more than tremendous, with many traders looking to become profitable and develop a better strategy to stay ahead of the market to maintain a better profit portfolio.
The result of this growth on the blockchain makes it challenging to stick with a single trading strategy and become successful or effective as a trader. Considering that the market operates in phases, one would look for the best technical analysis strategy that best goes with a particular market phase to preserve capital and minimize the risk potential.
With the right trading psychology, strategies, and chart patterns, a trader would profit from the market as there are countless opportunities in the crypto market.
In this guide, your knowledge of symmetrical triangle will be grounded, and you will be able to make a clear application and how to trade symmetrical triangle pattern on the chart.
Let us focus on the three scenarios for triangle patterns and how our knowledge about them can build a better trading strategy.
What Is A Triangle Pattern
A triangle pattern is a chart formation used by traders to determine the next move of an asset, either in a bullish or bearish trend. The triangle pattern consists of candlesticks enclosed by two converging lines making up support and resistance as the price fails to break upward or downward for a short time, with prices looking to range within this enclosed space.

The convergence of the two trendlines makes the triangle pattern, and traders use this pattern to trade price continuations, either bullish or bearish price e continuations. Due to the high success rate of the triangle pattern and the fact that it continues with its existing trend, traders find this tool extremely useful for trading a long or short position on potential trend confirmation.
Traders who use this triangle pattern will agree the triangle pattern is an objective tool that helps to test a market’s direction and potential breakout in the direction of volume with a good stop loss potential to manage risk. Triangle pattern provide a good entry time and ideas for volume buildup ahead of the potential breakout. There are three different triangle pattern in technical analysis- symmetrical triangle, descending triangle, and ascending triangle.
Ascending Triangle
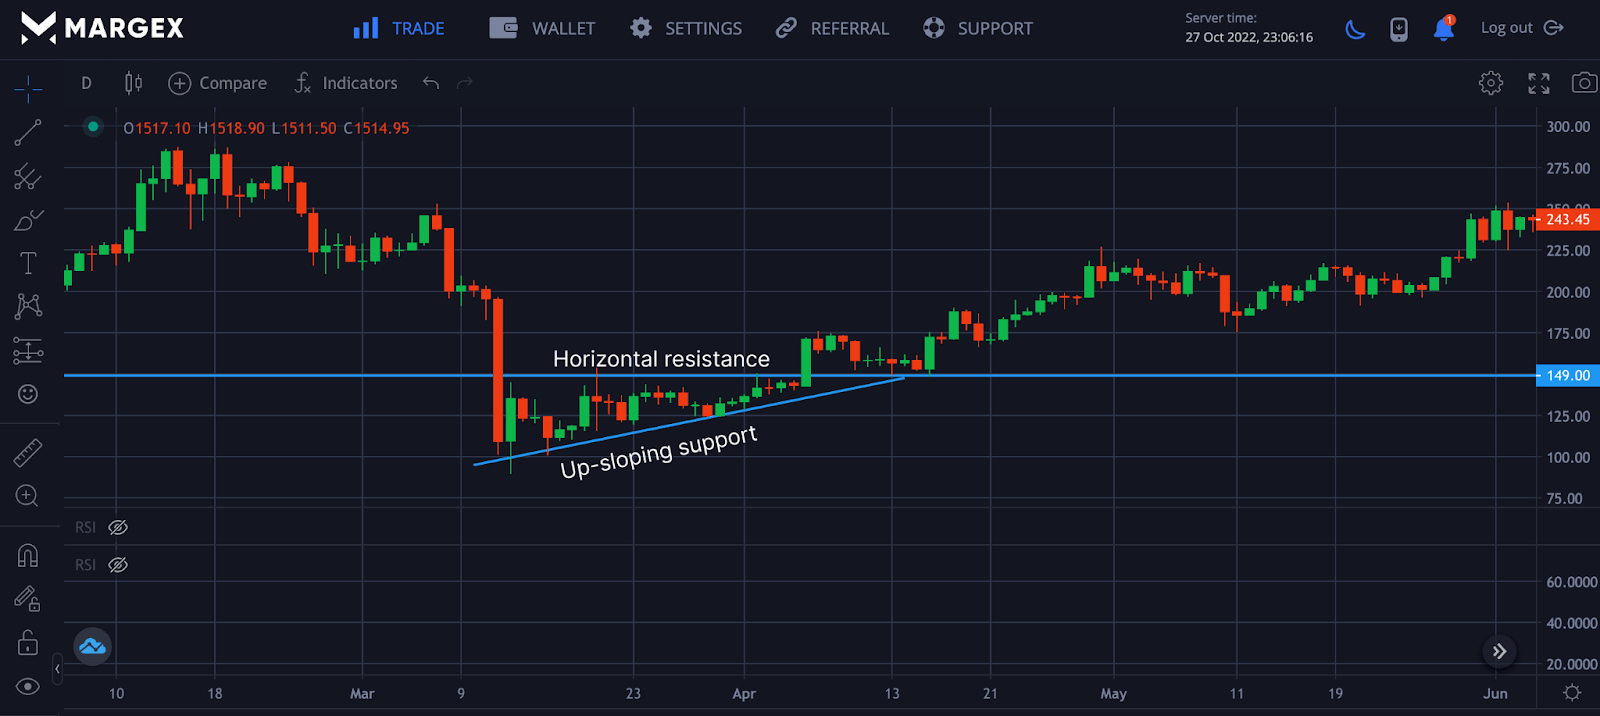
An ascending triangle is defined as price action formations of a horizontal top acting as a resistance and an up-sloping bottom acting as support as these two lines converge at a point.
A breakout can be on either side; it could be upside above the horizontal resistance or downside of the up-sloping line acting as the support. An ascending triangle pattern is formed when the two lines converge.
From the Image above, the price of the ETHUSD pair continued in a price range movement as the prices are guided by the two lines acting as horizontal resistance and up-sloping support as prices meet at the apex of the triangle pattern with a potential price breakout to the upside or downside of the chart. During the range movement, volume tends to be reduced with more volume accompanying the breakout.
Descending Triangle
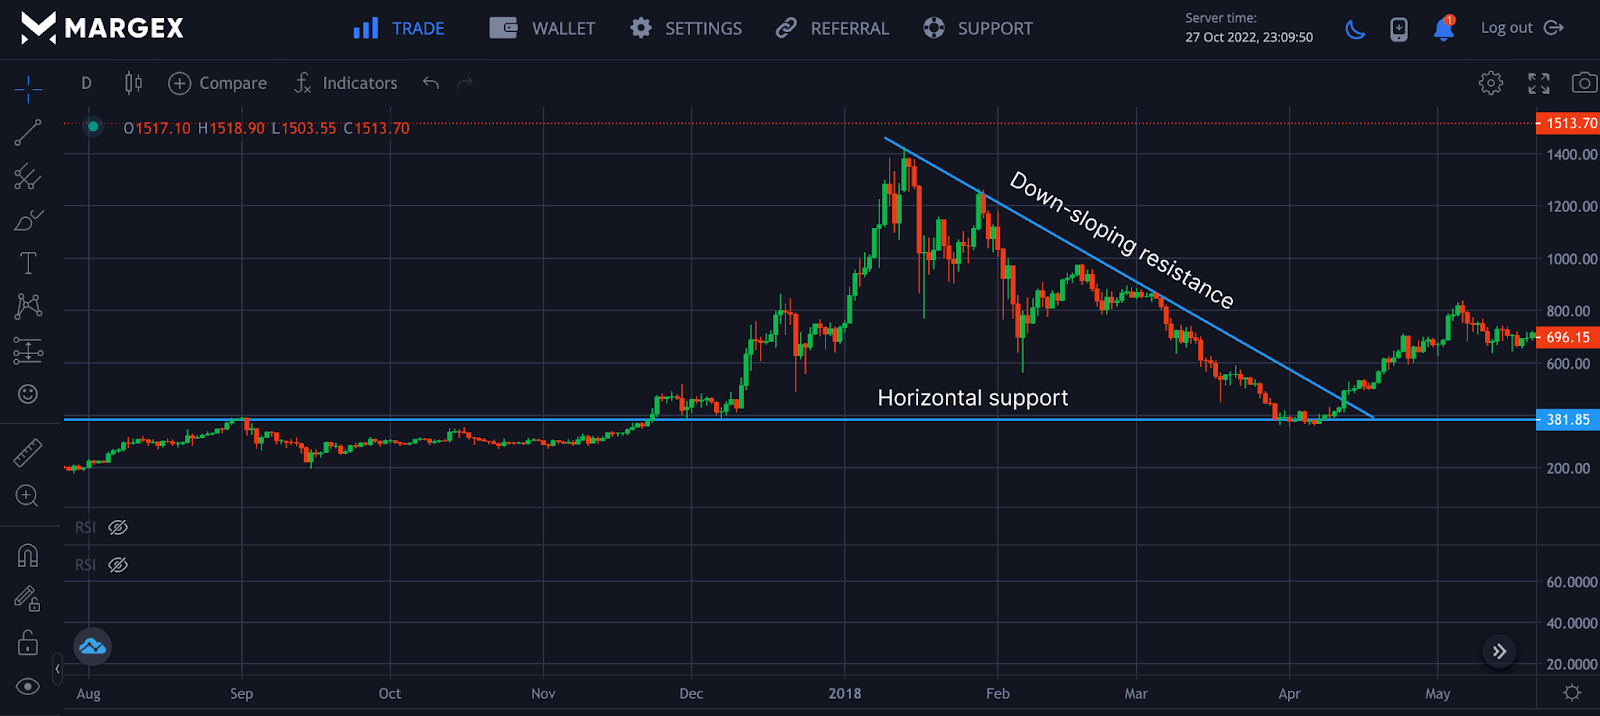
A descending triangle stands for a bearish pattern with which prices get rejected from rallying above with respect to a down-sloping line acting as the resistance with a flat horizontal support level holding off prices from going lower. Breakout from this pattern can be either upwards or downwards, with great volume accompanying it.
A trader who spots this pattern would be looking to enter either a short or long position on the breakout of this pattern.
Symmetrical Triangle

Symmetrical triangles are price formations in which both support and resistance lines slant and converge on one another. The resistance line descends from the top, while the support line ascends from the bottom.
What is a Symmetrical Triangle
The symmetrical triangle chart pattern indicates the formation of price action consolidating within a specific range before its major breakout, either uptrend or downtrend, depending on the direction of the price. A bullish symmetrical triangle pattern is a bullish continuation chart indicating price moving in the direction of its bullish trend after a minimal price consolidation. In contrast, a bearish symmetrical triangle pattern is a bearish price continuation pattern in the direction of bearish formation on a breakout out continuation of this chart pattern.
The symmetrical triangle pattern differs from a descending or ascending triangle pattern in that both triangles’ lower and upper trend lines slope towards the center point.
A horizontal upper trendline is formed in ascending triangles, indicating a higher breakout.
A descending triangle forms a horizontal lower trendline, indicating a lower breakout.
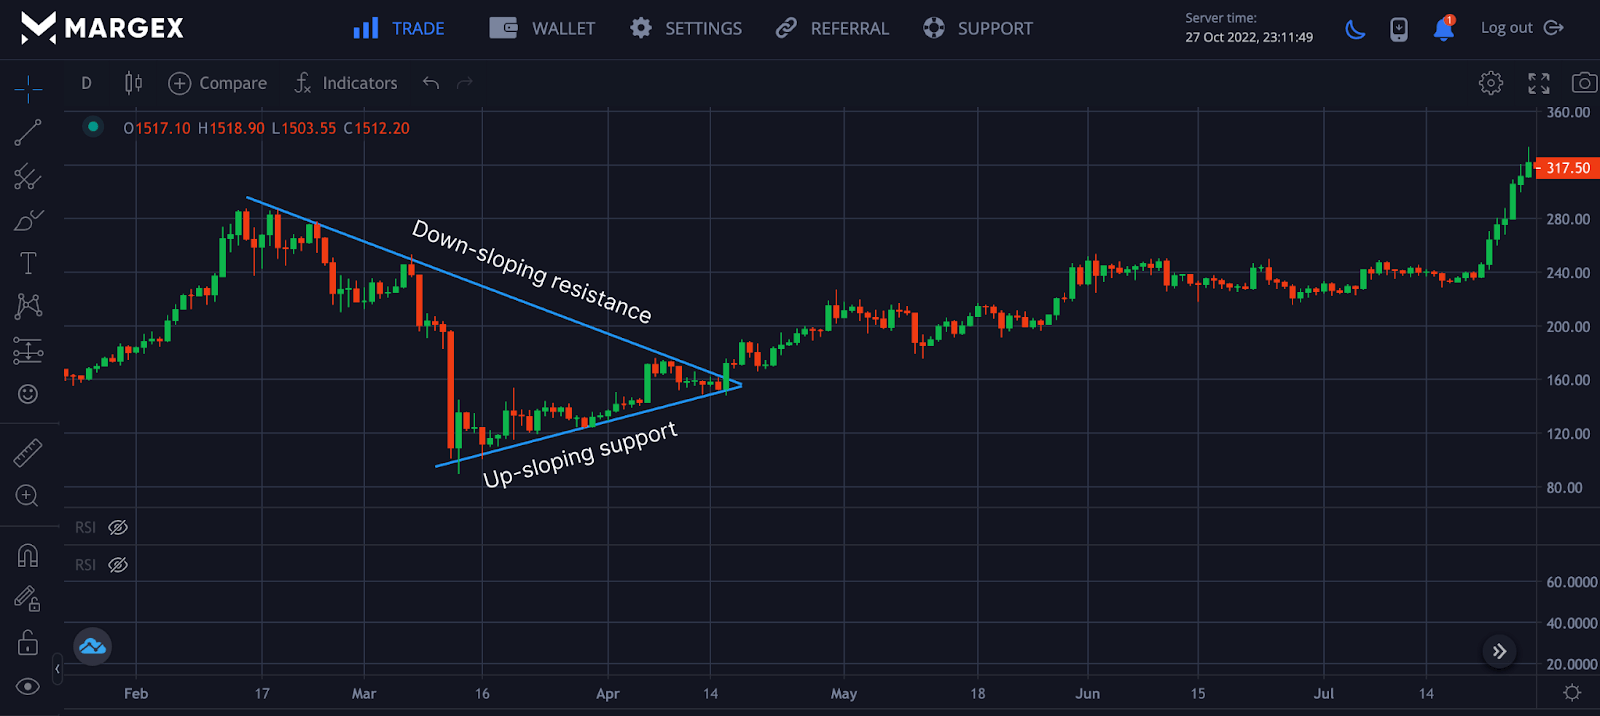
From the Image above, the price of ETHUSD continued to move in a range formation pattern as the two sloping lines acting as support and resistance guide the price with a potential breakout to the upside or downside with a trader looking to enter a position either long or short depending on the breakout of prices.
Symmetrical Triangles Explained
The symmetrical triangle chart pattern is represented by a period of price consolidating before a major breakout is forced to either upside or downside of the chart. A price breakdown from the lower trendline or up-sloping support initiates the start of a downtrend or bearish trend. In contrast, the breakout of the upper trendline or down-sloping resistance line initiates a new bullish trend or uptrend for price.
The take profit for the breakout or breakdown for a symmetrical triangle pattern is equal to the distance from the high and low of the earliest part of the pattern applied to the breakout price point.
Stop loss is often used in trading and, as such, should be used for symmetrical triangle patterns and can be placed just below breakout or above breakdown to minimize risk and maximize profit potential. For example, if the price of an asset breakout from $15, stop loss would be placed a few distances away from the breakout point of $15, let’s say around $13.5, to manage risk and increase the potential for profit to be kept.

Because of the upper and lower trendlines, a symmetrical triangle pattern differs from ascending and descending triangles, for an ascending triangle that has a horizontal upper trendline indicates pr predicting a potential breakout higher, while in contrast, descending triangle that has a horizontal lower trendline forecast or predicts potential price breakdown to lower prices.
Symmetrical triangles are almost the same with pennants and flags in some key ways but differ with the trendlines of the symmetrical triangle pattern looking to converge at its apex point. Despite how successful this pattern can be, it is not 100% accurate, and it would not be advised to trade it in isolation as several technical analysis tools can help or work with this strategy to produce the best results, filter price actions and volatility that comes with trading in the crypto market. With high volume moves, traders often use momentum indicators like the Relative Strength Index (RSI) to determine potential breakouts or breakdown of prices.
Symmetrical Triangle In Technical Analysis
Symmetrical triangle patterns are price continuation patterns, with price consolidating in a triangle bound by two converging trendlines with a potential breakout or breakdown depending on where the price goes. The ideal situation is to wait for a potential breakout or breakdown before entering a trade. Entering a trade prematurely could lead to a loss of funds as the exact price movement is unknown.
Real World Example Of A Symmetrical Triangle (Use Screens From Margex)
Margex is a Bitcoin-based derivatives exchange that allows users to trade with up to 100X leverage size. At the same time, users or traders can access the unique staking feature on the Margex platform that allows both beginner and advanced traders to trade and stake their crypto tokens with up to 13% APY returns on investment.
There are no lockup periods for staked assets, and staking rewards are sent to your staking balance on a daily basis with the help of the Margex automated system.
The user interface, user experience, and unique staking feature make the Margex platform the best you can find around in the crypto space.
To access all features of the Margex platform with free technical analysis tools, then you need to have an account with Margex and if you already have one, log in to access all of the Margex features.
Let us use Margex to find real examples of symmetrical triangle patterns we have discussed in this guide.
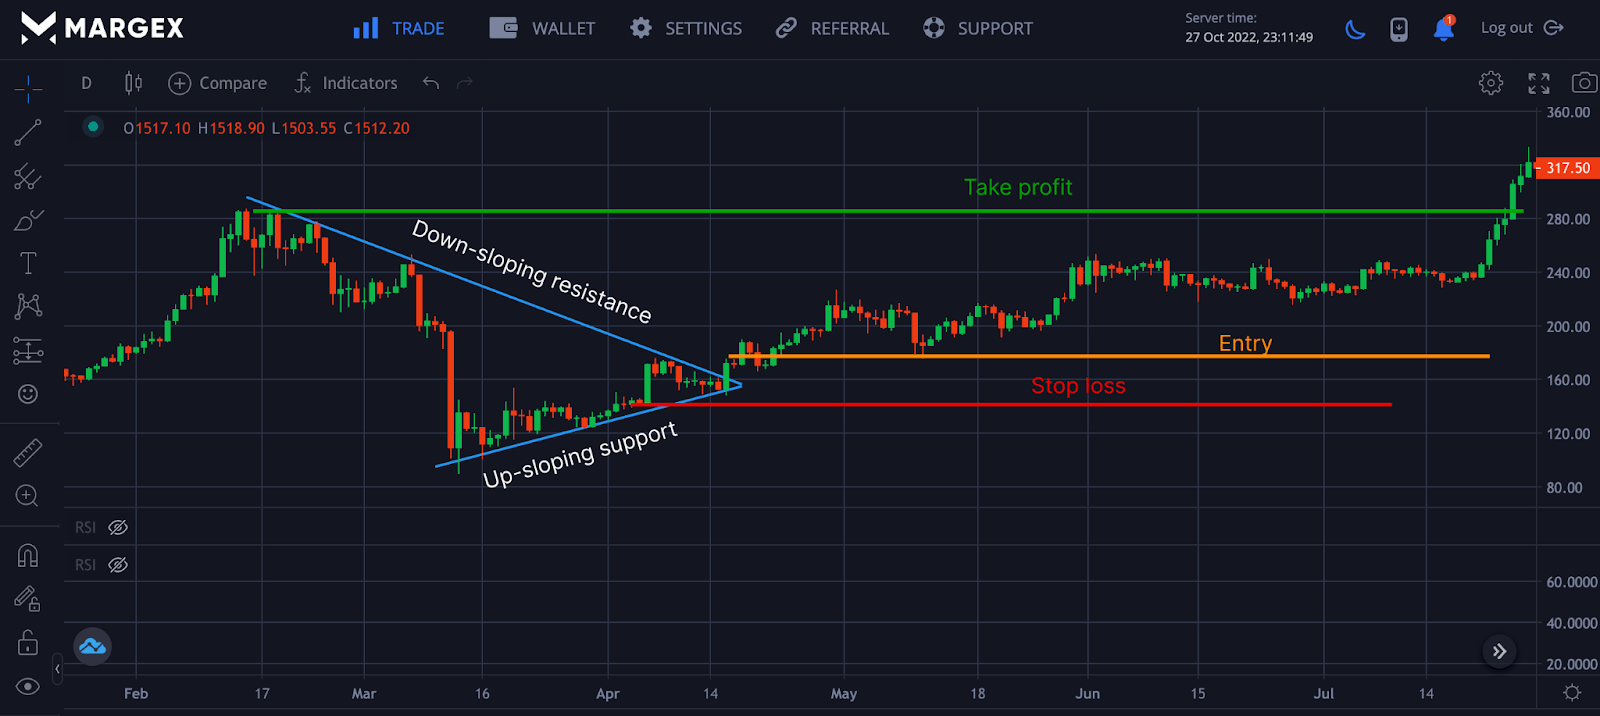
Above is an image of the ETHUSD bullish symmetrical triangle pattern with a potential breakout to the upside of the chart. Stop loss has been marked to manage risk accordingly with an entry point set on a breakout or breakdown of the symmetrical triangle pattern as the take profit helps the trader to lock in profit and avoid losing the trade to the market.
Trading with Symmetrical Triangle Chart Pattern
The symmetrical triangle chart pattern is a trend continuation pattern to either a bullish trend or a bearish trend depending on the breakout or breakdown of prices out of the triangle pattern. Here are key rules you should keep in mind when trading this pattern.
- Trendlines of the symmetrical triangle pattern should converge to an apex point.
- The bullish symmetrical triangle pattern should be formed in an uptrend as the price gears up for a breakout from the upper resistance trendline. In contrast, a bearish symmetrical pattern should be formed in a downtrend with a potential price breaking down to the lower support trendline.
Frequently Asked Questions (FAQ) About Symmetrical Triangle Pattern
Here are frequently asked questions about using and trading the symmetrical triangle pattern.
How To Use A Symmetrical Triangle?
The symmetrical triangle pattern formation on a price chart may indicate a potential breakout on either side of the triangle when it forms.
Traders may take advantage of a breakout from either side of the symmetrical triangle by entering short or long positions depending on the side of the triangle experiencing a breakout.
It is important for traders to employ proper safeguards and risk management when trading breakouts from symmetrical triangles and also validate breakouts and momentums using multiple indicators.
Traders are advised to carry out due diligence and personal research into chart pattern formations as well as gain knowledge of technical analysis in order to make sound trade decisions.
Does Symmetrical Triangle Chart Patterns Still Work?
The symmetrical triangle chart pattern is one of the many existing chart patterns utilized by traders in spotting trade opportunities.
Traders may leverage its pattern formation and profit from it if used skillfully and adequately with multiple technical indicators to back its communicating signals.
Traders who subject themselves to proper learning of technical analysis may be able to trade the symmetrical triangle chart pattern formations effectively.
Conducting personal research into market sentiments and outlook may also give insight to a trader on short and long-term price directions of an asset traded in the cryptocurrency markets.
How To Trade Using The Symmetrical Triangle On Margex?
The price forms a symmetrical triangle when it makes lower and higher lows. This typically indicates that neither the buyers nor the sellers can gain control, causing the price to range within a triangle.
Typically, the price trades between trend lines serve as support and resistance, preventing the price from breaking through to new highs or lows.
The first method for trading a symmetrical triangle is to look for a breakout on either side of the triangle and then trade in that direction. Before entering, wait for a candle to close above or below the trend line.
How Can You Identify If A Triangle Pattern Formation Is Symmetrical?
Symmetrical triangle pattern formations can be identified by looking out for two converging lines in a roughly equal slope connecting a series of sequential price peaks and lows.
Unlike other triangle patterns, such as the ascending and descending triangle pattern formations, the symmetrical triangle pattern may be seen as a consolidation or continuation chart pattern.
A price consolidation triangle chart pattern may present trade opportunities if a breakout successfully occurs on either side of the triangle chart pattern formation.
Traders may pay close attention to spotting symmetrical triangle pattern formation and conduct technical research on how to trade it.
How Can You Tell When A Symmetrical Triangle Will Break?
The probability of a symmetrical triangle pattern breaking out from either sides of its triangle may depend on several technical factors.
Market factors such as volume of demand for a particular asset or cryptocurrency may play a big role in determining breakout angles of a symmetrical triangle pattern formation.
A trader may be able to predict angles of a symmetrical triangle where a breakout is likely to occur by applying sound knowledge of technical analysis to trading digital assets.
Technical analysis of the financial and cryptocurrency markets is a skill every trader may need to develop to become profitable trading in the markets.


