Trading in a volatile market can be daunting, even for the most skilled trader. Volatility refers to price movements in a market.
Volatility indicators are technical tools used to measure the extent to which an asset deviates from its original price, either higher or lower.
The top five volatility indicators are Average true range (ATR), Bollinger bands, Keltner channels, Donchian channels) and Cboe volatility index (VIX).
With these indicators, traders can make more informed decisions and predict price movements for profitable trades.
Keep reading to find out more about these indicators and their application to trading.
Understanding Price Volatility?
This is the price change that traders observe in a financial asset at a given time. It is a measure of the rate of price movement. Sudden price changes in a market (choppy conditions) signify high volatility. A market with fewer price changes is a non-volatile market.
Price in a market cannot be static. It is either moving upwards, downwards, or sideways. Volatility measures the size of these changes and how fast they occur.
Swift market transitions make traders rush to take advantage of the high-low difference.
How To Identify Volatility On Margex?

Margex offers users access to the best technical indicators on the market for a more balanced trading experience. Traders can make more informed decisions in real time with an ultra-modern chart view featuring the right trading tools.
Traders can identify volatility using the following steps:
- Register on the Margex platform and deposit for an instant bonus.

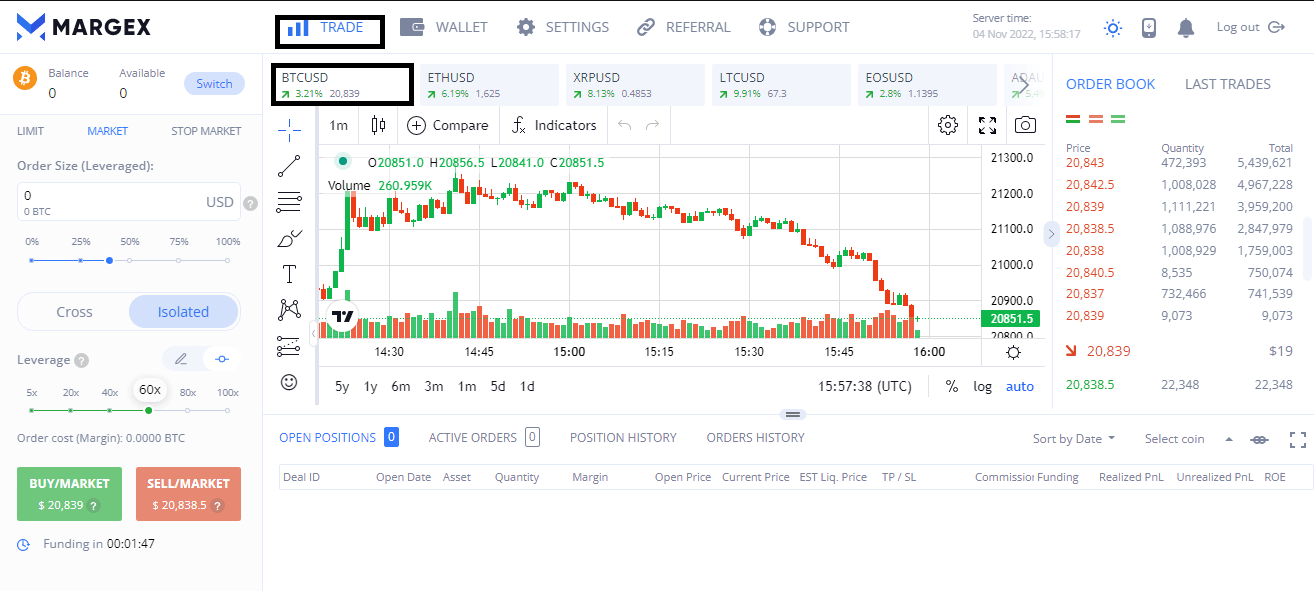
2. Go to trade view and select the chart you want to trade on.

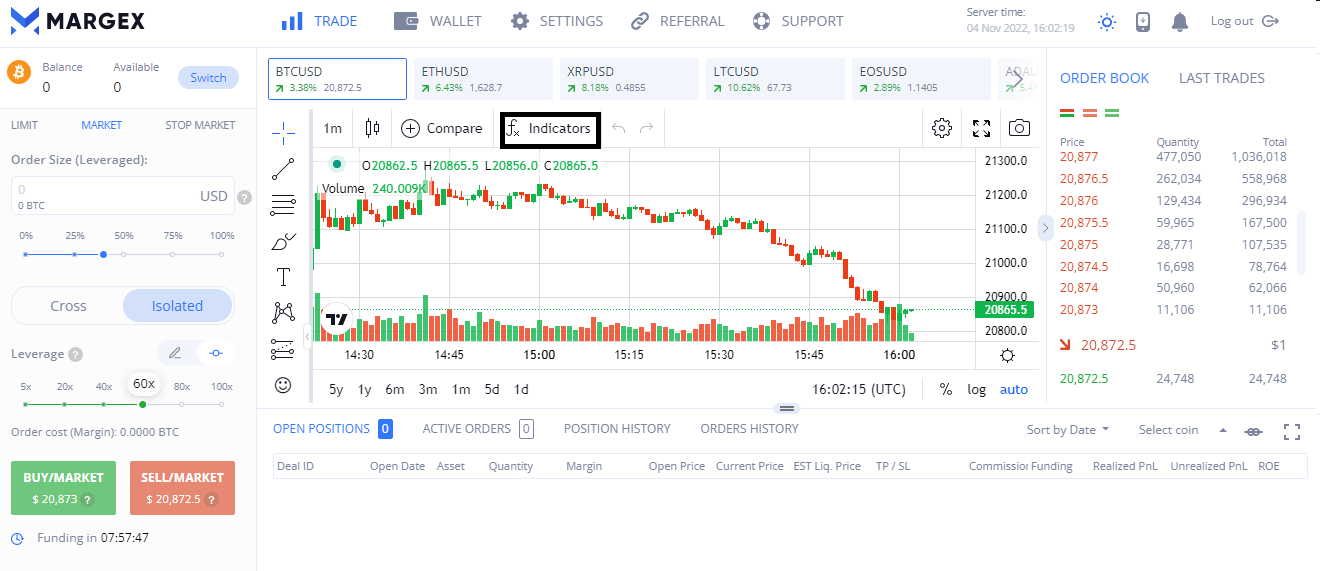
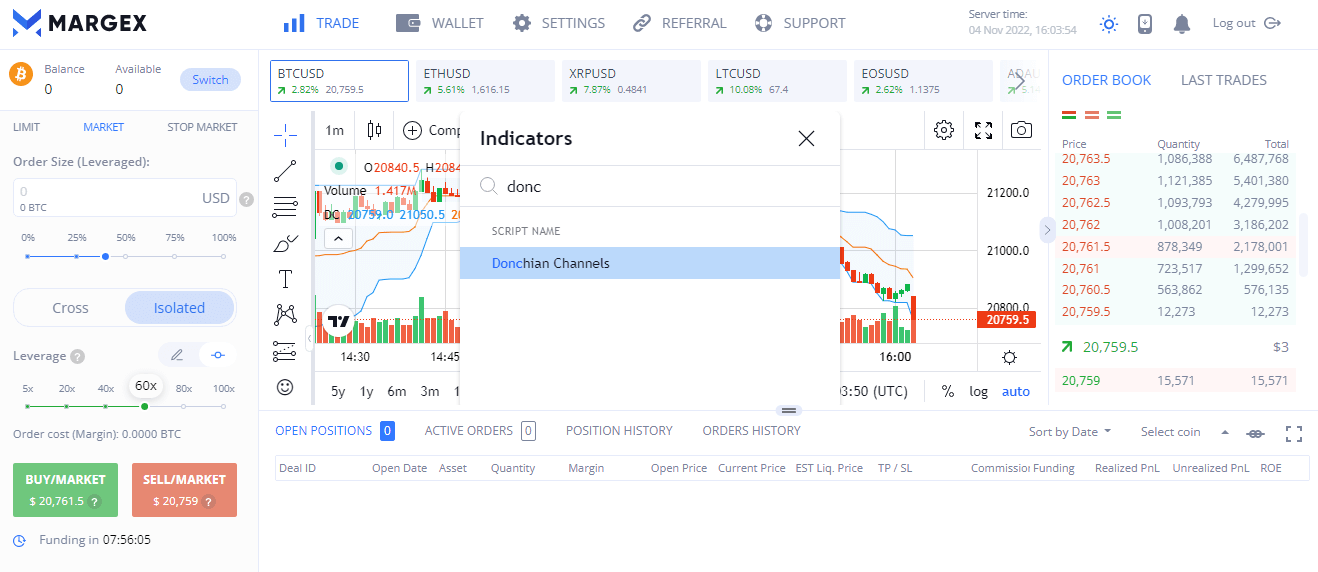
3. Click on indicators and select your indicator.


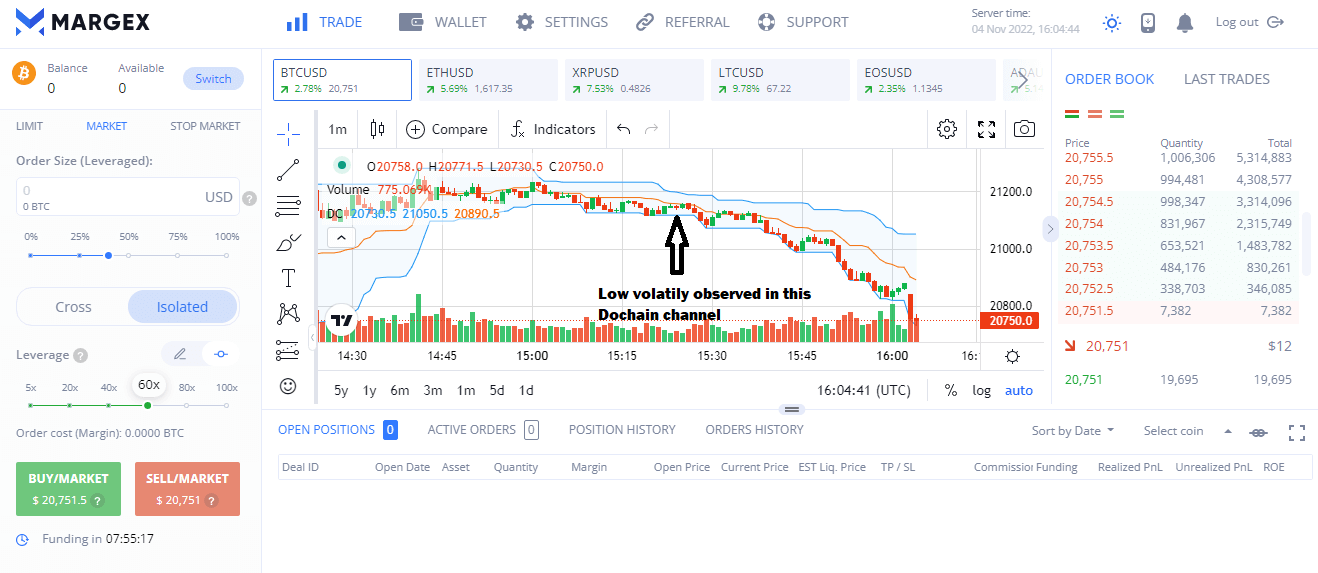
4. The indicator Donchian channels have been applied to your chart. Notice that the candles are closer to the lower line on this chart, signaling low volatility.
5. Use this information and make smart trades on Margex.

Two Different Levels Of Volatility
Volatility can be classified into two categories, High and low volatility.
High volatility
This is when the price of assets in a market change rapidly. High volatility is the perfect environment for short-term trades like scalping. The sudden price movements can lead to profit in a short while as well as increased trading risk.
Low volatility
This period is quieter in the market with fewer price changes. Low volatility is ideal for long-term traders with a more laid-back trading approach. However, these periods will not have much liquidity and the risks are significantly lower.
The Main Way To Calculate Volatility
A trader can calculate the volatility of a given asset with variance and standard deviation. The square root of the variance is your standard deviation. The variance is the change in price at the time.
Volatility is price change over a specific period. To get your volatility, multiply the standard deviation by the square root of the number of periods in your selected time frame.
Mathematically it can be represented as follows.
volatility=√TWhere: V = volatility over a specified period
σ = Standard deviation of returns
T = Number of periods
Top 5 Volatility Indicators
Numerous volatility indicators exist on a trading chart. However, these five indicators have consistently outperformed others with profitable returns.
1. Bollinger Bands Volatility Indicator
This volatility indicator comprises three lines or bands. The middle band represents a 20-day moving average. The upper band represents a +2 standard deviation from the middle band.
On the other hand, the lower band has a negative value of -2 standard deviation of the middle band.
Increased market volatility makes the bands expand, and they contract when the volatility decreases. Traders base their decisions on the upper and lower bands. Trades are placed when prices break out from the upper or lower bands after a consolidation or low volatility cycle.
The middle band represents the mean price of the asset.
How to calculate the Bollinger bands
The following steps will help you calculate the value of the Bollinger band on your chart:
- Input the value of the simple moving average of the particular asset, and make use of a 20-day SMA. This gets the average closing price in the range of 20 days.
- Calculate the standard deviation of your asset
- Multiply the value of your standard deviation by 2.
- Add and subtract your result from each point on the Simple moving average to get your upper and lower bands.
The interpretation of the Bollinger bands
A Bollinger band gives an estimate of historical price volatility with data. The upper and lower bands also serve as markers for price swings. Above the upper band, the asset is overbought and below the lower band, it is oversold.
2. Keltner Channel Volatility Indicator
The Keltner channel consists of three lines. The middle line shows the EMA (exponential moving average). The upper and lower lines are two independent Average true range (ATR) values.
The bands expand for higher volatility and contract when it is low.
How to calculate the Keltner channel
To calculate these volatility indicator bands, follow these steps:
- First, calculate the 20-day moving average to get the value of the middle line.
- Next, find the value of the upper line using this formula 20-day EMA + (2 X ATR (10))
- Lastly, calculate the value of the lower line using this formula 20-day EMA – (2 X ATR (10)).
You can apply Keltner channels to oil charts (commodity) and cryptocurrency charts.
The interpretation of the Keltner channel
This indicator is great for setting entry and exit points of trades. It helps traders locate overbought and oversold levels concerning a moving average. They also indicate the emergence of new trends.
In an uptrend, price action stays between the middle and top lines. While in a downtrend, the price stays between the middle and bottom lines. If the candles on a chart breakout above the channel, it is an indicator that most likely continue on an uptrend and vice versa.
3. Donchian Channel Volatility Indicator
The Donchian channels indicator also consists of three lines, with the middle line representing the moving average of a period. The upper line represents the highest price in that period, and the lower band represents the lowest price.
When the three lines converge together, there is little or no volatility in the market. The usual time frame used for the Donchian channel is a 4-week period. Traders can enter buy positions when prices break above the upper band or go short when they go below the lower band.
How to calculate the Donchian channel:
Calculate this volatility indicator with the following formula:
Upper Channel = Highest High in Last N Periods
Middle Channel = ((UC+LC)/2)
Lower Channel = Lowest Low in Last N periods
Where:
N= total number of timeframes selected for the price data, e.g., 20 days.
The interpretation
The upper channel represents the buy signal, while the lower channel represents the seller’s pressure. Donchian channels can help trade breakouts in the market. Once the price touches the upper channel, traders should open long positions.
If on the other hand, it touches the lower channel then the trades should be short.
4. Average True Range (ATR) Volatility Indicator:
This volatility indicator also measures the historical price volatility of a given asset or commodity. It calculates the price in a true range and creates a 14-day Exponential moving average (EMA).
How to calculate the ATR
To calculate ATR correctly, you must select a well-defined price range: the high of the particular time period minus the low. The true range is the highest value generated from calculating these three parameters:
- The current high – Current low (of the selected period)
- The absolute value of the current period high – the previous period’s close.
- The absolute value of the current period low – The previous period close
- True range = max (high – low), absolute (high – previous close), absolute (low – previous close).
- With the True range, the average true range can be derived.
- The common period used in average true range calculations is 7,14, and 20.
The interpretation
The ATR does not give details of price direction. It focuses on measuring volatility in the market. A high ATR value shows high market volatility, while low values are common in a quiet market scenario.
5. Cboe Volatility Index (VIX):
The VIX does not rely on historical data, but instead, it measures implied volatility. This is the expected market volatility in the current time frame. The former Chicago board options exchange (Now Chicago Board Global Markets) created it to monitor volatility in stocks.
It is popularly known as the “Fear gauge” or “fear Index” it is used to verify the fear level in the market. It is a common volatility indicator.
How to calculate the India VIX
Calculate the VIX by estimating expected volatility. You can derive this volatility estimate by collating the weighted prices of S&P 500 Index puts and calls for a wide range of strike prices.
Its VIX might look like an indicator meant for Stocks and indexes alone. However, Bitcoin’s recent correlation with the price movement of the S&P 500 is a sure sign that this indicator is relevant to every crypto trader.
The prices used for VIX calculations are the midpoint of Spx option bid or ask quotations in real-time.
The interpretation
This volatility indicator focuses on market uncertainty. It provides 30-day expected volatility values to traders. A rising VIX indicates more volatility while a falling one indicates a calmer market.
High VIX = high fear
Low VIX = Low fear
Other Volatility Indicators
There are numerous volatility indicators like the Ichimoku Kinko Hyo. Here are some others you can add to your trading experience.
Chaikin volatility indicator
This volatility indicator compares high and low prices over a specific timeframe. Volatility here is identified by a widening range between the high and low of the assets’ price.
It is the difference between two moving averages on a distribution line.
This indicator clearly reflects tops and bottoms in the market. If the market breaks out of the trading range, there is an increase in volatility.
Volatility bands
These bands are based on a given market’s historical or implied volatility. Traders can apply them to check the market’s volatility concerning the prices staying within or breaking out of the bands.
Volatility ratio (Schwager)
This is the technical indicator that identifies price patterns and breakouts in a market. It applies true range to understand the price movement of an asset to past volatility.
Relative volatility index (RVI)
It is similar to the Relative Strength Index (RSI). It measures the direction of volatility using the standard deviation of price changes. The RVI transitions in value from 0 to 100. The areas of interest are in the 20 and 80 range.
The 20 level is marked as the oversold region, while the 80 represents the overbought region of a given commodity. The strategy used by most traders is to buy at the oversold level and sell at the overbought level.
FAQ-Common Questions On Volatility Indicators
The answers below will provide additional information to understand these indicators.
Which indicator is the best for volatility?
The best volatility indicator is down to personal preference. However, Bollinger bands, Keitner channels, Donchian channels, Average true range, and India VIX are some of the most widely used.
These technical indicators give accurate data for traders to base their strategy on.
What indicator is best for measuring volatility?
Bollinger band is one of the most famous indicators for measuring volatility.
What does volatility strategy mean?
These are trading strategies to take advantage of price changes to make a profit.
Which strategy should a trader use in a volatile market?
High-frequency trading, scalping, and dollar-cost averaging are popular strategies in a volatile market.
What is the best way to analyze volatility?
Volatility is analyzed by comparing past price data to predict the next turn of events in the market.


