In the 17th century, the Japanese started applying technical analysis in the rice market. Although this kind of technical analysis differed from the one pioneered in the United States by Charles Dow in the early 1900s, many fundamental ideas remained the same.
- What happens (in terms of pricing) is more significant than why it happens (news, earnings, and so on).
- The pricing already accounts for all that is known.
- What buyers and sellers anticipate and feel drives market activity (fear and greed)
- The market always has its ups and downs.
- There is a chance that the market price is not reflective of true worth.
According to Steeve Nison, Candlestick charts (with a short and/or a long wick) didn’t develop until 1850. The famed rice merchant Homma of Sakata is often credited with inventing and popularizing candlestick charting. In all likelihood, the modern candlestick charting approach is based on modifications and refinements to the initial concepts made by traders over many years of market experience.
Candlesticks are a graphical depiction of the price action over a specific period. The typical components are the instrument’s open, high, low, and close prices.

What Exactly Is A Long Wick Candle?
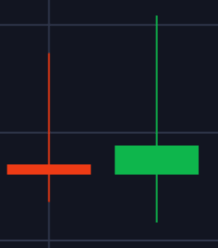
As a reversal indicator, the long wick candlestick pattern often resolves in the opposite direction of the prevailing trend, according to market participants. One of the most recognizable forms of candleholders, the hurricane, gets its name from how the candle’s long wick attaches to the candle body (see image below). When a candle’s body (long wick) is colored green, it implies the closing price is higher than the starting price. The candle would be red if the initial cost were higher than the closing price. Nonetheless, candle color is meaningless as a reversal indication. Instead, the placement of the candle is crucial in establishing whether it is a bullish or bearish reversal candlestick.

An illustration of the long wick candlestick pattern from the Margex trading platform
On Charts, How To Identify A Long Wick Candle
- Long wicks that are disproportionately longer than the surrounding wicks should be placed above/below a candle.
- Price action may detect critical price levels that may correlate with the long wick, indicating levels of support/resistance.
- Using the (lengthy) long wicks and basic levels, identify prospective trading opportunities.
Bullish Long Wick Candlestick
A long wick candlestick can be seen in the image below following a downturn in which the price decreased from roughly $20,482.5 to around $20,429.50. A long wick candlestick appears here as a possible bullish reversal signal, indicating that the asset is making a bottom, which a price gain may follow. The extended (long) wick underneath the candle body indicates sellers attempted to lower the price dramatically, but purchasers managed to drive it back up. Buyers demonstrated overpowering purchasing prowess, continuing over and leading to a price hike. In this case, the asset’s price soared to roughly $20,470 following the emergence of the long wick candlestick.

Bearish Long Wick Candlestick
A long wick candlestick can be seen in the image below following an upswing in which the price increased from roughly $1613.50 to around $1621.95. A long wick candlestick appears here as a possible bearish reversal signal, indicating that the asset is creating a top, which a price decline may follow. The extended wick above the candle body represents an unsuccessful attempt by buyers to overcome sellers. The sellers successfully drove the price down, and their momentum will continue into a price decline.

How To Trade On Margex On A Long Wick Candlestick?
Once traders can identify lengthy candlestick patterns regularly, they should examine how to enter or leave the market and set Stop Loss or Take Profit orders. Because the cryptocurrency market is volatile, the Stop Loss or Take Profit order should not be too near the entry price. Otherwise, it will activate too soon.
In extended wick candlestick trading, the Stop Loss order is often set around the candle’s closing price. The regulations for placing Take Profit orders are significantly more complicated. Take Profit orders are placed differently for bullish and bearish long wick candlesticks, depending on resistance and support levels. The following are the specifics of the degrees of resistance and support:
- The resistance level is the point at which an uptrend briefly slows owing to a concentration of supply from sellers. It is sometimes referred to as the price ceiling. When trading bullish long wick candlesticks, traders should position their Take Profit orders around the resistance level.
- A support level is a point at which a decline is momentarily halted owing to a concentration of buyer interest. It is often referred to as the pricing floor. When trading bearish long wick candlesticks, traders should position their Take Profit orders around the support level.

Trading On A Bullish Long Wick Candlestick
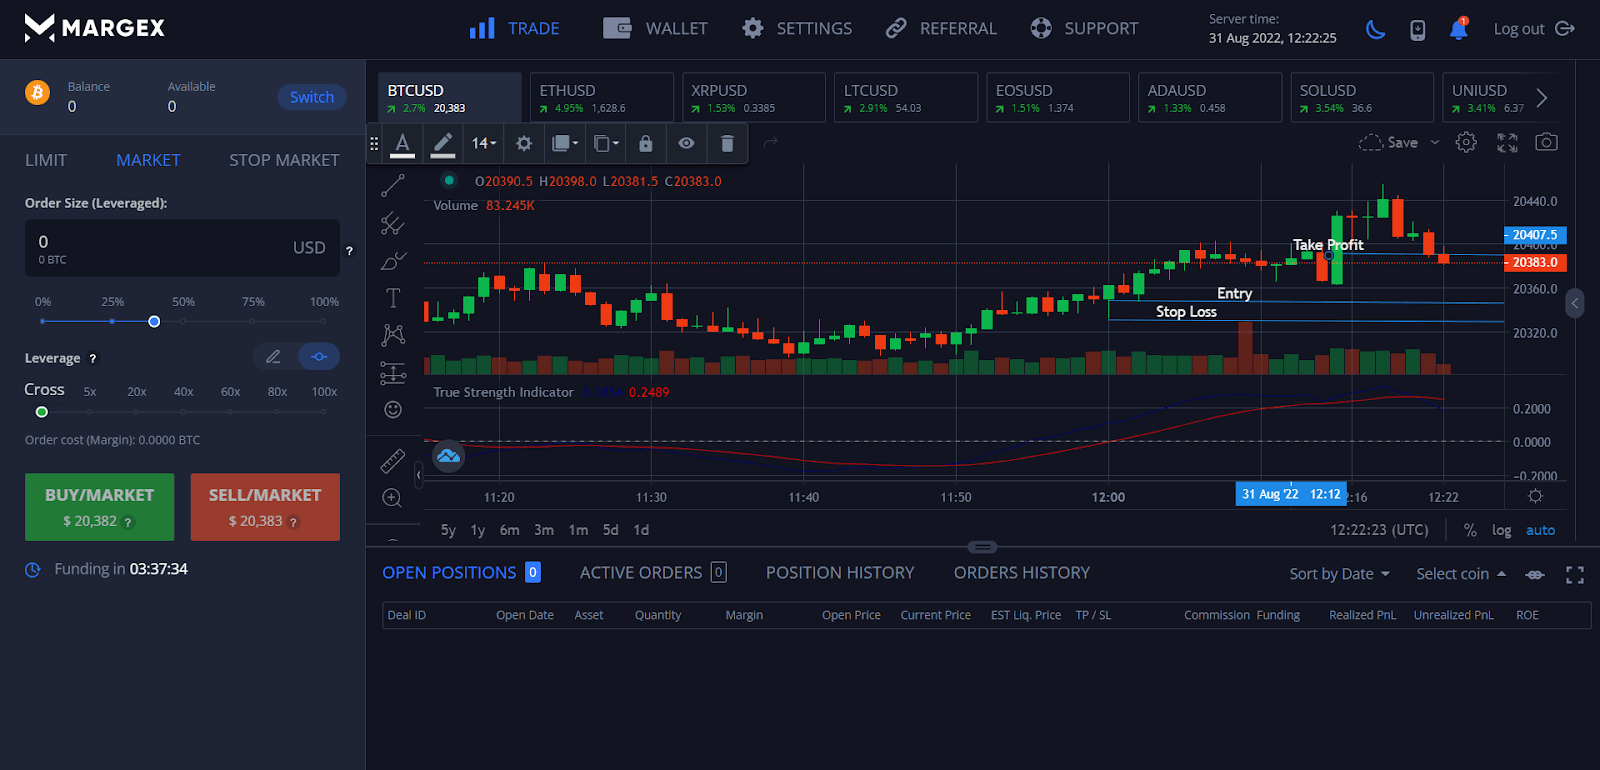
The image below shows how to enter a market after a bullish, long wick candlestick emerges. The following are the related steps:
- After a negative trend, the trader notices a bullish long wick candle. The candle is distinguished by its extended bottom shadow.
- The trader sets an order at about $20,347, the closing price of the indicated long wick candlestick, and prepares to go long.
- The trader sets a Stop Loss order at the bottom end of the long wick candlestick to minimize losses. The Stop Loss order is placed at roughly $20,331 in this scenario.
- The trader places a Take Profit order. Because this downtrend is turning bullish, traders should place a Take Profit order around the resistance level. The resistance level in this situation is about $20,404.

Trading On A Bearish Long Wick Candlestick
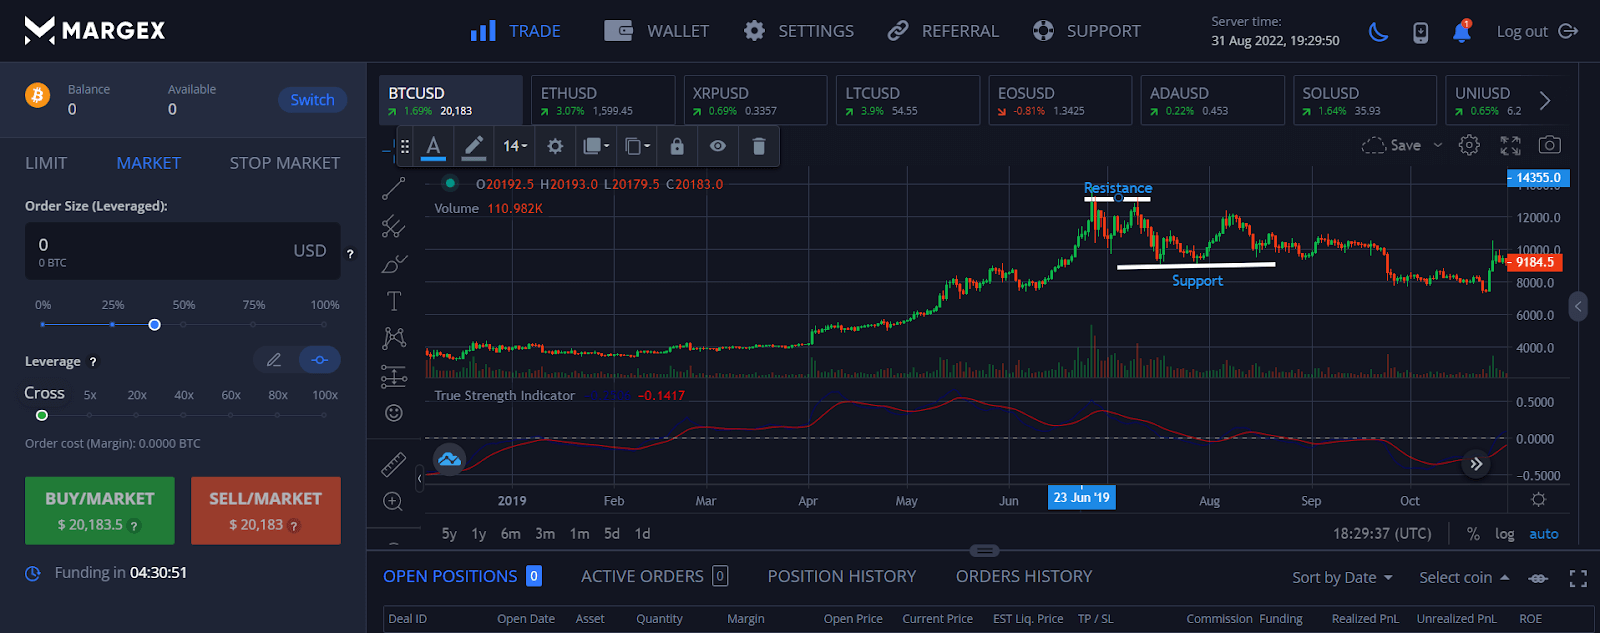
The image below shows how to leave a market following the emergence of a bearish long wick candlestick. The following are the related steps:
- After a bearish trend, the trader notices a bearish long wick candle. The candle is distinguished by its extended overhead shadow.
- The trader sets an order at about $20,081, the closing price of the indicated long wick candlestick, and prepares to go short.
- The trader sets a Stop Loss order at the upper end of the long wick candlestick to minimize losses. In this scenario, the Stop Loss order is placed at around $20,094.
- The trader places a Take Profit order. Because this uptrend is reverting into a negative trend, traders should place a Take Profit order around the support level. The support level in this situation is about $19,942.

How do you identify long wick candles?
When interpreting a candlestick chart, look for a candle with a lengthy wick, either above or below the body. When compared to similar candles, your wick should be noticeably longer.
Candles with lengthy upper wicks appear when a stock makes a significant advance towards its high point but then closes at a low price. This occurs when buyers attempt to control the majority of a trading session, but sellers ultimately drive down the cost of the share.
Conversely, a long lower wick candle (one in which the long wick is below the candle body) suggests a trading session in which sellers were dominant, but purchasers subsequently managed to drive up the share price.
The Long Wick Candle: Benefits And Limitations
Candlestick charts (with a short and/or a long wick) are one of the most extensively used techniques for technical analysis in the Forex and cryptocurrency trading markets, and for good reason. Most investors use these charts (with a short and/or a long wick) because they are a handy tool for quickly assessing the current state of the market.
Investors may easily understand how the market is going by merely looking at the colour, length of the candlestick and how long the wick of the candle which is especially valuable for those who utilize short-term trading strategies like scalping or day trading.
This chart with a short and long wick candle also makes determining the market’s anticipated direction exceedingly simple. They can tell if the upswing results from bullish momentum or a damaging surge. Furthermore, market patterns are considerably easier to spot since they reveal specific bullish and bearish reversal patterns not seen on other charts.
Candlestick charts have two sides, just like everything else in this market. Although it may be helpful to many investors, some traders choose not to use it. However, in this instance, the traders’ judgments are pretty personal, which does not exclude others from using these charts.
One of the drawbacks of utilizing Candlestick charts with long wicks in bitcoin or other trading markets is that there may be too much information for novice traders to perceive without prior expertise and knowledge of the Forex trading market.
As a result, before picking which chart with a short or long wick to use for market research, every trader must understand their specific demands in the crypto trading market. If you think the information supplied by this chart is too much for you, you can always use another sort of chart.
For example, the Heiken Ashi is a simpler variant of the candlestick chart commonly employed by traders to discern overall market trends.
FAQ
What do long candle wicks mean?
Whenever a trend is about to terminate, and just before the price movement reverses to start a new opposing trend, a candle with a long wick will appear.
There are two “wicks,” one at the top and one at the bottom, extending vertically from the candlestick’s rectangular “candle body.” On charts with time on the X-axis and price on the Y-axis, you may plot the price movement by drawing candles. An individual currency pair’s opening and closing prices are shown at the top and bottom of the candle body, respectively.
The body of the chart is green if the currency pair ends the period with a more excellent value than it did at the beginning of the period. The peak for the period is represented by the top of the wick and the low by the bottom. The two long wicks show the lack of a clear trend, suggesting that prices closed away from the period’s extremes.
What does the long green wick on top indicate?
A lengthy upper wick candlestick forms when the high is very powerful, but the close is relatively weak. This suggests that sellers successfully drove the price down, despite buyers’ attempts to control the session for a large portion of the time.
What does a long wick mean?
Because most transactions occurred between the open and closing prices, a short wick indicates that trading activity was relatively light over that time. Conversely, a lengthy wick means that the price activity has extended beyond the range between the open and closing prices.
What if both wicks are longer?
Most of the time, the top and lower wicks are unequal. There are, however, situations where neither long wick is noticeably longer than the other. These candles are distinguished by a short, narrow body and a long wick. A top-spinning candlestick is a candle holder that spins when the flame is lit. Because of this, it seems that the bulls and the bears, trading vigorously, have reached a deadlock.


