
A breakout is a technical analysis indicator where the price of an asset breaks above a key resistance level, or dips below a key support level. A breakout usually indicates that the price of the asset will start trending in the breakout direction.
How to find Crypto Breakouts
In order to find crypto breakouts, we need to understand support and resistance. It will be helpful to think of resistance and support as a series of well defined tops and bottoms, or highs and lows, which create ceilings and floors on prices.
When a cryptocurrency has reached several similarly priced highs over a short period of time, those price levels form a resistance zone, and when the price approaches that level, traders could be inclined to sell it in anticipation of it moving back lower into the zone. Likewise, when a crypto reaches several similarly priced lows, those levels become a support area. As the price approaches that level, traders would be inclined to buy as they anticipate that its price would move back higher within the zone because most times, prices trade within a range between their support and resistance levels. This is known as range trading.
However, there are instances where price breaks above the range and these range traders may lose money and be forced to cut losses. This results in a powerful and quick move when the crypto price breaks these clearly defined levels of resistance and support. The resultant move is the crypto breakout that we are looking for, and while it is impossible to predict when a crypto breakout will occur, there are several signs that a breakout could be imminent and breakout traders usually use these signs to find a crypto breakout.
Volatility
When the price of a cryptocurrency trades within a range, its volatility usually starts to decline as one side of the price action becomes more dominant than the other. A decrease in volatility is usually a sign that a breakout to the dominant side could be happening soon.
Duration of Consolidation
The longer a range has formed, the higher is its chance of a forceful breakout. This is due to the higher number of traders who get pulled into trading the range as it becomes more obvious with a longer period of being in existence. When a high number of traders enter a trade, there is a high number of stop-losses to get triggered when they get caught on the wrong side, hence, the more powerful the price movement to the dominant side is.
Volume
When crypto price is consolidating, its trading volume is usually low. Hence, when a crypto’s trading volume increases dramatically when its price is trading at or near a resistance or support, it is usually a sign of breakout in process. Typically, the more clearly defined the resistance and support price zones are, the higher the volume during a breakout as clearly defined resistance and support prices makes it easier to place a trade, and thus, attract more traders to trade.
Chart Patterns
Other than breakout from rectangle shaped horizontal support or resistance, breakouts often occur after the formation of familiar chart patterns. Examples of such chart patterns include but are not limited to, triangles, flags, wedges, pennants, or head and shoulders patterns. Remember that resistance or support do not always have to be horizontal.
Breakout Example:
Purely looking at words may not help the beginner trader visualise very well, so let us now take a look at a breakout example of an altcoin to give you an easy-to-understand illustration of how a breakout should look like.
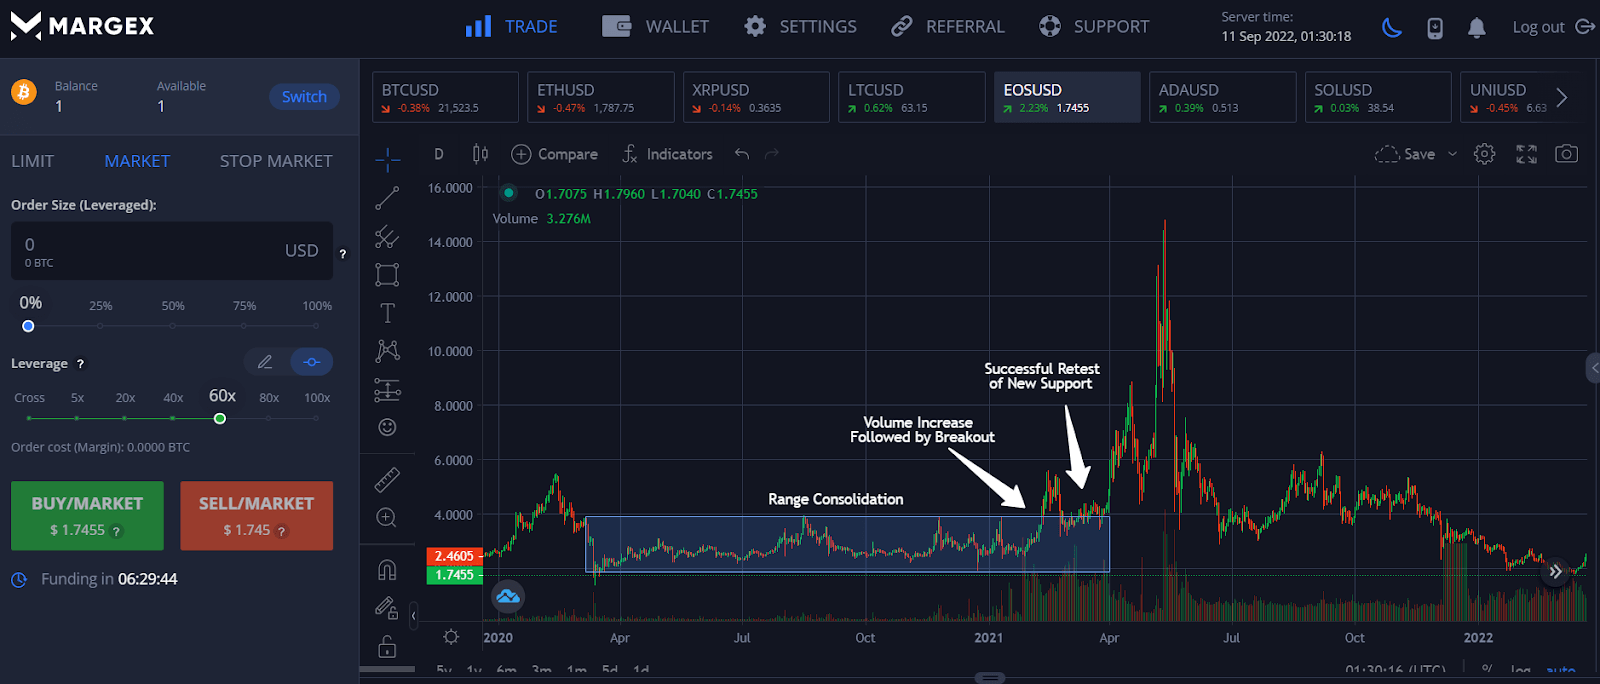
This altcoins is called EOS. In the daily chart diagram below, the EOSUSD pair had been consolidating within a range for a whole year between April 2020 and April 2021 before it did a powerful upside breakout eventually.
Notice that just prior to the breakout, the trading volume of EOSUSD started rising substantially. However, as price was still trading within the range, there was no way of knowing which way the breakout would be. Hence, a trader should only execute a trade after the price breaks out on one side. In this case, the price broke upwards on high volume. Traders are advised not to enter a trade immediately upon the breakout as the uptrend needs to be confirmed by the formation of a higher low. In this case, the new uptrend was retested with a pullback where the former resistance held as new support. This would be where you should be entering your trade. The price of EOS subsequently rallied explosively.
Breakout vs Fakeout
A breakout is not a sure win bet. There could be instances where the price fails to push forward into the new limits and falls back into the old trading range. These are called fakeouts. It is impossible to know if a breakout would fail and become a fakeout before it happens. Hence, traders are advised to put in stop-loss when trading breakouts.
As a precaution from getting trapped in a fakeout, traders are advised to wait for a confirmation of the breakout before entering a trade. This means that the trader would need to wait for a retest of the breakout level and for it to hold to become a new support or resistance, before setting an entry price, just like the above EOS example.
How to Trade a Breakout
Now that we have started explaining the trading part of a breakout, let us analyse how you should trade a breakout for the best results.
The Breakout Strategy
Breakout trading strategies can be applied on any timeframe. They work the same way whether you are using an hour chart, a daily chart, or a weekly chart. Similarly, breakout trading can be applied the same way on any chart type, be it candlesticks or bar charts.
After clarifying the basics, now let us examine a Bitcoin weekly chart to see how you should trade a breakout.
Setup for Our Breakout Strategy Example:
For our breakout trading example, we will be examining the price action of Bitcoin (BTC) between 2019 to 2020.
Entry
The first step of a breakout trading strategy is to set a precise entry price. Typically, traders watch the resistance or support of a rectangular consolidation like hawks. If the price breaks above resistance, traders go long; if price breaks below support, traders go short.
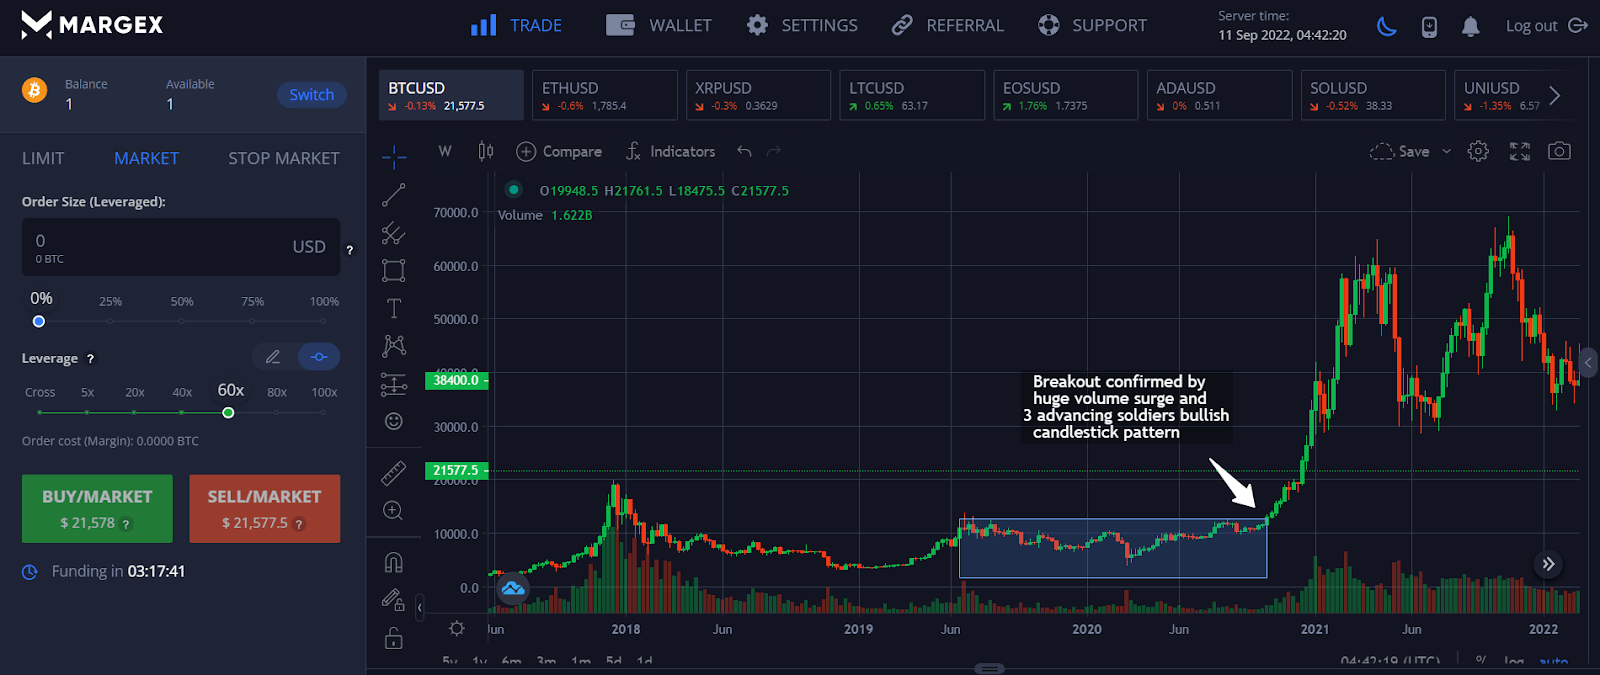
In the above BTC example, the price of BTC had been consolidating within a rectangle since June 2019 when the crypto market was in a bear market. Note that the trading volume had been on the low side throughout the consolidation period, but picked up significantly around October 2020 when the price of BTC started rising within the rectangle.
The price of BTC broke above its rectangle resistance of around $12,800 during the week of 19 October 2020. The up move was so powerful that the price of BTC did not even pull back to $12,800 for a retest. However, a candlestick formation called the three advancing soldiers, which is a very bullish chart pattern that signals the reversal of a downtrend, formed around the breakout region. This was a confirmation that the breakout level of $12,800 had turned into a strong new support.
A trader should open a long position after the price of BTC went above the new resistance level, which in this case, was the highest point of the three candles, at around $13,360, to ride the explosive uptrend that has been confirmed. This is how exact entry points can be established from breakout trading.
Stop Loss
As breakout trading is not a 100% guaranteed successful trade (in fact, no trades are), it is imperative for any trader to put a stop loss in case the breakout fails. In the case of the BTC example, since the new support is around $12,800, once that level is breached to the downside, it could mean that a fakeout could materialize and the prudent thing to do is to place a stop loss near, but below the level of $12,800. In this case, a level of around $12,200 would be suitable, implying a risk of only 8.6% (entry price $13,360 – stop loss price $12,200 = $1,160) for a potential 75% profit.

Take Profit Target
For a rectangle breakout, the estimation target to take-profit should be the maximum height of the rectangle. In the case of this BTC example, this profit target is around $10,000, which will translate to about $23,360 as the profit objective, for a minimum potential profit of around 75%.
Often, the new uptrend of a breakout may over extend, which could give the trader even more profit than expected. However, it is advisable to not be blinded by greed and choose not to take profit unless you are an advanced trader who knows how to use other technical indicators to help you manage your profit taking. An advanced trader may wish to use a trailing stop to help him maximise his profits.
Crypto Breakout FAQ
Now that we know how to find a crypto breakout and have also seen examples and strategies in breakout trading, let us do some final revisions before our article ends.
Are There Different Patterns for a Breakout?
Yes, a breakout can occur from various different patterns. These can be from rectangles, triangles, flags, pennants, and more. Please refer to our article above for more information.
What Are the Limitations of Breakout Analysis?
Breakout analysis generally performs better during times of volatility in the absence of major news events. Sudden news events like company announcements or an unexpected macro event like a terrorist attack can drastically affect the trend of a move, which may affect the result of a breakout analysis.
In addition, there is no way of knowing if a breakout analysis will yield a successful result until after the event. Oftentimes, a breakout signal leads to a fakeout, which would incur losses for a trader. This is why a breakout trading strategy has to come with a stop-loss.
Is Breakout Bullish or Bearish?
A breakout can be bullish or bearish depending on the direction of the breakout move.
Is Breakout Trading Profitable?
While breakout trading has its limitations, it remains one of the most profitable trading strategies due to the low risk vs high reward it offers. As the stop-loss levels for breakout trading is often near and easy to define, while the profit target can be many times the stop-loss level due to the explosive move of a successful breakout, trading a breakout strategy is highly profitable.


