
What is a Bull flag pattern?
Investing and trading are market activities with multiple participants and an infinite number of elements interacting with each other. Trying to predict a market without considering the whole context is about as useful as trying to predict where a particular molecule of water will end up in the ocean after a certain period of time. A physical oceanographer would be able to analyze ocean currents, temperature, atmospheric pressure, and several other elements to make a best guess about the behavior of the ocean as a whole. A physical oceanographer may not be able to predict where a molecule will end up, but they will be able to predict how many waves should hit the beach in a given period and how big they are.
Market analysis, like physical oceanography, has numerous elements we can look at to predict market movements, such as chart patterns that can be used for trading. It can be day trading (in which the trader buys and sells in a time frame shorter than 24 hours) and swing trading (in which the investor holds the asset to trade for a period of 24 hours). Of the many chart patterns, one stands out as one of the most basic and most widely used: the “bull flag” pattern, sometimes also referred to as a “bull flag.”
The bull flag chart pattern is widely used by investors in a variety of different types of markets and assets traded on them. Traders use this chart pattern for stocks, commodities, derivatives, futures, options… Wherever you find a market, you can find several traders and their bull flags.
So, without further ado, and given that an image speaks a thousand words, here is what the classic bull flag pattern looks like, as will be described later. Pardon the simplicity, but the first time you come in contact with a graph pattern you should keep a simple “design” in mind.
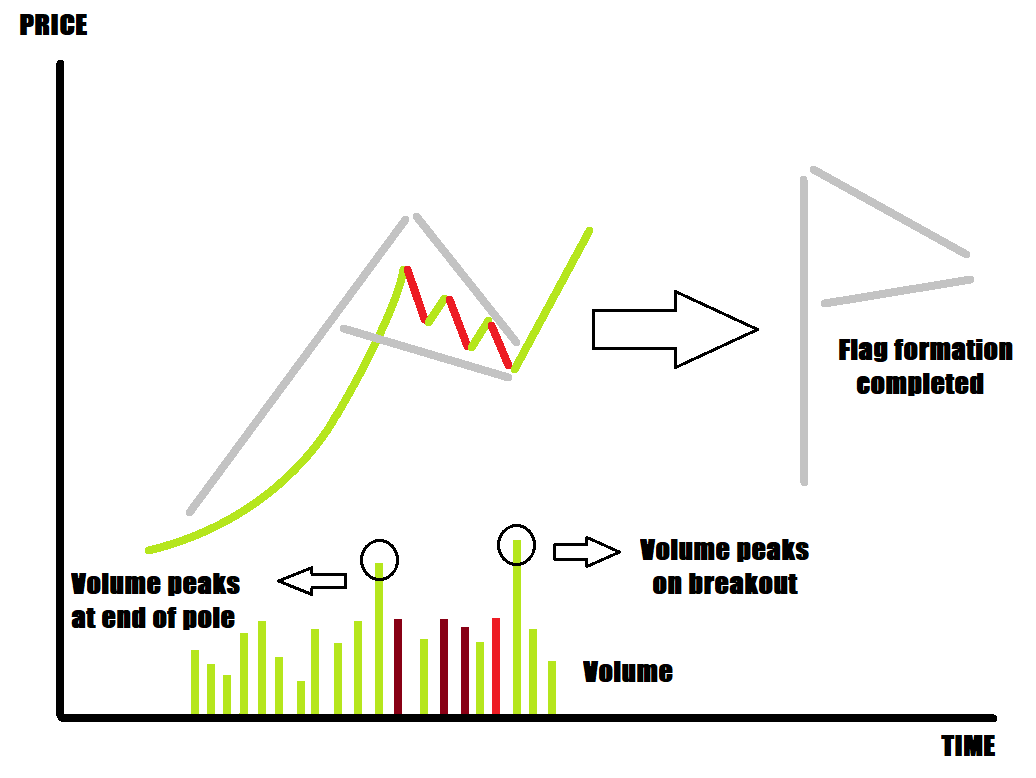
It is worth noting: some people like to distinguish “flag pattern” from “pennant pattern”, claiming that “the flag is rectangular and the pennant is triangular”. While this is semantically true, in the world of technical analysis both models are essentially the same: continuation models. In both a “bullish pennant” and a “bullish flag” there should be a high volume pillar, a consolidation phase where price does not cross the top of the pillar and only declines slightly, followed by a breakout point with strong volume. Thus, if the behavior is the same, and the designs used to identify it are very similar, there is no need to distinguish one from the other, since that would be essentially the same as distinguishing “water” from “ice” from “steam”: they are all the same substance, H²O.
There is also an opposite analogue of the bull flag pattern known as the bear flag pattern or bear flag pattern. Although the opposite of a bull flag is predicted, you can use the same technical analysis to identify bear flags, with a few differing details here and there.
How does one identify a Bullish flag pattern?
The bull flag is a small consolidation area of the price channel that resembles a flag pole. It is characterized by strong price action in the upward direction (price increase), with high volume, followed by the aforementioned price consolidation, where for a period of time the price of the asset will move mostly sideways or decline, on relatively lower volume, resembling a flag. The expected outcome after the consolidation period is a continuation of the uptrend with relatively higher volume. The trader can take advantage of identifying the bull flag and anticipate the breakout point by betting on a continuation of the previous uptrend.
Identifying a real Bull flag pattern example on the Cryptoasset market:
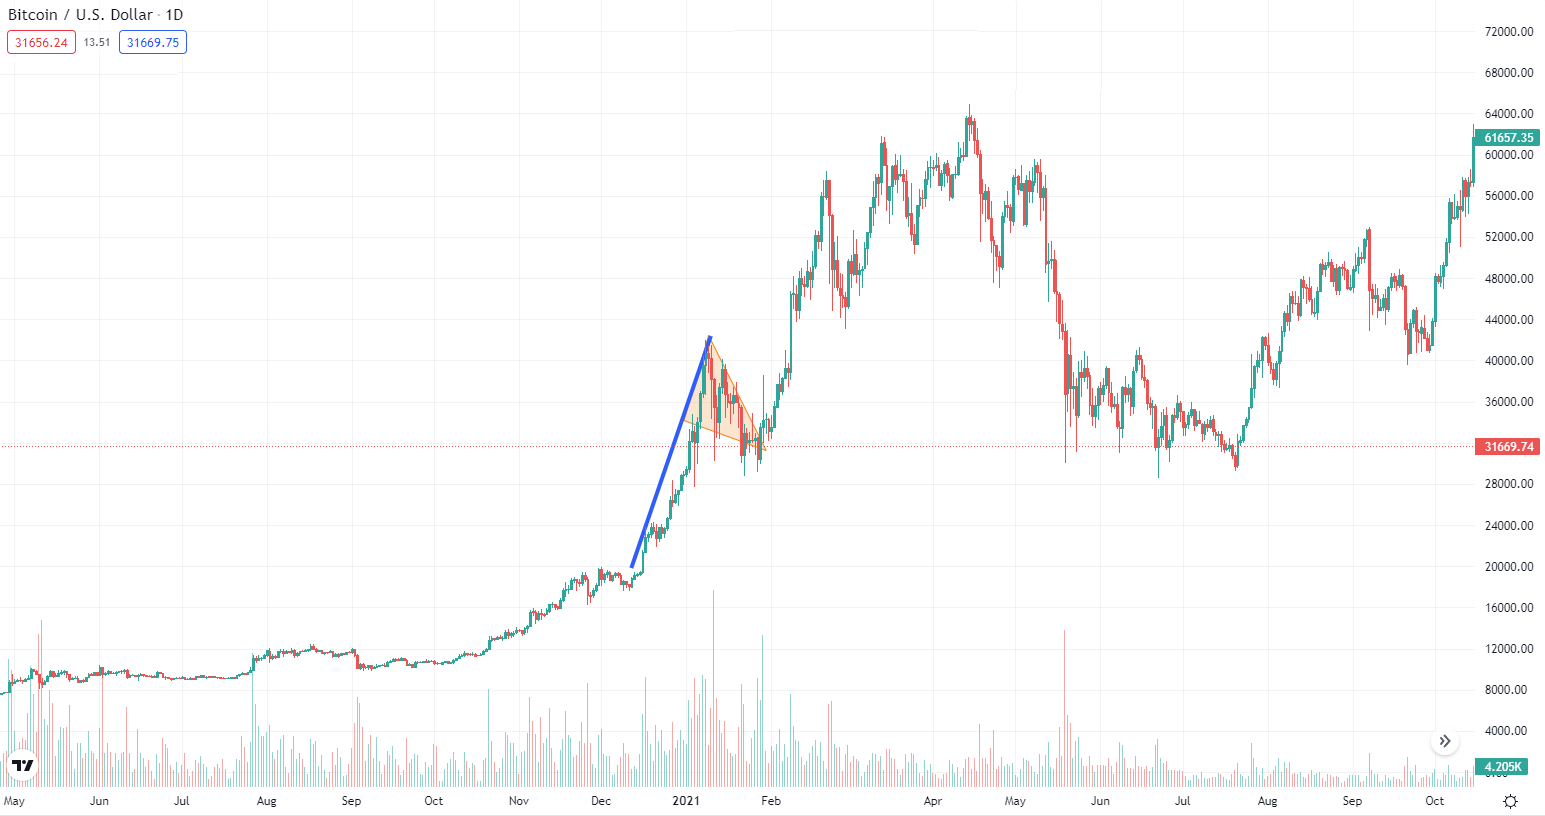
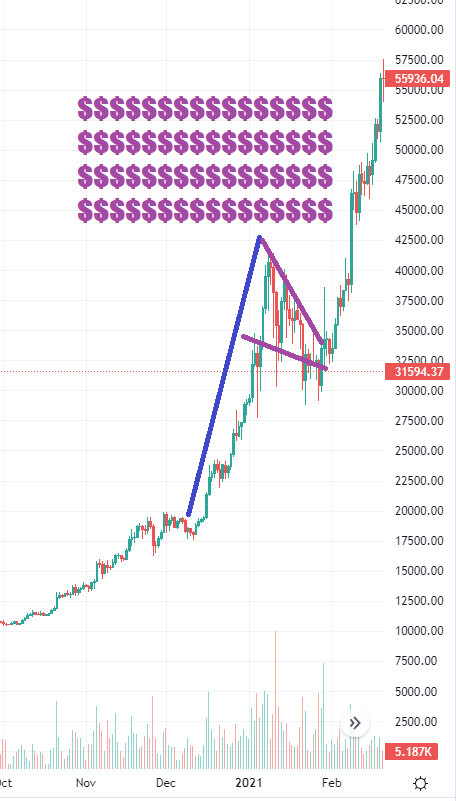
Given that crypto markets are active and can be traded 24 hours a day and 365 days a year, it is very easy to find examples of chart patterns of different assets. For this entire article, we will look at a real-world example of a bull flag pattern of Bitcoin (BTC)’s in the period from May 2020 to October 2021, a time frame in which the asset’s price increased several times from approximately $8,000.00 to $63,000.00. Specifically, we will analyze exactly the period between December 2020 and February 2021, where a very clear bull flag pattern can be detected.
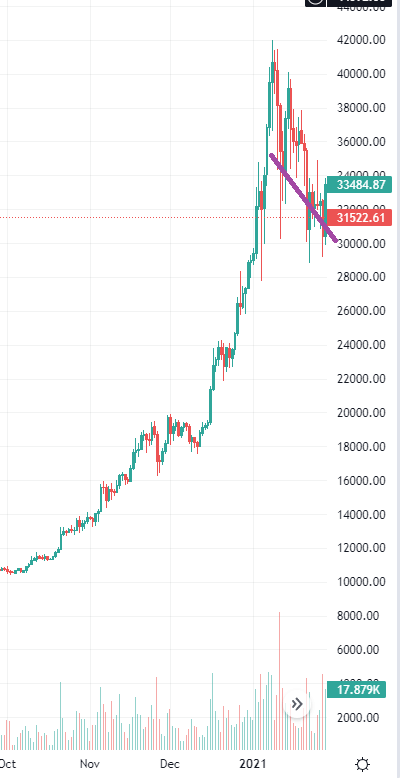
This is a real example of a bull flag chart pattern that occurs on the charts of an asset. You can see a sharp rise in price with relatively higher volume represented by the blue flag pole, followed by a period of consolidation with relatively lower volume represented by the orange flag, which is finally followed by a breakout point in the uptrend continuing the pattern.
Note that volume was increasing and peaked during the trading sessions when the flag pole formed from December 2020 to early January 2021. Also, notice that volume peaked again after the pattern breakout occurred starting in February 2021.
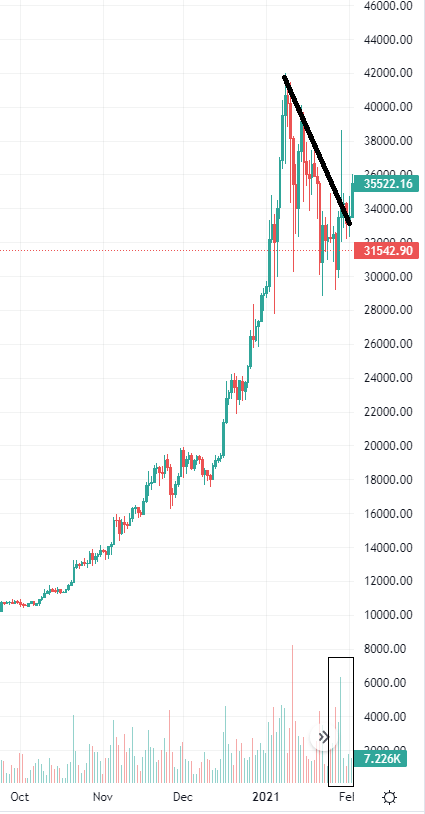
However, it is important to realize that markets are organic and the same pattern will never repeat itself in exactly the same way. There will be small differences, but the overall picture will usually be very similar. Some traders and investors like to do a more in-depth technical analysis of chart patterns such as the bull flag and will go in depth analyzing, for example, the behavior of candles and wicks.
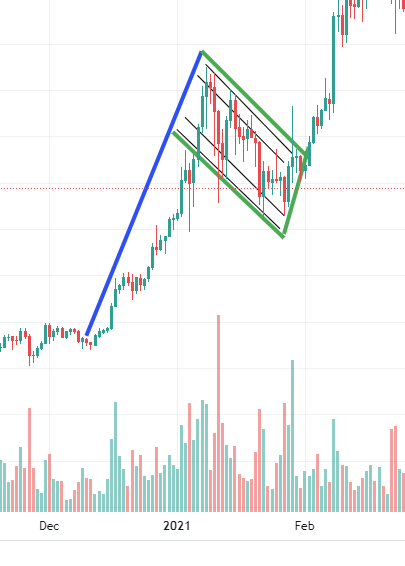
In the image above you can see a different technical analysis of the same bullish flag pattern. In this case, the flag pole is the same and represents the sharp rise in price with a relative higher volume, but the flag, this time, is a rectangular one, where the wicks that form its perimeter are taken into consideration.
As you can see, although it is the same event and despite the two different analyses, the overall picture is the same, which means that two different traders will see the same overall bull flag pattern and come to similar conclusions.
You can use this type of flag drawing in your analysis to find decent entry points for scalping. This means that you can place short orders or sell orders in the upper perimeter of the flag (the highs) and long orders or buy orders in the lower perimeter of the flag (the lows). Make sure you have appropriate stop-loss and take-profit orders set so that you don’t get burned by an eventual breakout point or miss the boat if it happens.
Do not mistake the Bull flag and a “Flat Top Breakout”
A somewhat similar chart pattern that could occur is the flat top, a pattern that could also lead to an upside breakout. The main difference between the bull flag pattern and the flat top pattern is strictly in terms of price consolidation. While the bull flag is expected to see price slowly consolidate while slightly declining in value, with lower highs and lower lows until the breakout point, the flat top, as the name suggests, will be made up of several candles touching a virtual top. Although also a bullish chart pattern, the flat top could mean that there is extreme selling pressure at the designated price point; while high volume would confirm such strong selling pressure, it would also confirm strong buying momentum, meaning that something as simple as a mild news catalyst could lead to a bullish breakout.
How to trade a bull flag chart pattern
Let’s use the same example as before, the Bitcoin (BTC) trading sessions from December 2020 to February 2021, but let’s consider the chart as an ongoing event. We’ll look at a perfect case scenario where a professional trader would trade based on the pattern since we now have a hindsight.
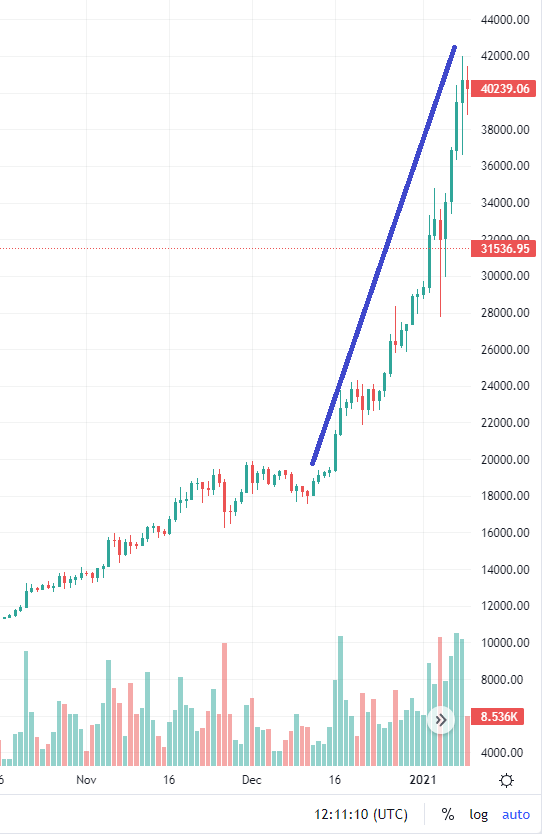
Step 1
Identify a sharp price increase, the flag pole, confirmed by strong volume. As the top resistance is confirmed, await the formation of a flag pattern.
Step 2
Notice the flag pattern confirming itself with a decreasing price consolidation and weaker volume. As you anticipate the breakout, place a buy order or a long position on the bottom trendline of the flag. The trader should also have a stop-loss set with a price slightly below the expected bottom of the flag. Set your stop-losses below the price consolidation area, keeping in mind the consolidation could be happening for a long time.
Step 3
As the bullish flag pattern and its breakout are confirmed by yet another sharp price increase, with a strong volume, either place or double down on a buying or long position to benefit as much as possible from the upcoming move upwards. Set stop losses on the next few candles at slightly below the breakout candle’s closing price.
Step 4
Profit! Make sure to remove or adjust your stop-losses accordingly.
The Advantages and Disadvantages of trusting the Bull flag pattern
While reliable most of the time, and widely used by traders and investors around the world, there are always uncertainties, as even the most bullish technical analysis pattern can be swept 6 feet under by major bad news. With that in mind, let us look at a few pros and cons of the Bullish flag pattern
Putting it to good use: How to make a trading strategy around the bull flag?
As should have been demonstrated by now, the bull flag chart pattern is very easy to identify and gives two very good entry points for different trading strategies.
Strategy 1 “Longs Along the flag”:
This strategy is all about placing long or buy orders along the lows of the flag, thus the name. After you identify the flagpole, confirmed by a strong trading volume, await for a descending price consolidation area. As you start to see the drawing of a flag or pennant, anticipate the probable future breakout and start buying or placing longs at the lows of the consolidation area. Remember the consolidation should have overall lower volume than the flagpole. Have a stop loss set at an area below the consolidation prices, depending on the time-frame.
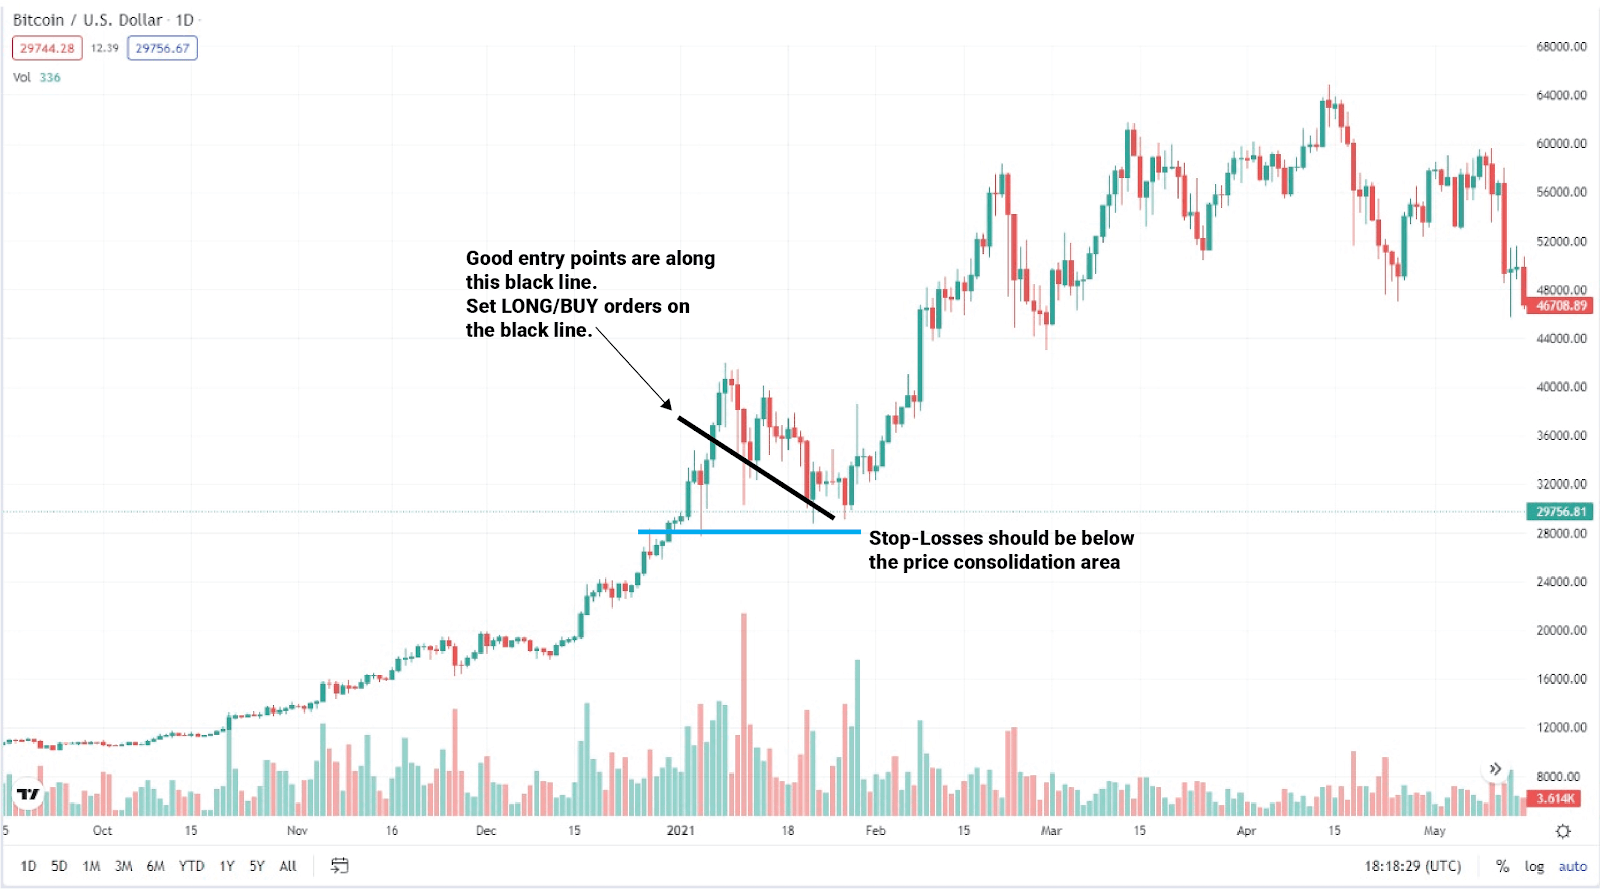
Good entry points are along the marked black trend line. Set your long or buy orders on the black line. Stop-losses should be below the price consolidation area. Keep in mind the volume should be dropping during the consolidation phase and peaking during the final breakout.
Strategy 2 “Fuel to The Fire”:
In this strategy you will be using the bull flag to confirm itself and buying its outcome, so in essence you are adding “fuel to the fire” of the trend. The outcome of the bull flag is a continuation of the previous trend. After you identify the flag breakout, confirmed by strong trading volume, set your buy/long orders as you are expecting a continuation of the trend that was happening before the bull flag pattern took place.
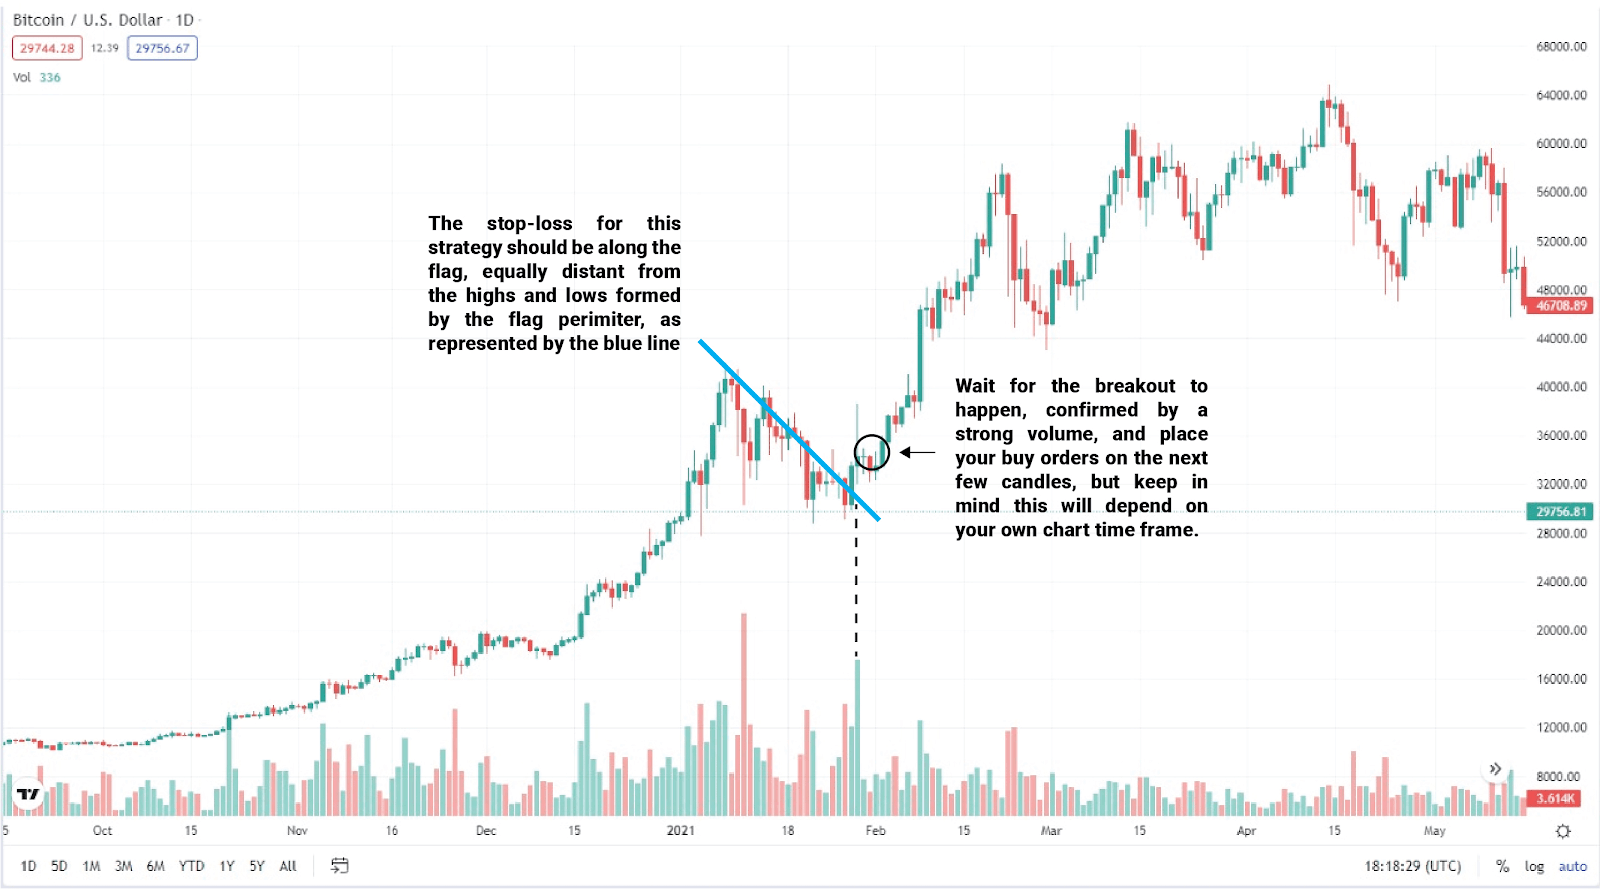
The stop-loss for this strategy should be along the flag, below the breakout candle, equally distant from the highs and lows formed by the flag perimeter, as represented by the blue line. Wait for the breakout to happen, confirmed by a strong volume, and place your buy orders on the next few candles, but keep in mind this will depend on your own chart time frame.
FAQ
What is the outcome of a bullflag?
The bullflag is a continuation chart pattern. The probable outcome thus is the continuation of the previous trend. You should use the bullflag to set positions to benefit from the said continuation.
What is the appearance of a bullflag?
The bullflag has its name because it resembles a flag (or a pennant) on a pole. The pole is represented by a sharp rise in price, and the flag or pennant are represented by a small area where the price slowly consolidates.
Is a bullflag a bullish or bearish sign?
This depends. A bullflag, once formed, is a bullish chart pattern, but it can be slightly bearish for a shorter time frame in the consolidation phase or area.
When should I buy a bullflag?
There are two moments where you should be buying once you identify a bull flag chart pattern. One is during the price consolidation phase, as you buy the lows of the consolidation area. The other is one to three candles after the final breakout of the bullflag pattern, as you expect to profit from the trend continuation.
Is scalping the bullflag a good idea?
Scalping a bull flag chart pattern can be very profitable, but it can also be a very bad move if you have bad timing. The perfect trader would, ideally, look to sell or short the flagpole and start rebuying or longing as the consolidation (flag design) comes up. Eventually, with the profits made, the perfect trader would amass a big position on the candle immediately following the breakout and profit from the continuation of the trend.
What are the differences between a bullish flag and a bearishflag?
The main differences between the bullish and bearishflags are the direction of the price trend. With a bullflag, you are looking to participate in a prevailinguptrend, and with a bear flag you are looking to participate in a prevailingdowntrend.


