A Pivot Point is analytical indicators traders use to calculate the possible resistance and support levels of price when trading securities. In layman’s terms, they are indicators of possible points of change in the direction of price on given charts. Traders use them when deciding which points to enter and exit the market, especially in day trading.
A Pivot Point is determined based on previous trading sessions’ highs, lows, and closing levels. This information is then used to predict future support and Resistance levels.
For example, traders calculate and highlight a Pivot Point from yesterday’s session; it becomes the base for today’s chart. They would then mark out a given number of Resistance levels and a corresponding number of support levels based on the Pivot Point. So, trading upwards of Pivot Point is considered bullish, while trading below it counts as a bearish turn in the market. This method of trading originated from floor traders on stock exchanges who used the previous day’s prices to predict the new day’s.
Support and Resistance in Trading
Before we move to explore the different kinds of Pivot Points and how to calculate them, let us discuss Resistance and Support first. Support and Resistance levels are the basis for every technical analysis in trading. Traders use them to properly judge when to enter or exit a position on the market.
Support
A support or support level simply refers to the lowest price an asset can drop to before rising again for a given period. A support level happens because traders continually enter positions on the market when an asset drops to that price range. It is not a permanent price as assets can test a support level and dip below it at any time. When this happens, a new support level is born. Traders usually follow a company’s trend to determine the lows it rarely breaches. This then informs the support levels at which they enter the market.
Resistance
A resistance level is the exact opposite of a support level. Where Support marks the level which an asset’s price rarely dips below, Resistance marks the highest point it seldom surpasses. Resistance happens when an asset on an upward climb meets too much selling pressure. It can be a permanent or temporary resistance, depending on market sentiments. If positive news comes to light, traders can become bullish toward the asset in question. This can cause it to break through its Resistance level.
Whereas support levels tell traders when to enter a position, Resistance levels signal them to get ready for exit. Finally, you can use Resistance levels to manage risks in trade by setting a stop loss order to follow it.
Different kinds of Pivot Points And How To calculate Them
There are several kinds of Pivot Points, each with its own calculation process. One common thing to them is that they all rely on the previous day’s high, low, and closing levels. When calculated using certain formulas, these values will indicate the pivot level, the Resistance levels, and the support levels of a price chart. Below are some of the popular Pivot Points and how to calculate each of them:
Standard Pivot Points
Just like its name implies, the standard Pivot Point is popular among traders, increasing its chances of self-fulfillment. It is the primary way traders calculate their Pivot Points. The first thing to figure out here is the base pivot level. This is gotten by a simple average of the previous day’s high, low, and closing levels:
- Base Pivot Point = (Previous day High+ Previous day Low+ Previous day close
Once you have gotten your base Pivot Point, you can use it to calculate your support levels and Resistance levels.
For the first support level, multiply your base Pivot Point by two, then deduct the previous day’s high from your answer:
- Support level 1 =( Base Pivot Point * 2) – Previous day’s high
Calculating the second support level is just as easy. This time, the last day’s low is subtracted from its high. After this, the answer gets deducted from the base Pivot Point. Observe:
- Support level 2 = Base Pivot – ( Previous High – previous Low)
Conversely, to calculate the first Resistance level, multiply the base Pivot Point by two, then subtract the last day’s low.
- Resistance level 1 = (Base Pivot * 2) – Previous Low.
The second Resistance level is calculated exactly like the second support level, with one exception. Instead of subtracting the first answer from the base point, you add it:
- Resistance level 2 = Base Pivot + (Previous High – Previous Low)
Fibonacci Pivot Points
This is another of the most popular Pivot Points traders use to determine their point of entry or exit from the market. Fibonacci retracement levels are based on Fibonacci sequences made popular by an Italian mathematician of the same name.
While a Fibonacci sequence is the sum of the previous two values in a series, the retracement levels deal with percentages. Fibonacci retracement levels are horizontal lines that show likely support and Resistance levels on the market.
The levels are percentages that account for how far a price has retraced a prior move.They are 23.6%, 38.2%, 61.8%, and 78.6%. However, traders majorly focus on the 38.2% and 61.8% retracement levels in their calculations. Below is how to calculate a price chart’s Pivot Points, resistance, and support levels.
The base pivot level in the Fibonacci method is the same as the standard calculation. It is the average of the last day’s highs, lows, and close.
Base Pivot Point = Previous Day’s Low + Previous Day’s High + Previous Days Close.
As for the first support level, all you have to do is to first subtract the previous day’s low from its high. Next, multiply the answer by .382 (the Fibonacci retracement level.) Finally, you subtract this from your base pivot level:
- Support 1 = Base Pivot Level – {.382 * (Previous High – Previous Low)}
The second support level is the same except for the Fibonacci retracement level in play. This time, instead of .382, use .618. Hence:
- Support 2 = Base Pivot Level – {.618 * (Previous High – previous Low)}
When it comes to the Resistance levels, the sequence remains the same for both resistance 1 and resistance 2. The only difference lies in the final step. Instead of subtracting your last answer from the base Pivot Point, add it like so:
- Resistance 1 = Base Pivot Level + {.382 * (Previous High – Previous Low)}
- Resistance 3 = Base Pivot Level + {.618 * (Previous High – previous Low)}
The third Resistance level in Fibonacci Pivot Points runs like the first and second. Only in this level, the value multiplied by the previous high minus the previous low is 1 instead of a retracement level. Here is what it looks like:
- Resistance 3 = Base Pivot Level + {1 * (Previous High – Previous Low)
Demark Pivot Points
Demark A Pivot Point is quite different from the first two described in this article. For one, it measures only one support and resistance point each. Another difference is in the calculation process. Demark pivot begins with a different kind of base, while the support and resistance points are conditional in relation to the prior highs and lows.
It is important to note, however, that everything in Demark Pivots is calculated using the value of X. hence, to calculate a Demark Pivot base, you must first find X with this formula:
- If your prior close is greater than its open, then you can find X by multiplying the product of 2 and the previous high by the sum of the prior low and its close:
X = (2 x Previous High ) + Previous Low + Close
- The second scenario will be if the former close equal its open. Under such circumstances, you find X by adding the sum of the previous high and its low. After that, you add the answer you get to the product of 2 and the prior close value:
So, X = Previous High + previous Low + (2 x Previous close)
- And finally, if the previous close is less than its open value, this is the formula to use. Add the sum of the prior high and low to the product of 2 and the prior close to get X.
In other words, X = Previous High + Previous Low + (2 x previous Close)
Once the X is figured out, the pivot base can be calculated by dividing X by 4:
Pivot Base = X/4
The first and only Resistance level becomes X divided by 2 minus the previous low:
Resistance Point = X/2 – Previous Low
To get the support, you do the same thing as the resistance except for the last part, where you substitute the previous low for the high instead:
Support = X/2 – Previous High.
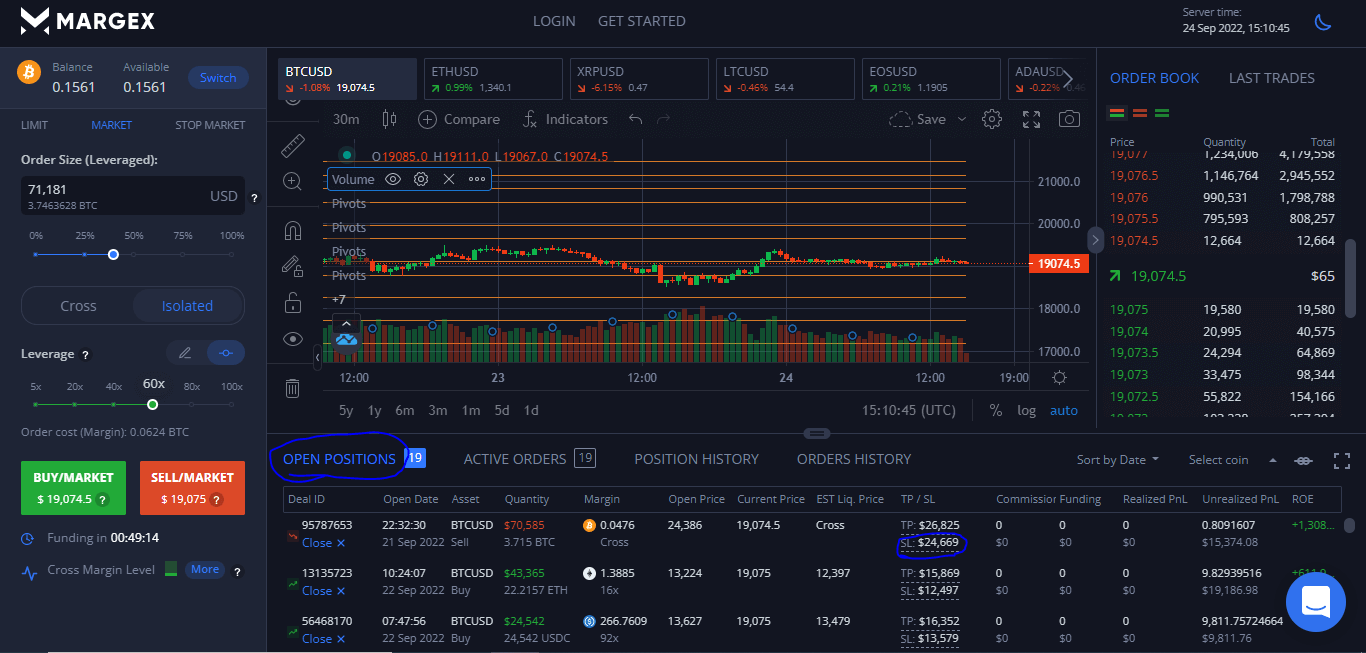
All these calculations above might scare you if you hated algebra in school, and even if you don’t, what of the time? This is where Margex crypto derivative platform comes in. This trading site has a calculator that automatically calculates your Pivot Points, Resistance, and Supports in the blink of an eye.
That lets you fully focus on trading without distractions or wasting time. Furthermore, Margex boasts the friendliest UI in the trading industry, giving you a quick and stress-free way to start trading. With a minimum deposit of as low as $10, you can get started trading with multiple assets, including BTC, ETH, SOL, etc. Margex’s interface also gives you a choice to view all aspects of an ongoing deal on screen at the same time. It is the perfect tool to use in trading Pivot levels.
Why do Traders Use Pivot Points?
There are various reasons why traders prefer to use Pivot Points while, especially for day trading. Here are a few of them:
- It has a high level of accuracy: Pivot Points are the most commonly used trading tool among traders. This makes it an accurate indicator for following market trends as most traders can be relied on to use it. Pivot Points use yesterday’s trading charts to predict the flow of today’s flow. As a result, traders trust it to help them predict when to enter and exit positions on the market. The indicator has a high level of accuracy because of this.
- The Pivot Point indicator is user-friendly: although the calculations explained above seem complicated, the Pivot Point indicator is quite easy to use. This is because trading platforms like Margex incorporate a calculator that automatically does the grunt work. Margex’s calculator will help you figure out the level of resistance and support so that you can focus on trading.
- Built to accommodate shorter time frames: This is perhaps the biggest reason why the Pivot Point indicator is the favored trading tool for day traders. As explained earlier, the indicator calculates daily probable resistance and support points based on data gathered from the previous day. Apart from calculating full-day charts, Pivot Points can cover the smallest time frames. There are 1-hour, 15- minute, and even shorter time frame charts on Pivot Point calculators.
Data for multiple trading levels: Different Pivot Points provide different sets of data, some up to 7. A Pivot Point chart can give you enough information to last you through a complete trading session.
Pivot Points – How To Use Them In Trading
In this article, we will discuss three ways you can use pivots points to trade:
- Bounce Pivot Trading
- Breakout pivot Trading
- Regular Range Trading
Bounce Pivot Trading
The first thing to understand when trading with a bounce Pivot Point is how Pivot Points work. This has been covered in the upper part of the article. To trade the bounce, note the following:
When an asset tests the upper part of a pivot base or pivot line then bounces upward, that is a buy signal.
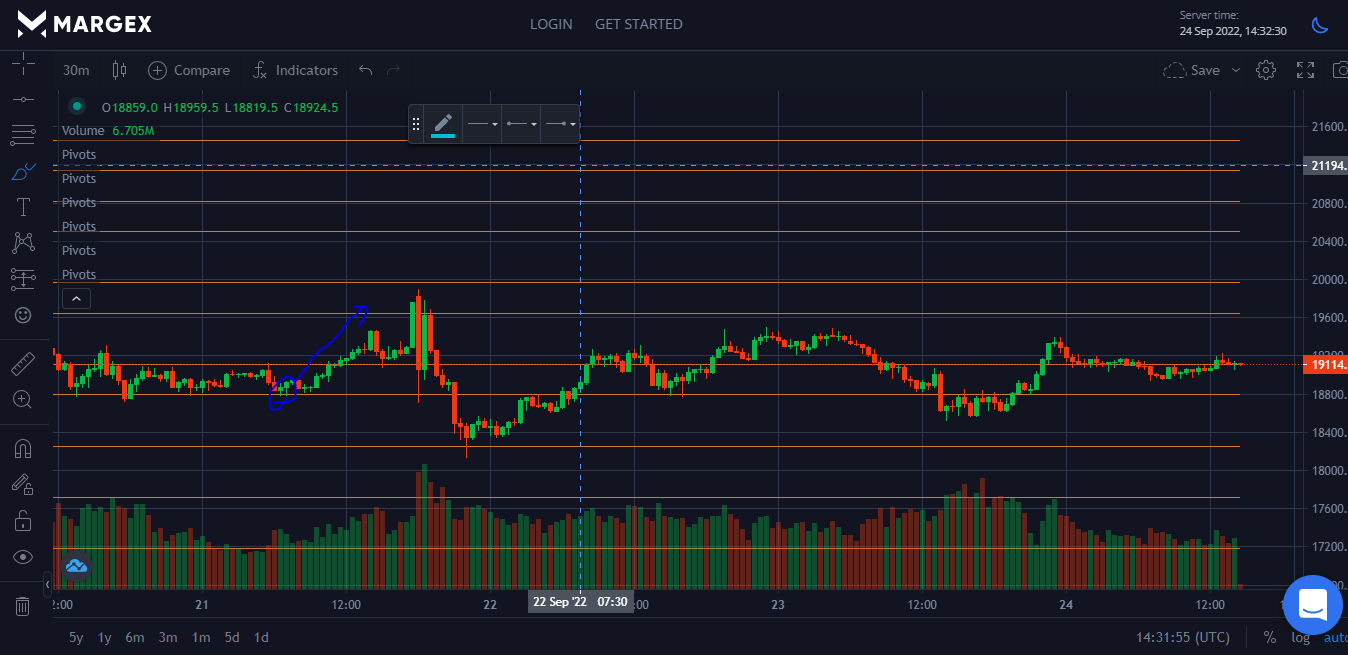
On the other hand, if your stock tests the pivot line from below and bounces downward, it is time to go short.

Your stop loss order must be above the pivot level when you are going short and below when you go long.
Finally, trading with the bounce pivot method should only be restricted to times when the price tests the next level.
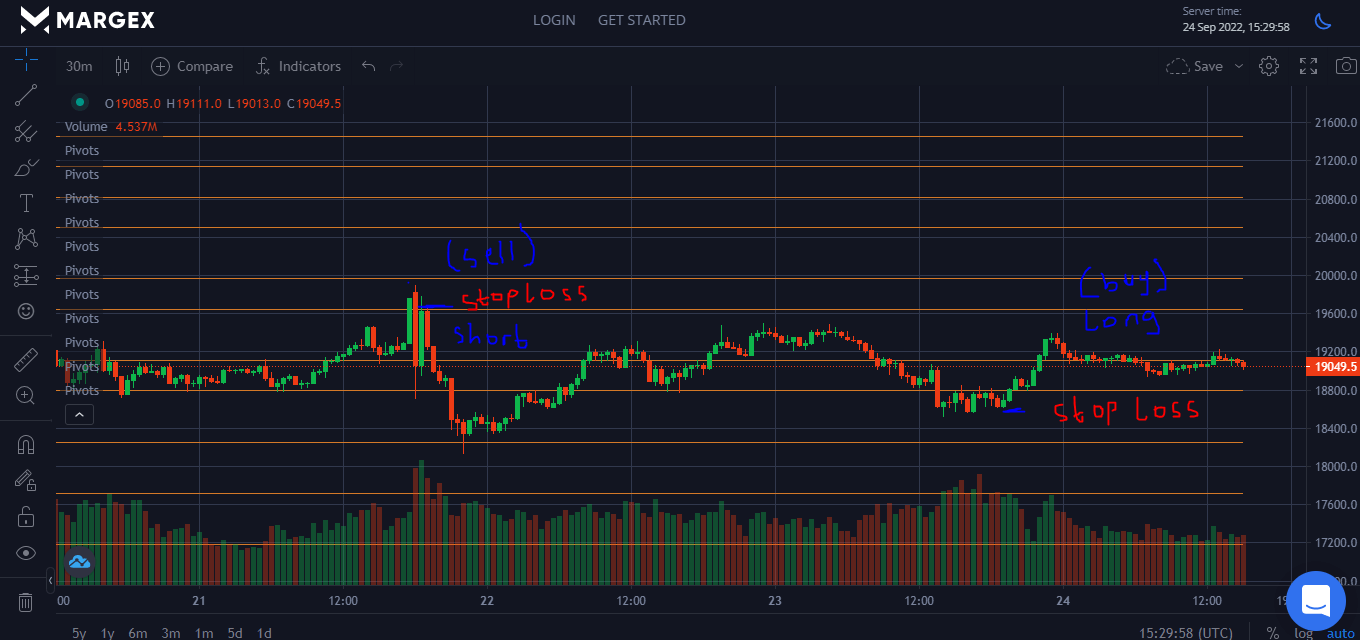
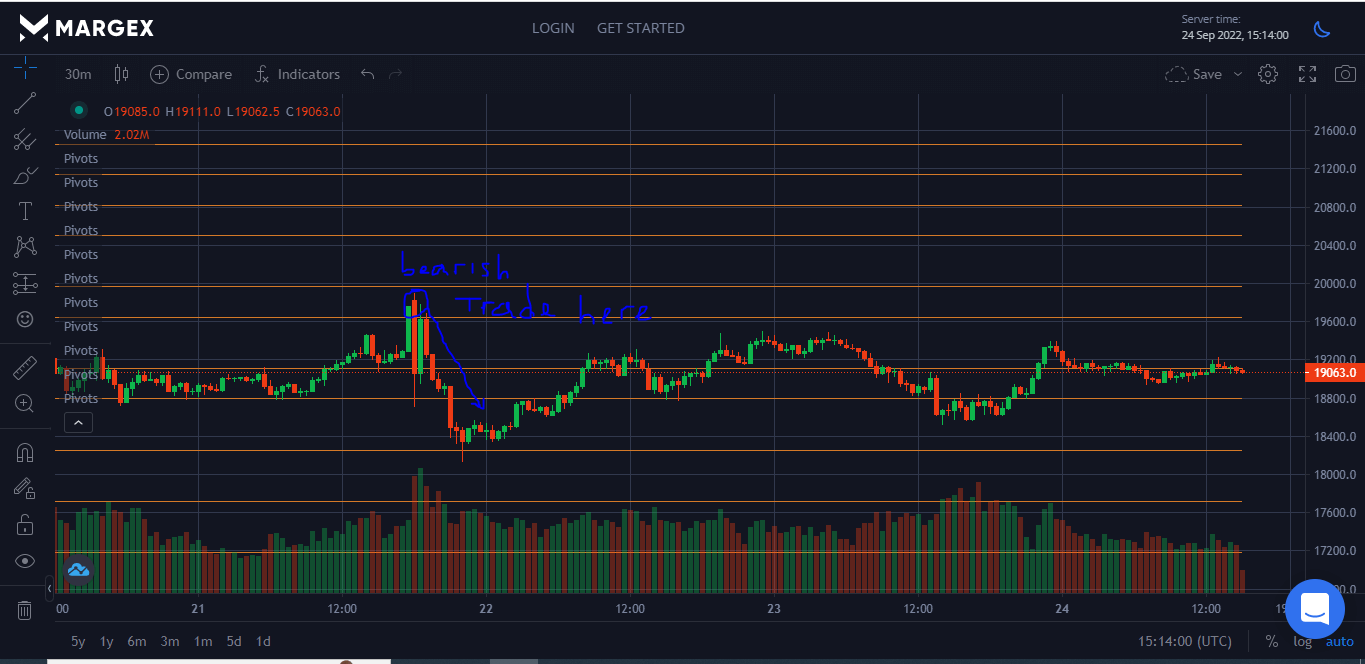
Breakout Pivot Trading
The basic definition of a breakout is a sudden movement of price from established support and Resistance levels. It could either be downward, which makes it bearish, or upward which is bullish. Breakouts mostly happen in the morning. Hence, that’s the best time to place a stop-limit order as your opening position. Here is how your trade should go:
- Open a position by placing a stop-limit order.
- Initiate a short trade on a bearish breakout
- Start a long trade if it is a bullish one
A stop loss on either a top or bottom that is just before your break-out point is your best friend, use it.
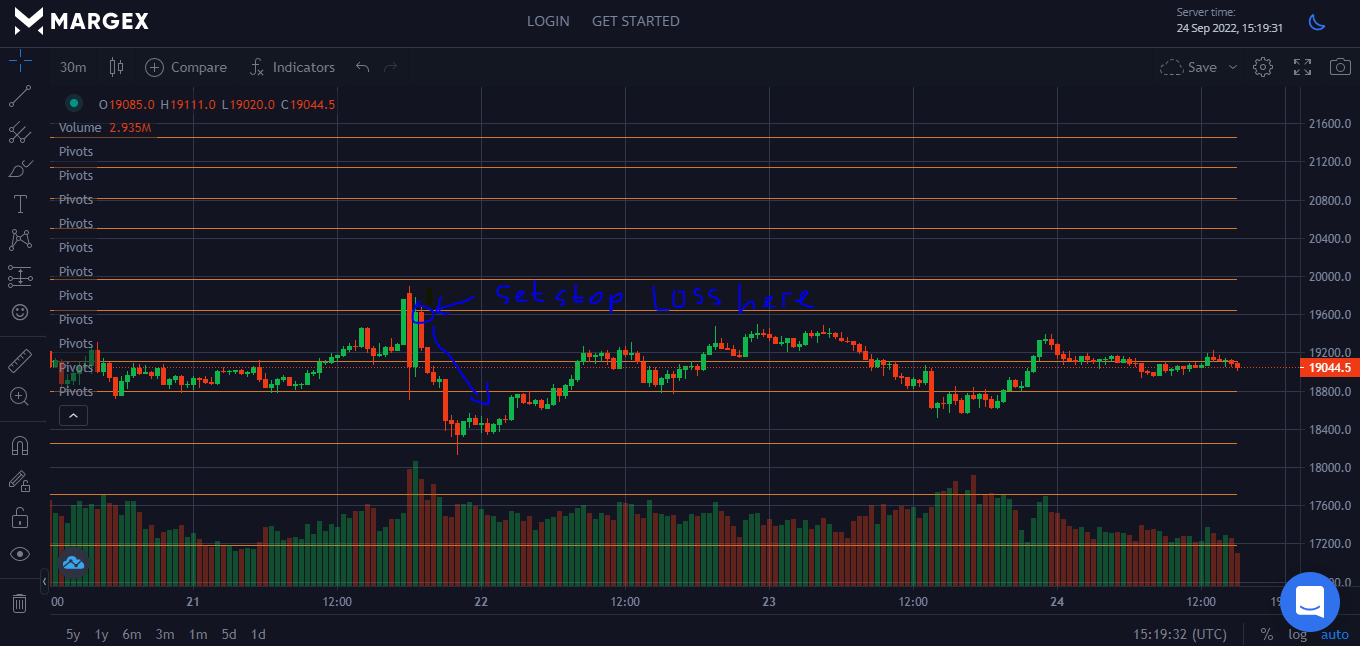
- Stop losses are for protecting your trade from sudden unfavorable price moves.
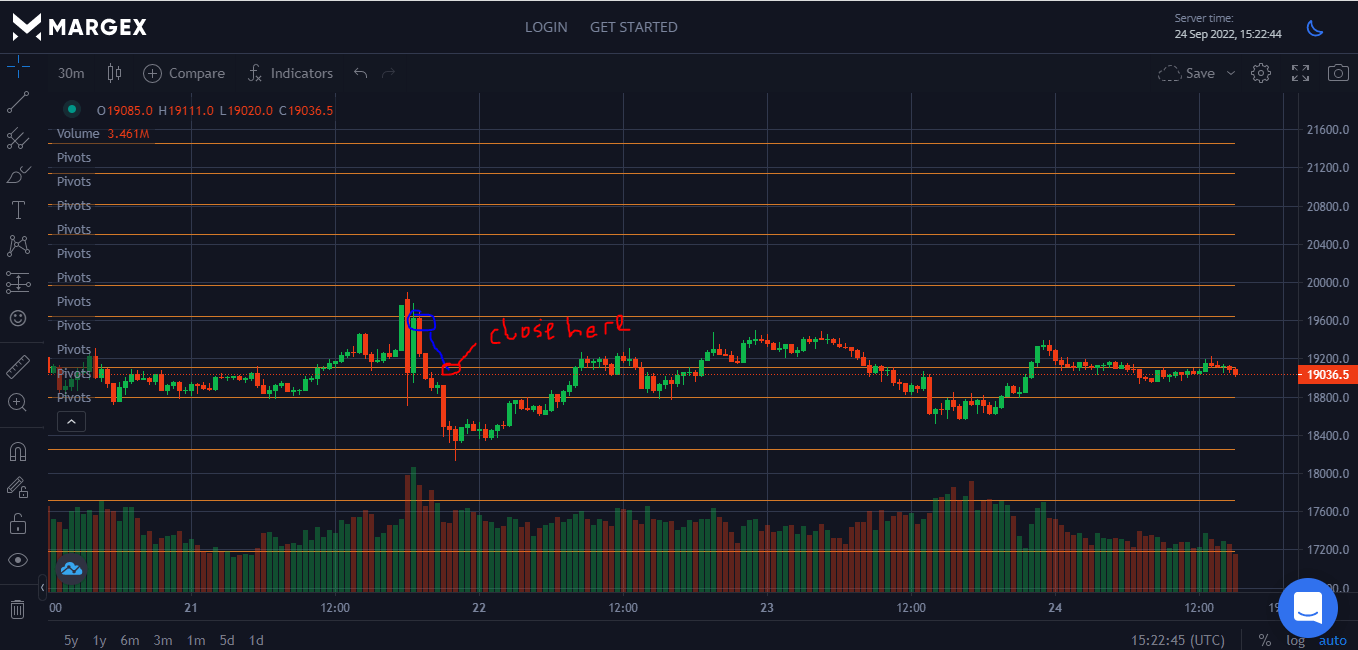
- Finally, your breakout trade should at least get to the next pivot level before you consider closing it.
Regular Range Trading With Pivot Points
This is the simplest way to trade with pivot levels since prices will always test the levels continuously. So what you do is use them as you would trade with normal resistance and support. The basic thing to note is that the more times a price pivots away from a particular resistance or support, the stronger that level becomes. This is because traders depend more on such levels, making them a self-fulfilling trade.
- First, put a stop just below or above the resistance or support, as the case may be.
- If it’s a support, it is best to buy as the price nears it
- And if you wish to trade a resistance, then sell just before the price gets there.
Common Mistakes in Trading With Pivot Points
- Depending solely on Pivot Points indicators to make trading decisions: this is the most obvious mistake of all. Although, Pivot Point is a useful trading tool to have in your arsenal, it must not be the only one. This is because the indicator merely tracks the previous day’s trade, and every day is going to be different. A good trader always has a trading strategy that involves more than using Pivot Points.
- Putting a stop loss directly on the support or Resistance level: Support and Resistance are only indicators of previous trading trends. The best way to use them is to place your stop just above or beneath them, as the case may be. In trading, anything can happen at a moment’s notice. So, if a breakout occurs, you want your stop to allow you to take advantage of it either way. Hence, it should be slightly below or above the Support and Resistance, respectively.
- Greed: This has been the bane of many traders’ lives. A Pivot Point is popular for a reason because they are often self-fulfilling. Trading past them has proved disastrous for those who do not exit at Pivot Point
- Shorting assets that exceed the fourth Resistance level: Trading stocks that have managed to beat this level is most times a win situation. If things go wrong, you will most likely at least have a fighting chance or break even.
FAQs
What is a Pivot Point?
A Pivot Point is a level at which the price of an asset can change direction in its upward or downward movement. It is perhaps the most popular tool that traders use to figure out possible Support and Resistance levels.
How do I find a Pivot Point?
You can find Pivot Points using the previous day’s highs, lows, and closing prices. These are then calculated using certain formulas by a calculator on your trading platform.
Are Pivot Points effective?
To a large extent, they are. In fact, traders favor Pivot Points for their high level of accuracy. Furthermore, because of the large number of people who use the indicator, it has become self-fulfilling in a way.
How do you create a Pivot Point in trading?
A Pivot Point is created when prices of the last day are calculated using formulas like the Demark Pivot, Fibonacci Pivot, or Standard Pivot Points.
Do professional traders use Pivot Points?
Yes, they do. A Pivot Point is highly accurate, contains a rich stock of data, and is tailored to day traders. Although they don’t use Pivot Points exclusively, it is definitely one of the tools professional traders incorporate.