
Trading crypto in the bear market has proven to be one of the most difficult times for most traders, investors, and institutions, as there is usually low volatility to go long or hodl assets during this period. Still, as the saying goes, the bear market is an opportunity to grow and become a better trader ahead of the bull market, where trading seems very easy. Trading without the proper understanding of what the market requires of you and acknowledging what to expect from the market is akin to exposing yourself to risk, which could cost you your life, but in this case, your trading portfolio.
Trading entails more than simply placing buy or sell orders based on a gut feeling that now is the best time to buy or sell an asset. Professional traders, investors, and institutions go as far as having a clear cutting edge with the help of technical analysis tools such as market structures, price actions, technical indicators, oscillators, and chart patterns (Bullish chart patterns and Bearish chart patterns) to best position themselves for good profitability and forecasting when and where the market will make its next move.
At the end of this guide, your knowledge of what is a triple bottom pattern, how to use a triple bottom chart, and how to identify triple bottom bullish pattern with examples will help you become a better trader and add this tool to your arsenal of technical analysis strategies for optimum profit.
What Is a Triple Bottom Pattern?
A triple bottom pattern is a bullish reversal chart pattern used by crypto traders to spot potential price reversals from a bearish trend to a bullish trend, with the appearance of this chart pattern at the end of a downtrend. This chart pattern is formed at the end of a downtrend signaling a potential price reversal to an uptrend; it is composed of three bottoms with a neckline resistance. A breakout and close above this neckline resistance signal a trend reversal from a bearish trend to a bullish trend, and it is said this pattern is complete.
The structure of the triple bottom pattern is made up of three successive failed attempts to break out of a downtrend while forming a support to break lower from this structure. A breakout from the upper neckline resistance indicates triple bottom chart pattern formation and a confirmed breakout with a trader looking to take a long position as a shift in trend has occurred from a bearish to a bullish trend reversal.
This pattern generally occurs in technical analysis of the financial market. It has almost the same pattern as other bullish reversal patterns, like the inverted head and shoulders and double bottom patterns. They all work the same way as the triple bottom pattern and move in the direction of trend reversals from a bearish trend reversal to a bullish trend reversal.
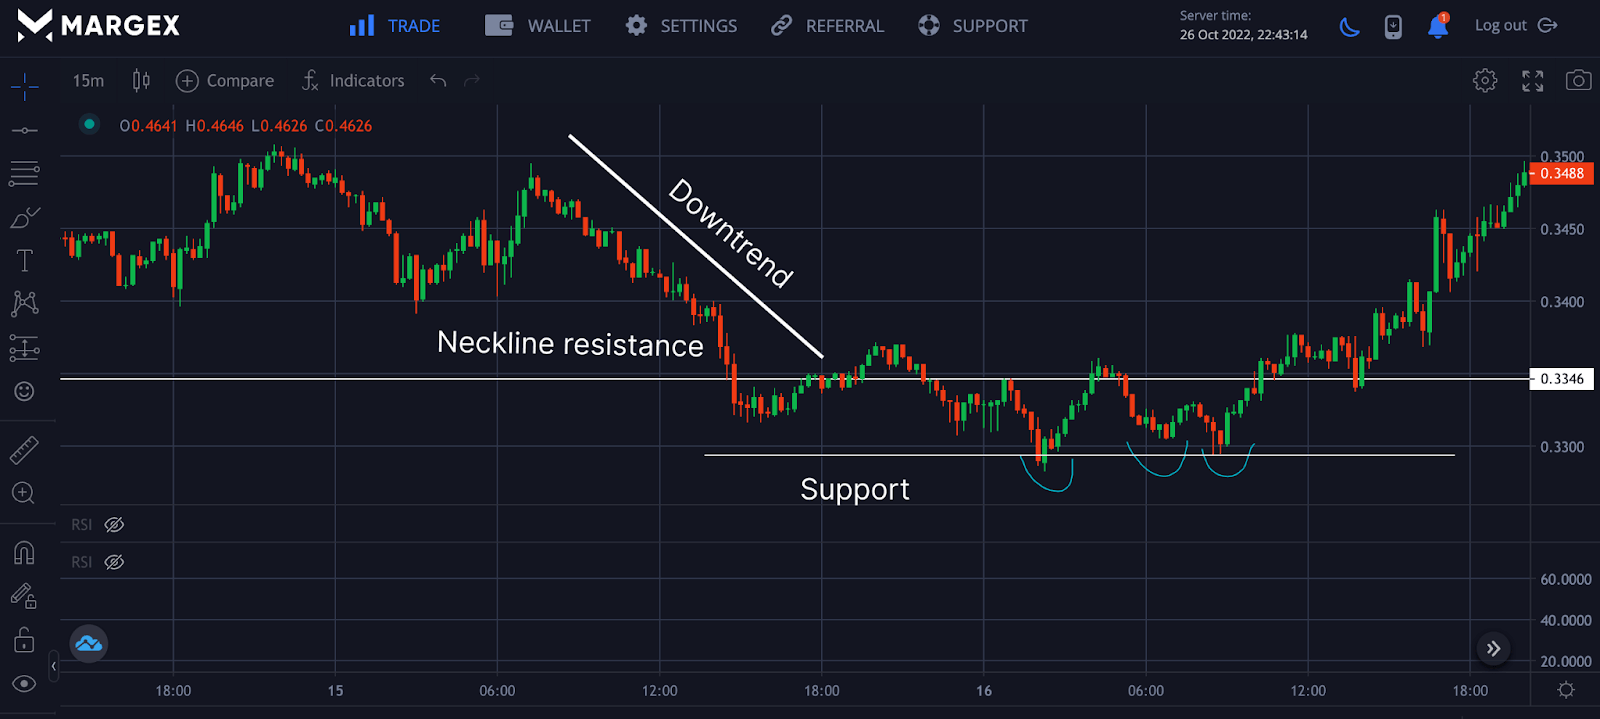
Spotting the triple bottom chart pattern is difficult, making it a powerful tool for technical analysts to find reversal from a downtrend price movement. The chart pattern forms a letter “W” as price ranges in a rectangle channel with a lower support level and upper neckline resistance with a potential breakout signaling pattern completion.
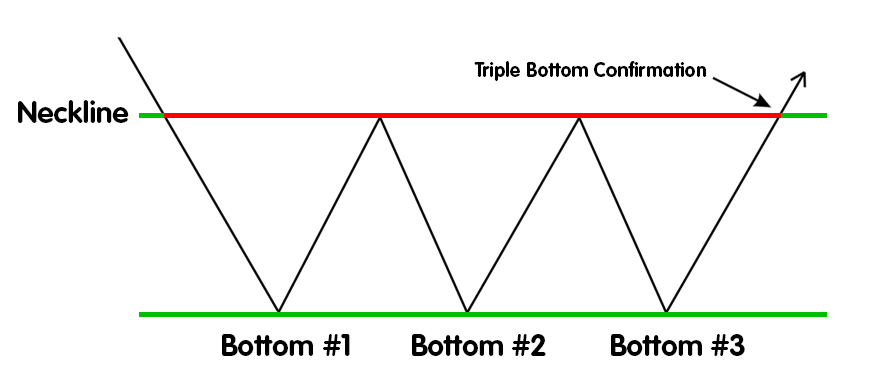
The Image above shows the price after its downtrend formed a range in a rectangular box forming three consecutive bottoms. The Support prevents the price from dropping, with a potential breakout from its neckline resistance.
What Does The Triple Bottom Mean
The triple bottom pattern is a bullish trend reversal pattern that means, when identified on the chart, there could be a potential price reversal; a trader can anticipate a bullish price reversal from a downtrend price movement with a potential breakout above the neckline resistance confirming the pattern.
This is useful for technical analysis traders, and long-term hodlers as this is an opportunity to open a long position or add to an existing long position for high returns on capital.
A triple bottom pattern can be used as an exit strategy for traders with an open short position who could look to exit the market on confirmation of the pattern to avoid losing funds and cutting down risk. When this pattern is identified, it can be highly reliable.
The Difference Between Triple Bottom And Triple Top Pattern
Although these two patterns mirror each other, the triple top pattern is just the opposite chart pattern for the triple bottom pattern. The triple top is a bearish trend reversal pattern traders use to spot potential tops in a bullish trend. The appearance of the triple top pattern indicates a potential price reversal from a bullish trend to a bearish trend, with the trader looking to open a short position on a breakout of the neckline support.
How To Trade A Triple Bottom (Add Screens From Margex)
Margex is a Bitcoin-based derivatives platform that allows users to open leverage positions with up to 100X leverage size. Users can also access Margex’s unique staking features that allow traders to stake their tradable assets on Margex to earn on both sides with up to 13% APY on stake tokens.
All staking rewards are sent to the staking balance on a daily basis with the help of the Margex automated system, as there are no lockup periods for assets. Margex allows users to access all technical analysis trading tools free of charge with a great user experience and interface to make your trading a worthwhile effort.
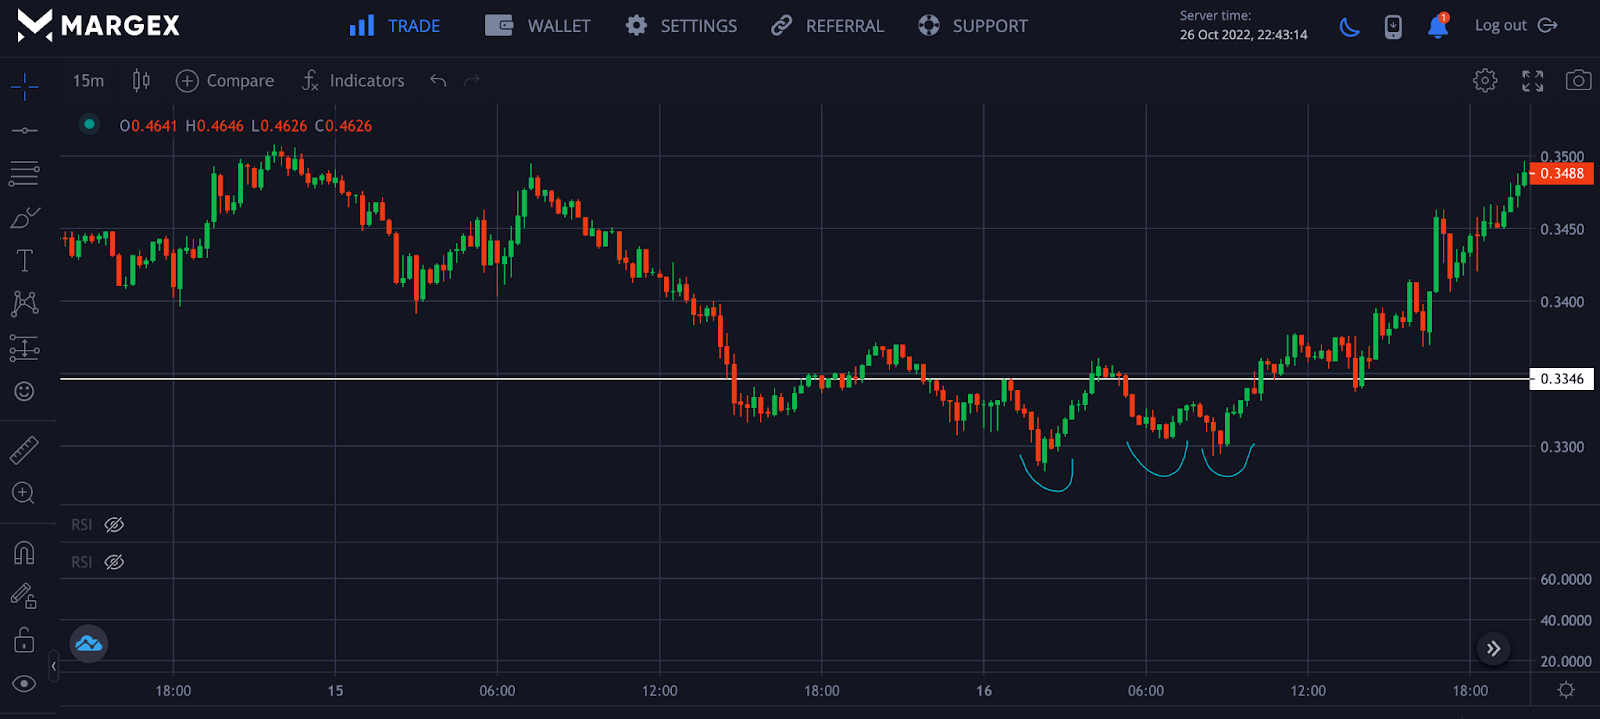
The Image above shows XRPUSD forming a triple bottom pattern after its bearish price movement with a potential break of the neckline resistance as the price of Ripple (XRP) continued its price rally to the upside. On spotting this pattern, a trader would wait for a clear confirmation to open a position. Although this strategy is highly successful but should not be traded alone as this could mean price distribution before a further downtrend in price. It is best to confirm with other strategies like the Relative Strength Index (RSI), Moving Averages, and Fibonacci retracement ratios for better confirmation and reduced risk.
An Example Of A Triple Bottom (Screens From Margex)
The triple bottom pattern, as discussed, is a trend reversal indicator; a trader uses it to spot the potential end to a downtrend and price reversal from a bearish to a bullish trend reversal. Combined with other technical tools, it can be very effective for long positions.
Now that we have discussed the triple bottom pattern let us see how you can apply these strategies using other technical tools like the Exponential Moving Average and the Fibonacci Retracement Ratio.
Triple Bottom Pattern With Exponential Moving Average
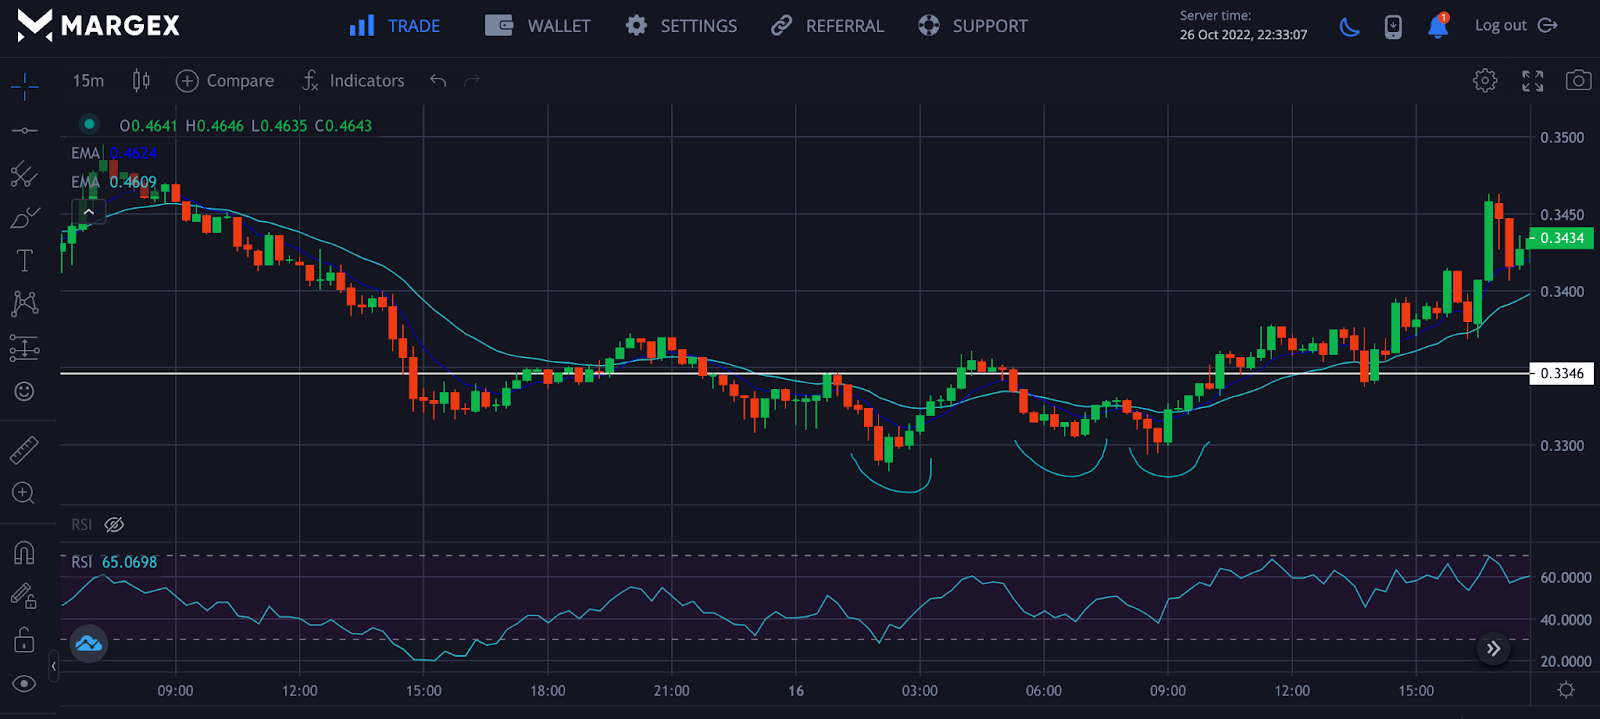
From the Image above, XRPUSD formed a triple bottom pattern after a downtrend or bearish market with a potential price reversal after the formation of the pattern. A breakout of the neckline resistance indicates the price is going in the direction of an upward movement. This movement was confirmed as the price closed above the double cross 8 and 21-day Exponential Moving Average (EMA), with the price resuming a bullish uptrend.
A trader who uses these two strategies would open a long position for the price of XRPUSD.
Triple Bottom With Fibonacci Retracement Values
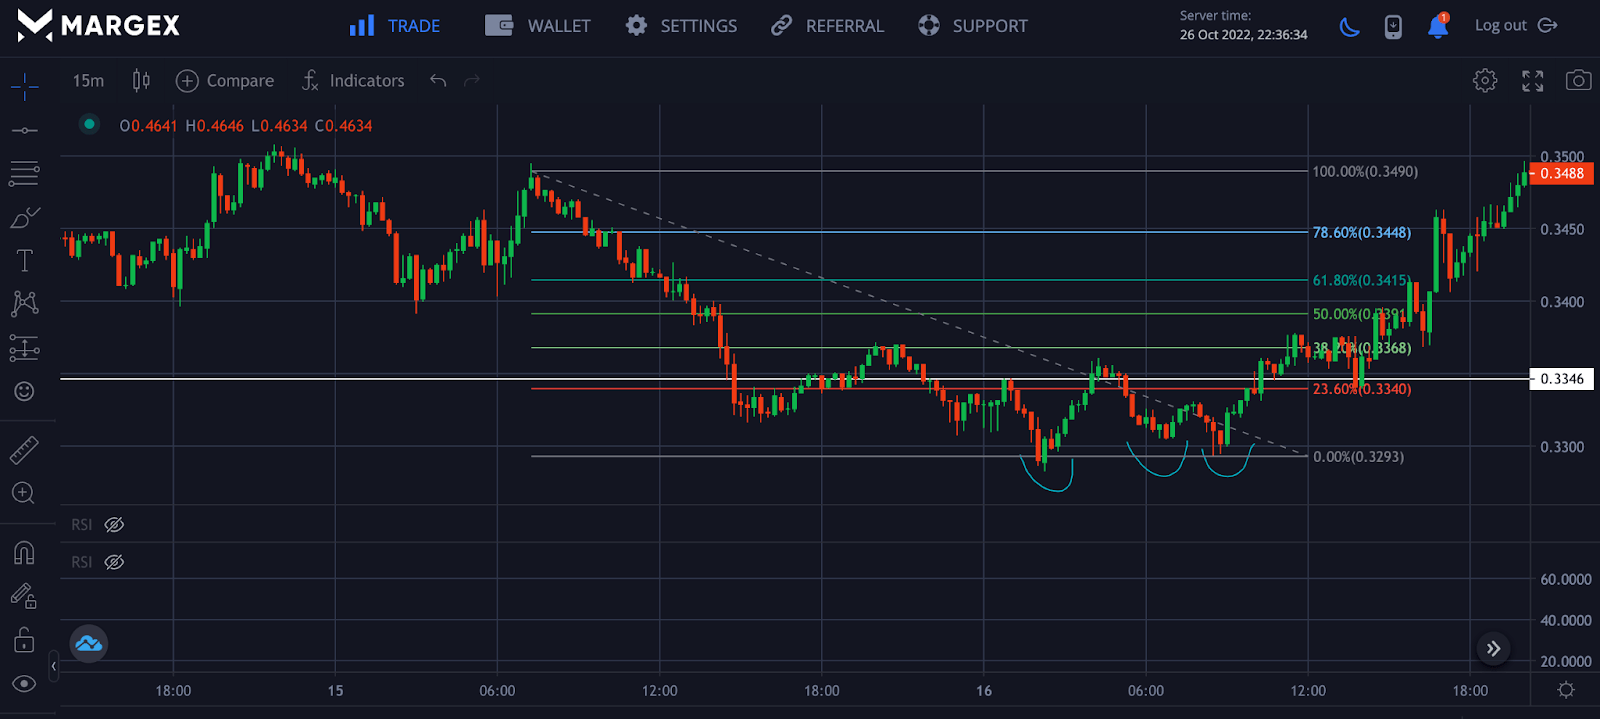
Fibonacci retracement levels are part of the likable technical tools among traders as they show key Support and resistance levels. From the Image above, after a successful breakout from its triple bottom above the neckline resistance, a break and close above 38.2% is a signal as the price would rally to the upside.
Limitations Of A Triple Bottom
A triple bottom pattern, when identified and confirmed, can be reliable. Still, it is only sometimes accurate as this pattern can be exploited in the case of a news flash or extreme price volatility.
The biggest challenge with this pattern is the inability to wait for the pattern to be complete and confirm that it has broken out of the neckline resistance before it can be tradable. Most beginner and advanced traders deal with lots of impatience, which leads to premature entering of trade, leading to failed trade and loss of money.
Usually, a breakout from the neckline with good volume is a sign that the trend will last, but if there is little or no volume accompanying this breakout, then this pattern is bound to collapse. Always trade this strategy with other well-known technical tools to enable better profitability.
Spotting The Triple Bottom Pattern
Due to how less popular the triple bottom chart pattern is, it is quite easy to spot. Look for a downtrend with a series of lower lows and lower highs and three consecutive failed attempts to break higher.
Outline the bottom acting as Support and the neckline resistance for easy identification, then wait for the price to breakout of this range in a long entry position.
Frequently Asked Questions On Triple Bottom Pattern Formation
Here are the frequently asked questions about the triple bottom pattern and how to trade this strategy.
Is A Triple Bottom Bullish Or Bearish?
A triple-bottom pattern is a bullish signal of a price reversal to the upside and appears after an asset has experienced downward momentum and downtrends.
The triple bottom pattern formation is closely watched and utilized by traders looking to take advantage of its formation for long positions and entries.
However, the triple bottom is more effective when used alongside various technical bullish reversal indicators to validate its signals on an asset price chart.
Traders are advised to conduct personal research and due diligence on bullish reversal chart patterns and gain ample knowledge of technical analysis.
Is A Triple Top Pattern A Good Sign?
Determining if the triple top pattern is a good sign for traders depends on factors such as trade positioning in the financial and cryptocurrency markets.
The triple top pattern is a bearish reversal price signal that forms in an uptrend or at peaks of bullish cycles in the cryptocurrency markets.
For traders in opened short positions, a triple top pattern formation may be a good sign as it signals bearish reversals and opportunities to profit from open short positions and trades.
On the other hand, traders who are in long position trades may see a triple top pattern formation as a bad signal and warning of a potential bearish price reversal.
What Happens After A Triple Bottom?
In cases of triple bottom pattern formations on a price chart, a bullish price reversal is likely to occur as its formation signifies multiple retests at key levels on a downtrend.
Triple bottom pattern formations may be an area of interest for many traders and investors looking to open long positions and buy digital assets at those levels.
Traders may need to be wary and take caution trading at those levels as prices can be very volatile at levels where a triple bottom pattern is formed. Good application and knowledge of sound technical analysis can help traders to trade proficiently and administer safeguards trading the triple bottom patterns.
How Reliable And Accurate Is A Triple Bottom Pattern?
The reliability and accuracy of utilizing a triple bottom pattern formation may depend on how it is interpreted and used alongside various technical indicators.
The triple bottom pattern may indicate a bullish reversal but may be as accurate if its signals align with other technical indicators pointing to the same bullish outcomes.
Traders may leverage their trading strategies with other technical indicators when trading signals resulting from triple bottom pattern formations.
The triple bottom pattern formation can be a helpful tool for traders if utilized adequately and skillfully.
How Do You Spot And Identify A Triple Bottom Pattern?
A triple bottom is typically considered three about equal lows that bounce off support levels and then rise to breakthrough resistance levels.
In spotting a triple bottom pattern formation, traders may need to identify a downtrend or bearish cycle on price charts of the financial and cryptocurrency markets.
Downward momentums and downtrends characterized by a string of lower lows and lower highs are the first things a trader should look to spot.
Next, while looking and analyzing the price chart, traders may look through and pinpoint areas of double retests at support levels and wait patiently to see price retesting a third time at the same support levels.
What Is The Win Ratio Of Utilizing The Triple Bottom?
A trader’s successful outcomes and the ratio of trade wins when utilizing a triple-bottom pattern may vary from trader to trader and depend on its application.
A trader who leverages other technical indicators in validating the bullish signals stemming from a triple bottom pattern may have a positive win ratio compared to standalone applications.
Traders who apply proper risk management strategies in trading triple bottoms may profit if bullish signals go to plan and cut losses if triple bottom signals turn sour.
In summary, a trader may develop a trading strategy and conduct personal research on applying various technical indicators to triple-bottom patterns.


