
The most successful and profitable technical analysts review the price action of various assets in search of identifiable chart patterns, Japanese candlestick formations, or signals generated by technical indicators.
The evening star pattern is a bearish, three-candle Japanese candlestick pattern that appears at the top of an uptrend and is a sign that a rally is potentially about to reverse. A key factor in the evening star pattern is the small-bodied candle that occurs at the swing high, showing indecision in the market.
The following in-depth guide will teach you all about the evening star pattern, including how to identify the pattern, how to trade the pattern, how it compares to other patterns, and much more.
All About The Bearish Evening Star Chart Pattern
The evening star pattern is a bearish candlestick pattern that appears at the end of an uptrend, potentially presenting a new short-sell position opportunity.
The evening star pattern presents a well-defined entry point and a high risk-to-reward setup. It also creates a clear exit level for stop-loss placement in case of a false signal and failed reversal.
What Does An Evening Star Pattern Tell The Market? Understanding Indecisiveness
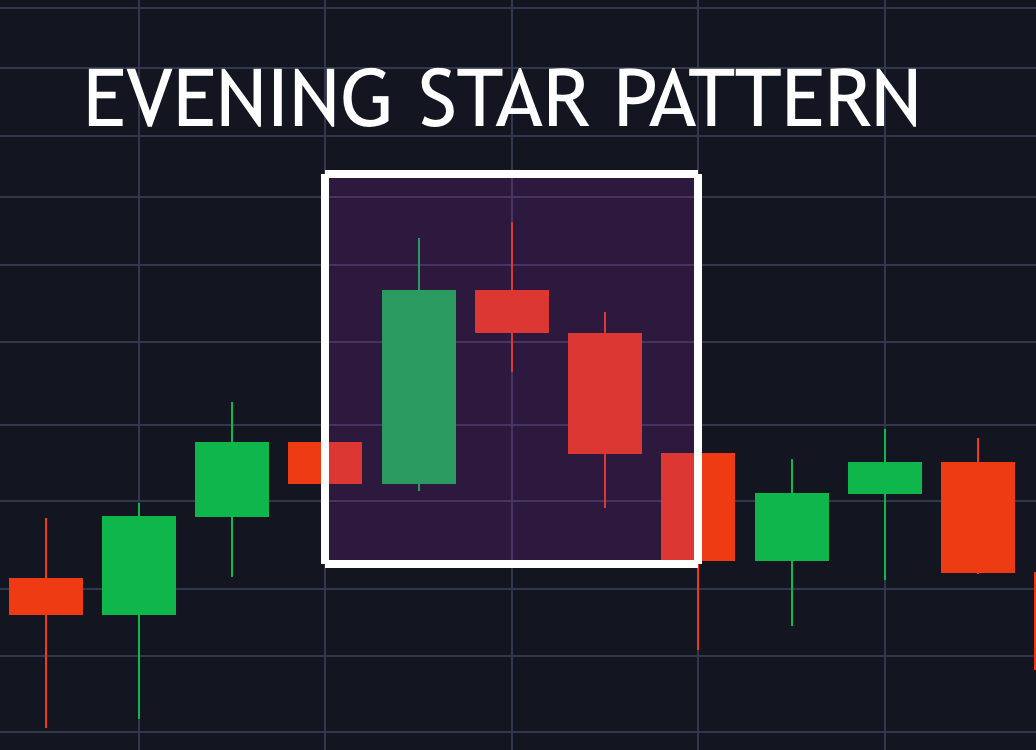
It tells a trader that although the market moved higher, the market is too indecisive. The first candle of
An evening star pattern is a large bullish candle. After buying pressure pauses due to indecision, an evening star doji candle forms at the resistance level. Selling pressure then kicks in and causes an almost equally large bearish candle nearly erased the entire rally.
The evening star pattern is a reversal pattern that can signal the start of a new downtrend. Indecision can occur at a former level of resistance, due to negative breaking news, changes in regulation, or simply due to a trend being overextended.
How To Identify An Evening Star Pattern Using Margex Crypto Price Charts
Unlike more complicated trading patterns, the evening star pattern has several tell-tale signs that the pattern is valid. The pattern is a three-candle pattern that develops sideways across a price chart, but at the top of an uptrend and at the beginning of a new downtrend.
The pattern is confirmed when at least 50% of the first candle is engulfed by the third candle, and its strength as a reversal signal grows the more the red candle engulfs the green candle.
Evening Star Pattern Candlestick Guidelines: How To Spot The Bearish Reversal Pattern Setup
Here is a foolproof explanation of the evening star pattern and its guidelines.
The first candle of an evening star pattern begins with a powerful advance in the market, creating a large green candle (or an open, white candlestick, depending on the settings).
The second candle is the evening star doji candle, signaling indecision in the market. The doji can be green or red (or white or black) and is usually the high of the pattern.
The third candle of the evening star erases the previous candles with a large red candle (or a closed, black candlestick, depending on the settings), often gapping down from the doji due to the strength of the counter move.
Evening Star Reversal Pattern Crypto Market Example
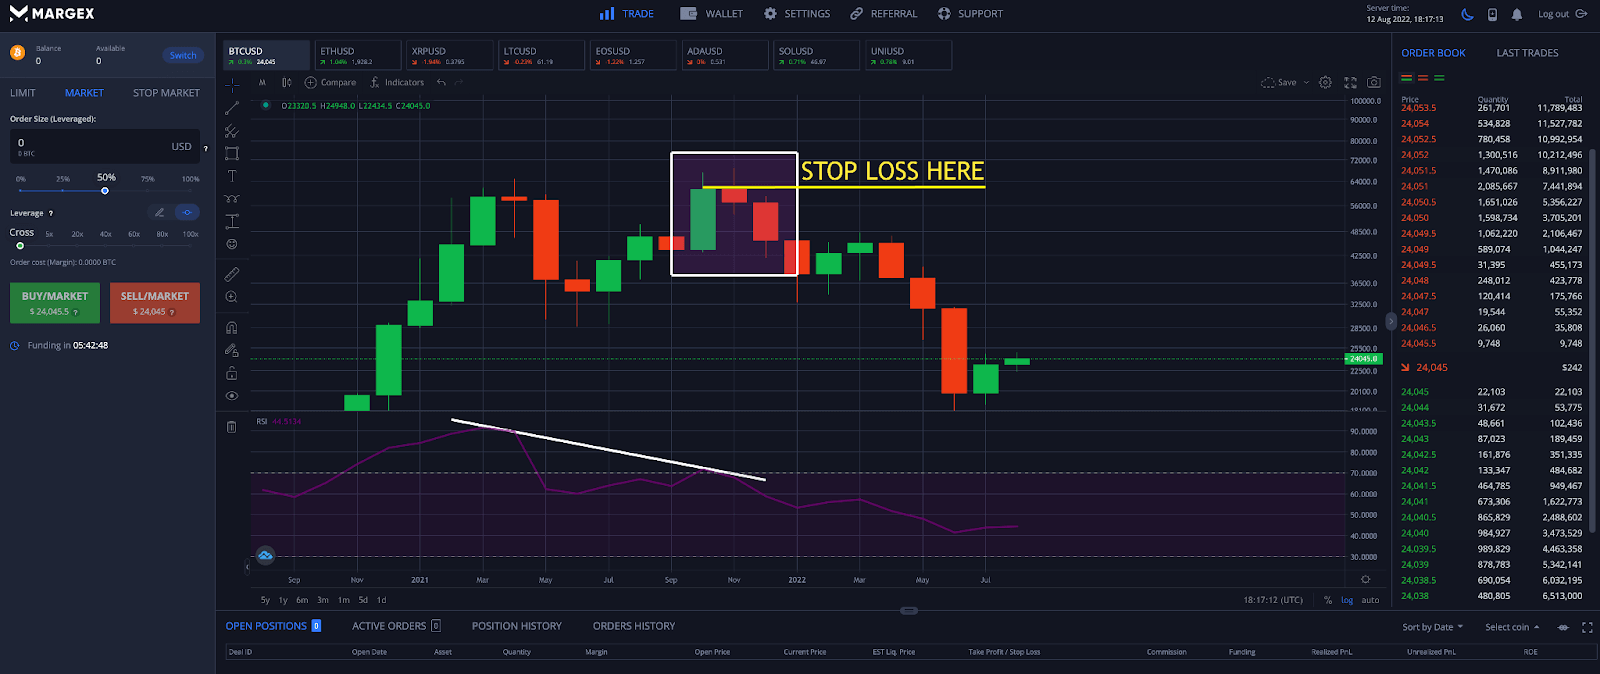
Although the evening star pattern appears in stock price charts, forex charts, commodities, futures, and more, for the purpose of this example we are focusing solely on cryptocurrencies and are using Bitcoin to showcase a recent evening star pattern.
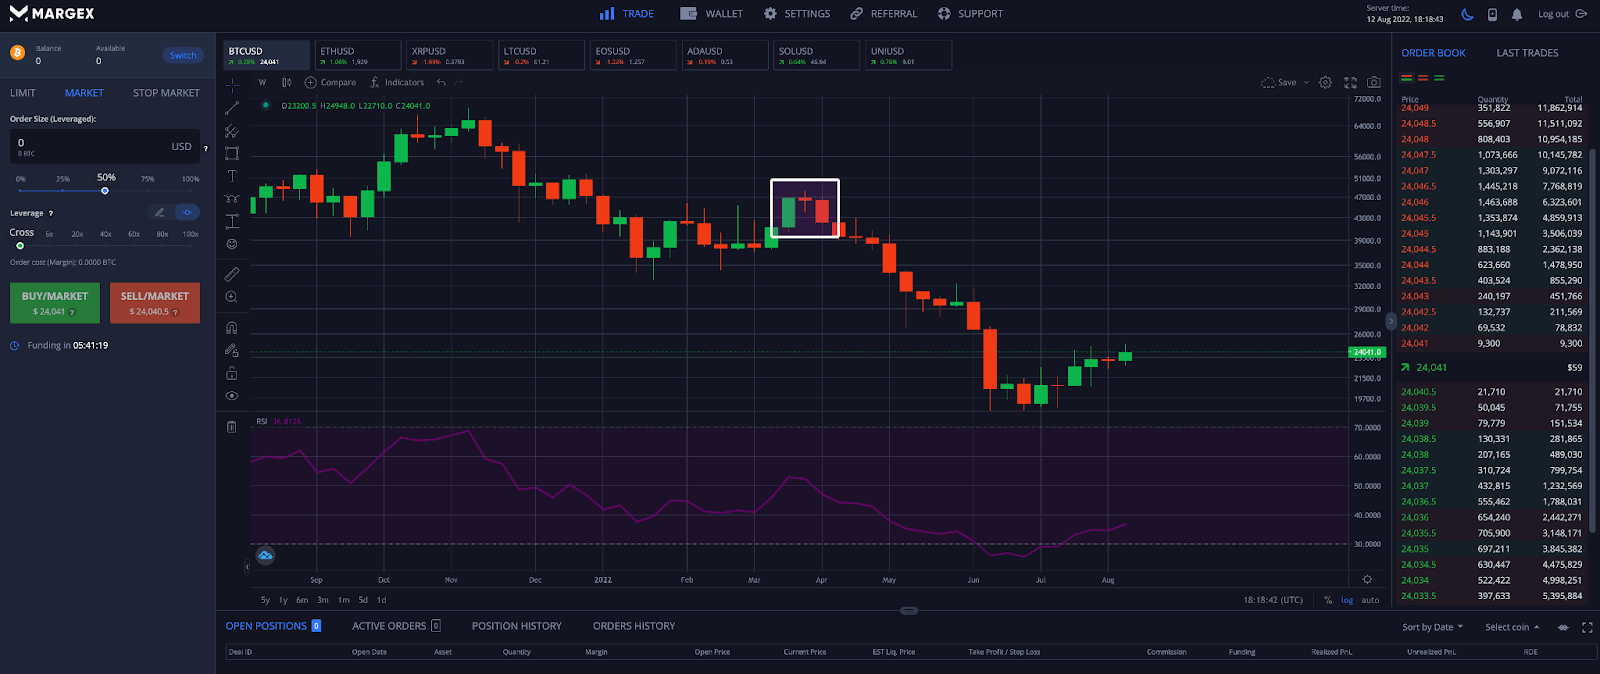
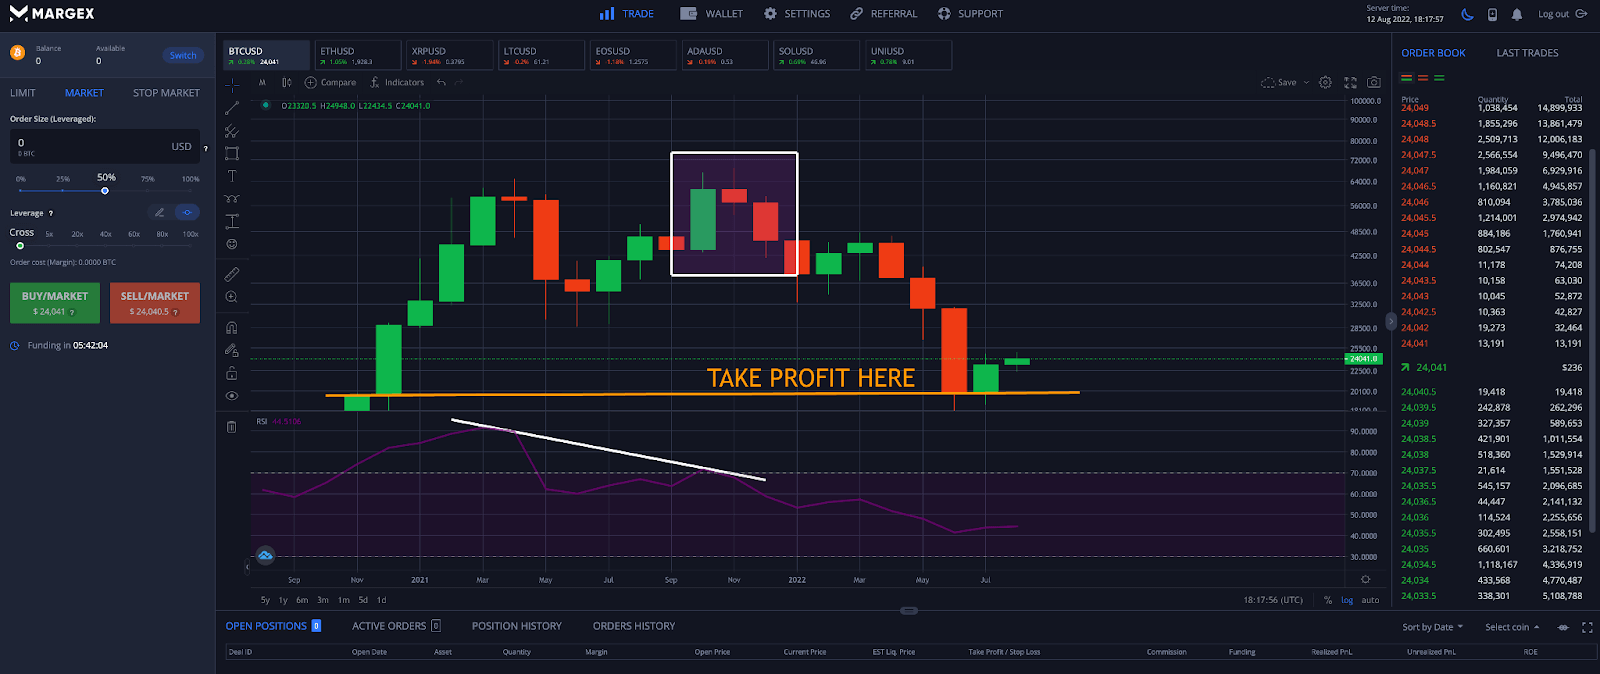
In the above example, Bitcoin failed to bring a return of FOMO to the market, leading to a large crash beginning with the next candle following the evening star pattern.
The takeaway here is that a well-placed short trade would have been extremely profitable for a crypto trader.
Evening Star Trading Explained: How To Trade The Evening Star Candlestick Pattern With The Margex Trading Platform
The Margex margin trading platform offers a wide range of built-in technical analysis tools that a crypto trader can use to scan for, identify, and trade the evening star pattern. The Margex trading platform will also allow you to short-sell crypto assets like Bitcoin, Ethereum, Litecoin, and more.
Step 1 – Scan the charts of various cryptocurrencies to search for a potential evening star pattern setup. Remember, the pattern isn’t confirmed until the third candle reverses the prior trend, so taking a position only based on a developing evening star at the doji candle is risky. Confirm bearish signals with other technical indicators or signals.
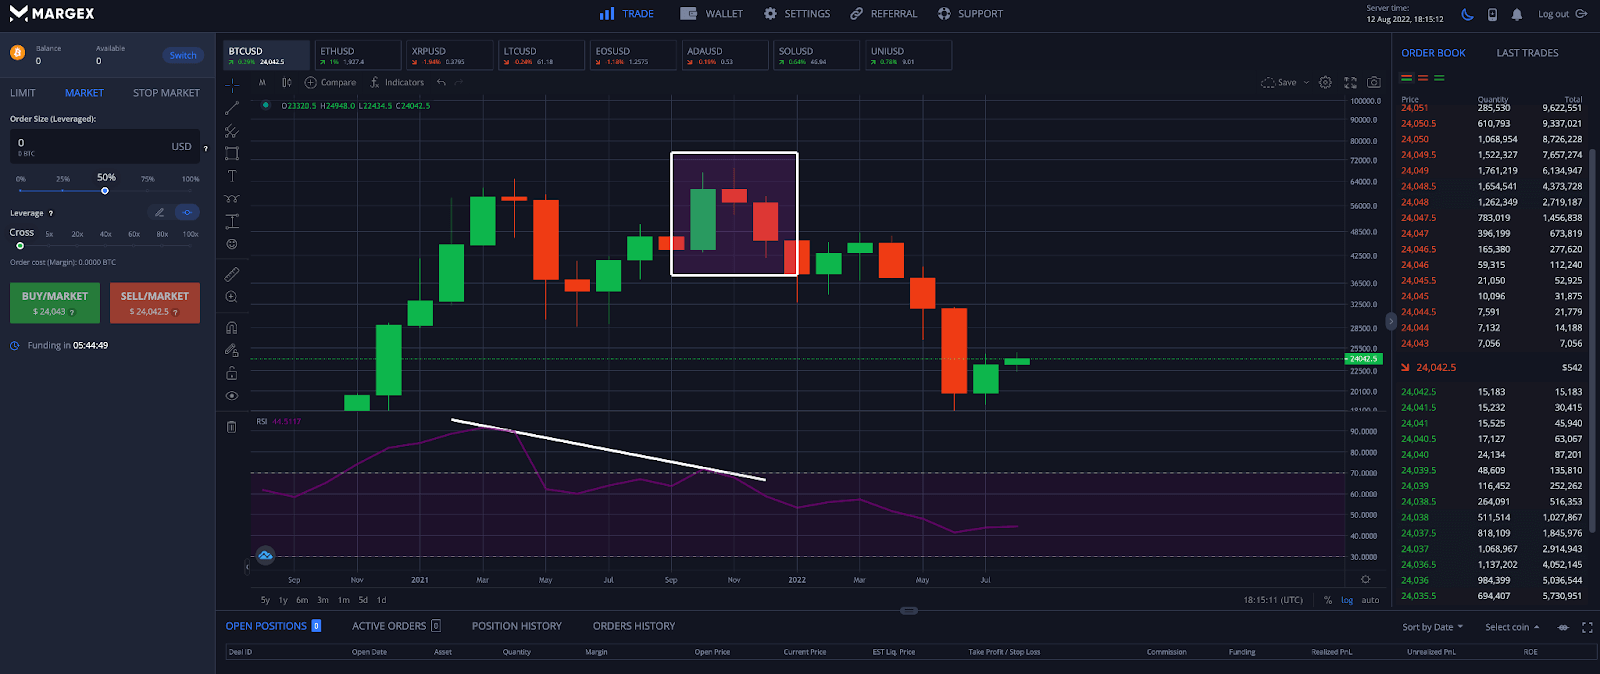
Step 2 – After seeing the doji at the failed breakout at resistance, a trader can then begin to watch for the evening star pattern to confirm. Once the pattern confirms, the trader can place a short order. A bearish divergence on the RSI confirms the pattern.
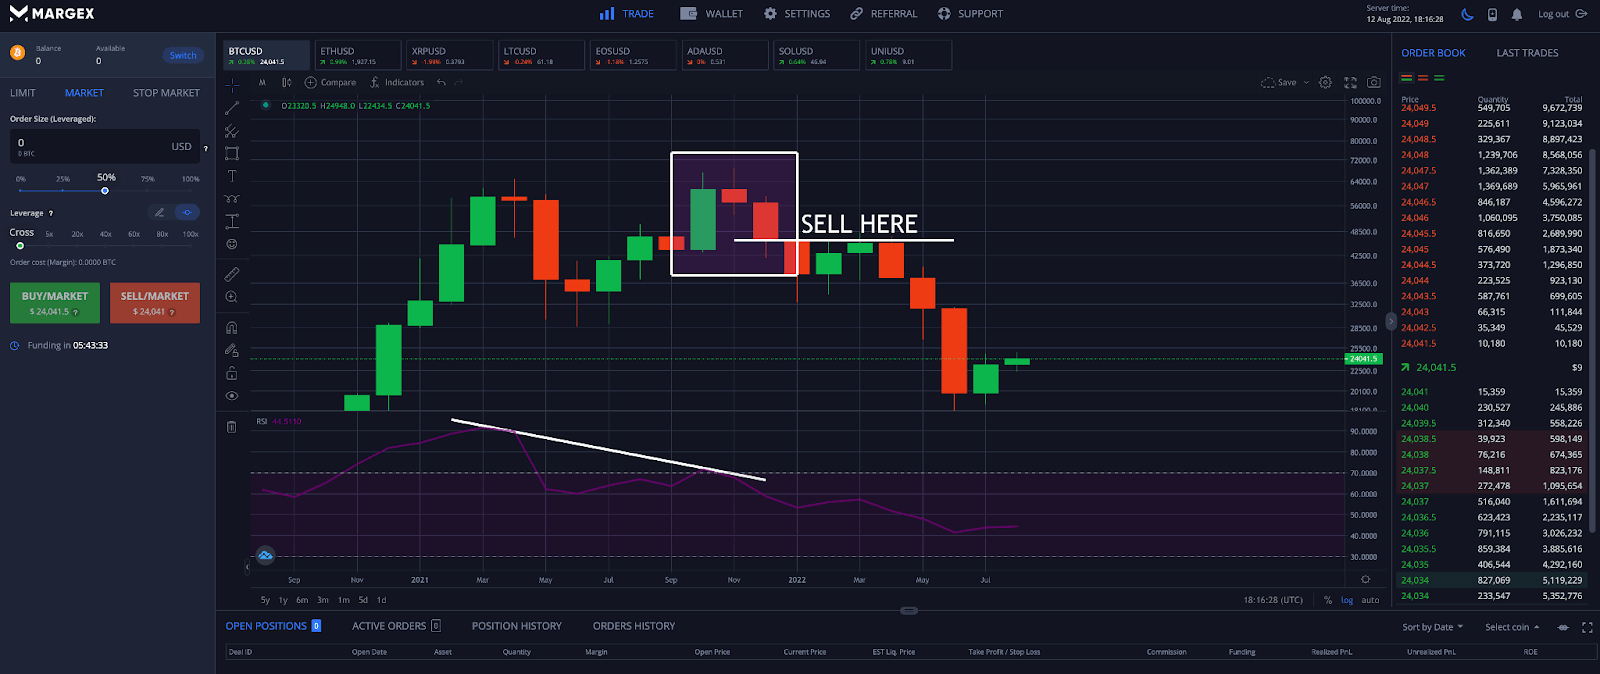
Step 3 – Using Margex risk management tools, users can place a stop-loss order above the top of the single-candle, smaller-bodied doji at the height of the pattern. Doing so will prevent significant loss if Bitcoin were to instead make a new high.
Step 4 – Plan to take profit at a predefined support level. To do so, draw a horizontal trendline across previous support zones.
Comparing The Evening Star Pattern Versus Other Top Patterns And Candlestick Formations
Here is how the evening star pattern compares to other common chart patterns and Japanese candlestick patterns.
Evening Star Pattern Versus Morning Star Pattern
The morning star pattern is a bullish candlestick pattern. It is the bullish reversal pattern counterpart to the evening star pattern.
Unlike the evening star pattern, the morning star pattern occurs at the bottom of a downtrend and begins a new uptrend. The only true similarity is that there is a doji pattern as the middle candlestick, signaling indecision in the market.
Evening Star Pattern Versus Bearish Harami Pattern
Although both are bearish Japanese candlestick reversal patterns, there are several differences between the evening star pattern and the bearish harami pattern. With an evening star pattern, the evening star doji forms at the peak of the pattern following a large candle.
The bearish harami is named for the Japanese word for pregnant. The next, smaller-bodied candle appears following the large candle in the middle of the large candle, appearing as a pregnant belly. Another difference is that the evening star pattern is a three-candle candlestick pattern, while the bearish harami is a two-candle candlestick pattern.
Evening Star Pattern Versus Head and Shoulders Pattern
Both of these patterns are topping patterns. However, how they form is vastly different. An evening star pattern forms across only three candlesticks. Meanwhile a head and shoulders reversal pattern that typically consists of ten or more candlesticks in a row.
A head and shoulders pattern must create three successive highs, with the largest peak in the middle, creating a structure that resembles a head and shoulders. It isn’t uncommon for an evening star pattern to form at one or several of these peaks.
Evening Star Pattern Versus Triple Top Pattern
Again, both patterns are bearish reversal patterns. The key difference here is that a triple top has three roughly equally high peaks and develops across a longer timeframe and larger number of candles.
Much like the head and shoulders pattern, it isn’t uncommon for evening star patterns to form at one or more of the peaks in a triple top pattern, strengthening the probability of the signal.
FAQ
The evening star pattern is a fairly straightforward to understand and trade pattern. We have created this list of frequently asked questions to help clear up any remaining confusion or concerns.
Can evening stars be green?
The answer is yes and no! But to help clarify, we’ll further explain. The evening star pattern must start green, form a doj on the next candle, then close with a large red candle. The evening star doji itself in the middle of the pattern can be either green or red. It doesn’t matter – both are bearish signals.
How do you trade evening stars?
An evening star should first be identified by finding a large green candle, followed by a doji showing a pause in the market due to indecision. It is not advised to take a trade yet at the doji, and to instead wait for a large red candle for bearish confirmation. The trade is then taken, with a stop loss placed above the doji candle body. Several red candles and a downtrend should follow.
What are the pros and cons of evening star candlestick?
The pros to the evening star pattern are that it is easy to identify and is a very powerful signal if confirmed. In terms of cons, the evening star pattern can turn into a failed pattern. It is important to wait for the pattern to confirm and not take an entry during the formation of the doji candle. The pattern is confirmed when at least 50% of the first candle is engulfed by the third candle, and its strength as a reversal signal grows the more the red candle engulfs the green candle.
How reliable is the evening star pattern?
The evening star pattern is among one of the more reliable Japanese candlestick patterns and technical signals, because they are easy to spot and significant in terms of acting as a trend reversal. The success of trading an evening star pattern can be improved by combining the pattern with other signals like technical indicators, chart patterns, and more. The third candle must also engulf more than 50% of the first candle or is considered invalid.


