
Trading cryptocurrencies to an inexperienced investor can feel unpredictable. The practice of technical analysis and the study of price charts and chart patterns can make sense of the volatility.
Using certain candlestick or chart formations in combination with various technical indicators can allow traders to predict possible price movements in the crypto market before they occur, creating higher probability setups for potential profits.
The Ichimoku Cloud can be an effective technical tool when used as part of a trading system combined with a proper risk management strategy. Using the guide below, you’ll learn how to utilize the Ichimoku Cloud indicator to get a read on the market and how to use the tool to trade crypto.

Everything You Need To Know About The Ichimoku Trading Tool
The Ichimoku Kinko Hyo, or Ichimoku Cloud, as it is more commonly known, is a technical analysis method developed by Japanese journalist Goichi Hosoda in the 1930s. Hosoda was said to have spent 30 years developing the Ichimoku system before releasing it in the 1960s.
Ichimoku Kinko Hyo in Japanese translates to “one glance equilibrium chart.” The tool’s creator later became known as “Ichimoku Sanjin,” which translates to “what the man in the mountain sees.”
Both translations should give you some idea of what the Ichimoku Cloud is all about. It is designed to allow traders to take “one glance” and see the market “equilibrium” as if the trader had the perspective from a mountain top.
Like many other popular trading indicators, the Ichimoku is a moving average based, trend-following indicator. Unlike other technical tools, the Ichimoku Cloud not only includes price as a factor, but time as well.
Every price chart consists of a y-axis that represents the price scale and a x-axis representing the time scale. Too many traders make the mistake of neglecting one half of the chart and only focus on price. The Ichimoku helps correct that common mistake by looking both backward and ahead for information, as well as at current price action.
How Is The Ichimoku Cloud Calculated? What Is The Ichimoku Cloud Formula?
The Ichimoku Cloud indicator isn’t calculated using just one formula. Instead, each individual element of the Ichimoku Graphic Environment has its own unique calculation and formula.
Here is how to calculate the various formulas for each element of the Ichimoku Graphic Environment using default settings (listed with English translation):
- Tenkan-sen (Conversion Line): (9-period high + 9-period low)/2))
- Kijun-sen (Base Line): (26-period high + 26-period low)/2))
- Senkou Span A (Leading Span A): (Conversion Line + Base Line)/2))
- Senkou Span B (Leading Span B): (52-period high + 52-period low)/2))
- Chikou Span (Lagging Span): Close plotted 26 days in the past
- Kumo (Cloud): Difference between Senkou Span A and Senkou Span B.
Is The Ichimoku Cloud Good For Crypto? Custom Ichimoku Cloud Crypto Settings Explained
The Ichimoku Cloud indicator is one of the most commonly used and highly effective technical indicators in crypto. It works to tell traders when the market is bearish or bullish, where support or resistance might be, or if a trend change is brewing. It works great for day trading crypto using the traditional default settings.
However, the Ichimoku Cloud indicator is one of the few tools that can be customized specifically for crypto trading. Due to time being an important factor related to the Ichimoku and its bearish and bullish signals, time is especially integral to customizing the tool’s settings to tailor it to the crypto market.
Ichimoku Cloud settings for traditional markets are (9, 26, 52, 26). 9 represents a week and a half of trading, while 26 accounts for the number of trading days in a normal month minus Sundays. 52 represents two months of trading days.
Because the crypto market never sleeps and is open 24/7, including night, weekends, and holidays, adjusting the settings for these unique conditions in crypto makes sense. Therefore, custom Ichimoku crypto settings are (10, 30, 60, 30). To analyze longer-term trends, the settings can also be set to (20, 30, 120, 60), doubling the length of some of the shorter timeframe crypto Ichimoku settings.

How To Read The Ichimoku Cloud
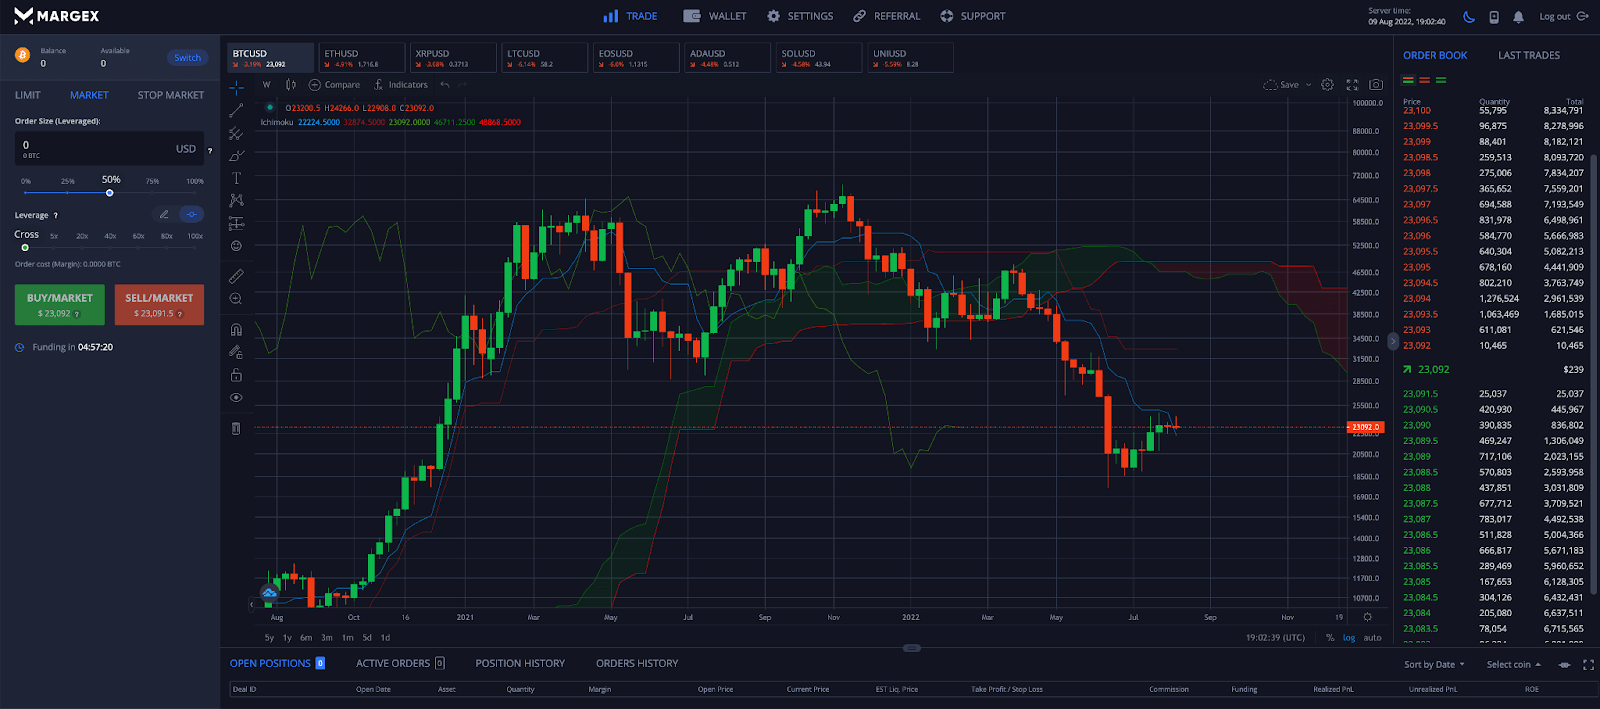
The Ichimoku Cloud aimes to give analysts all the information they need about the balance in the market in one glance. However, because there are several elements to the Ichimoku Cloud, the tool can also provide a variety of signals and a wealth of information about the market.
The Ichimoku Cloud example below using Bitcoin (BTC) depicts each graphic environment element. Below the Ichimoku chart example, each graphic environment element is explained in detail along with what it tells a trader or analyst about the market.
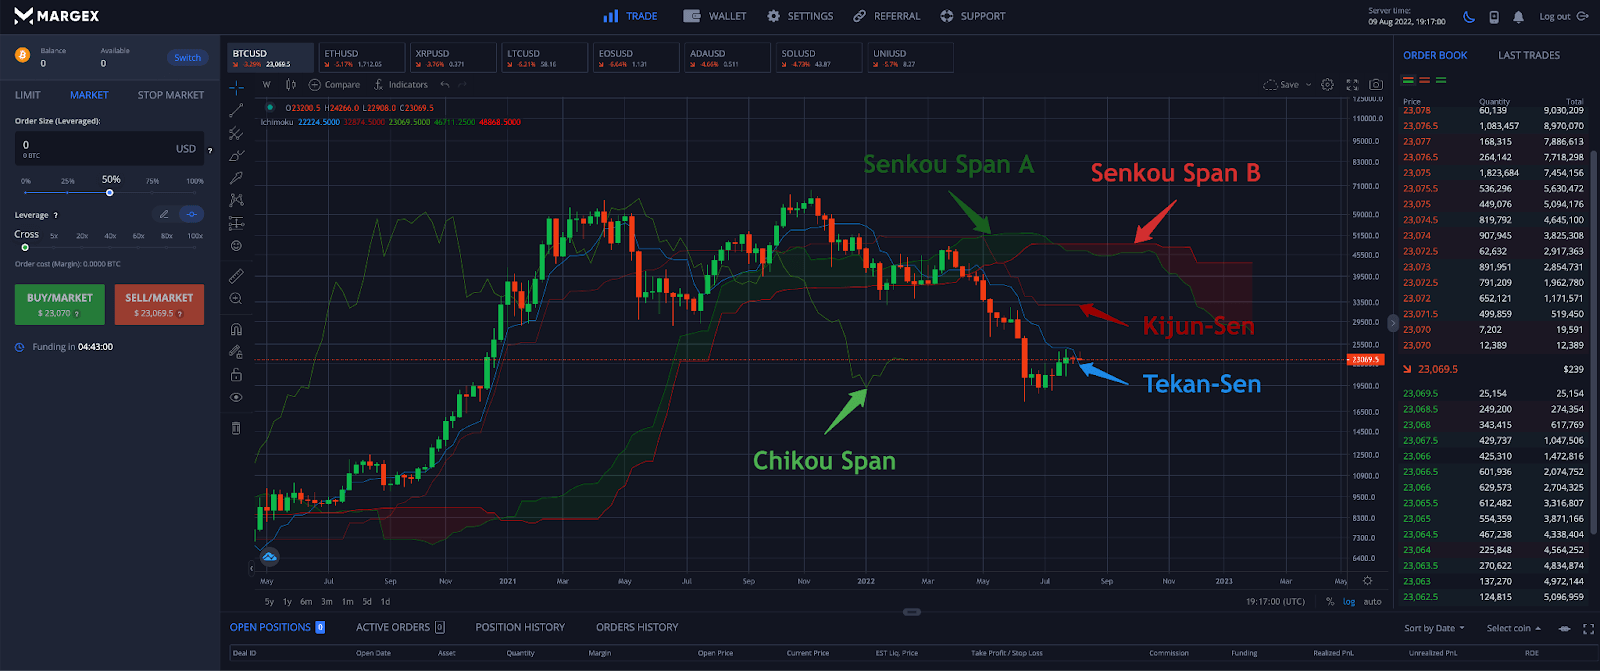
Tenkan sen (Conversion Line)
The Tenkan-sen is also called the conversion line and acts as minor support or resistance. It also works as a signal line that can provide buy or sell signals when passing through the baseline.
Kijun sen (Base Line)
The Kijun-sen is also called the base line and can also act as stronger support or resistance. It also tells traders when the market is trending or ranging. If the base line is moving up or down, the market is either in an uptrend or downtrend, respectively. If the base line is moving sideways, then the market is also ranging sideways.
Senkou Span A (Leading Span A)
The Senkou Span A is also called leading span A and is a leading indicator that looks forward by 26 periods. If price is above both spans then the first line acts as the first level of support, while the second span works as the second level of support. It also makes up one of the cloud lines.
Senkou Span B (Leading Span B)
The Senkou Span B is also called leading span B and is a leading indicator that looks forward by 26 periods. If price is below both spans then the first line acts as the first level of resistance, while the second span works as the second level of resistance. It also makes up the second cloud boundary.
Chikou Span (Lagging Span)
The Chikou Span is also called the lagging span and is a lagging indicator looking back by 26 periods. It tells the market where support and resistance exists.
Kumo (Cloud)
The Kumo or cloud is the most recognizable part of the Ichimoku indicator. The kumo provides a variety of signals, including potential future support and resistance levels. The size and the shape of the kumo increases in size from edge-to-edge or decreases based on volatility. Thicker clouds create stronger resistance and support, while thin clouds are weak and provide an opportunity for a potential price reversal. Kumo twists occur when the shade or color of the cloud turns from red to green or green to red, which can also indicate a change in the trend.
How To Use The Ichimoku Cloud Indicator Using Margex To Trade Cryptocurrencies
The Margex cryptocurrency trading platform offers advanced order types, long and short positions, and sophisticated technical analysis tools that the pros rely on, like the RSI, MACD, Bollinger Bands, Fibonacci tools, and the Ichimoku Cloud.
Here is a step-by-step guide on how to use the Ichimoku Cloud to create a profitable trading strategy.
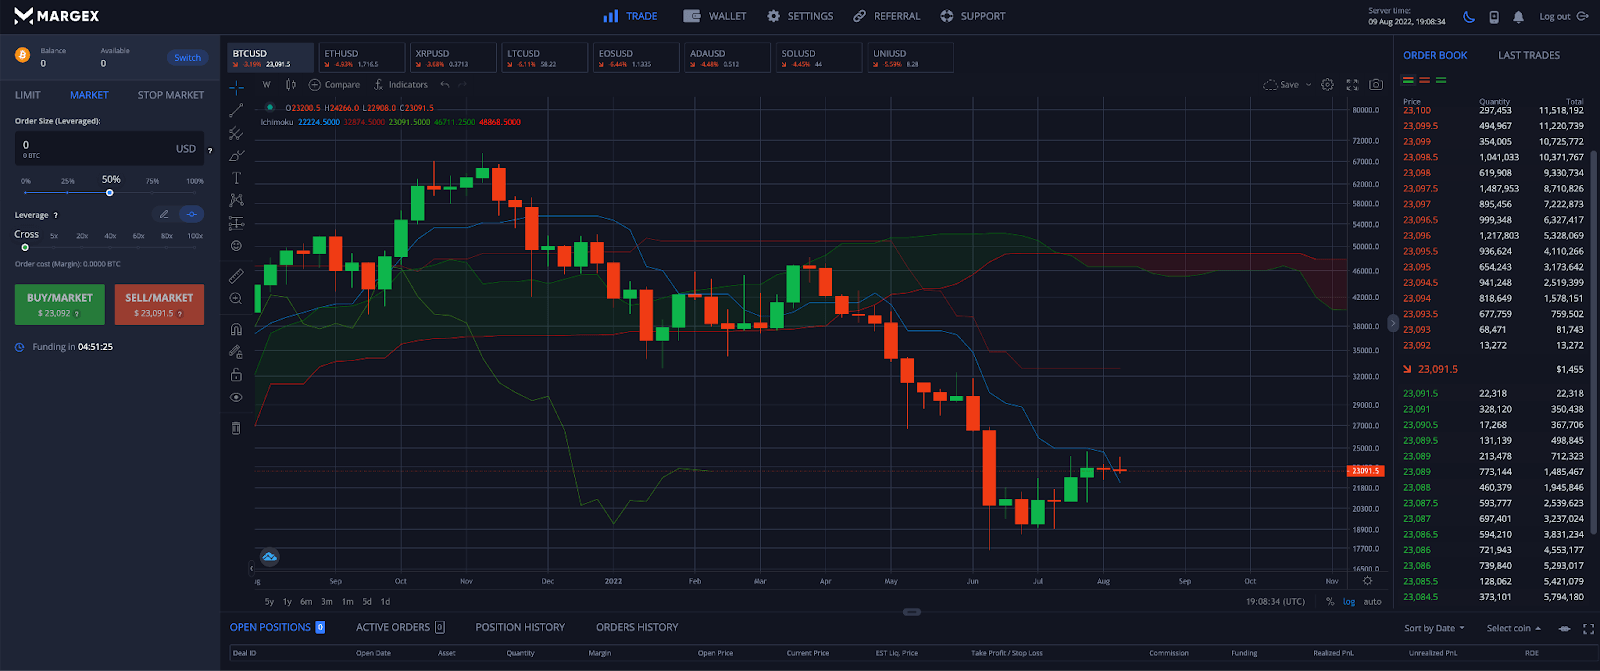
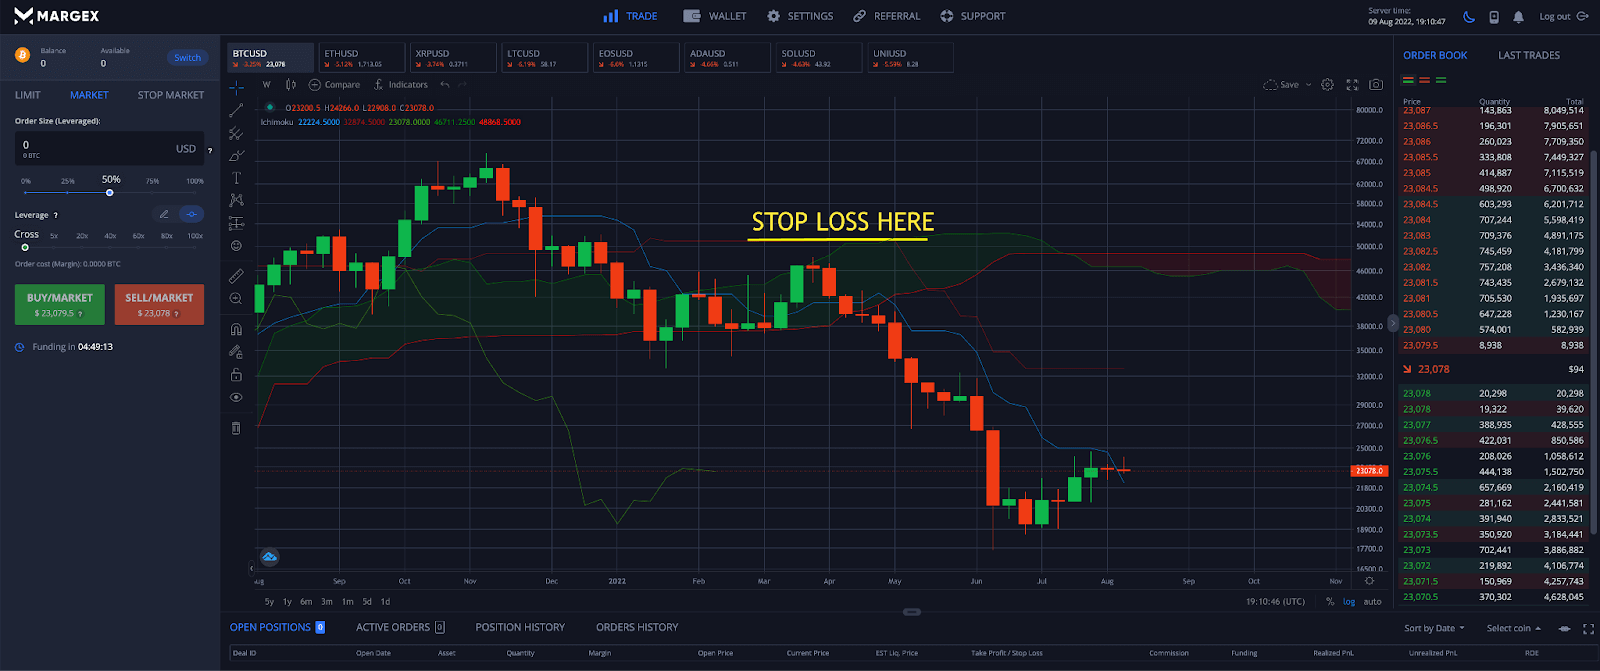
Step 1 – In the below Ichimoku Cloud Bitcoin daily chart example, turning on the Ichimoku Cloud indicator provides a setup where traders can minimize the risk of negative impact to capital by going short at cloud resistance at the mid-point of a trend.
Step 2 – A bearish crossover of the Tenkan-sen and Kijun-sen provides verification of the downtrend. A trader would then watch for a candle close at kumo resistance to go short or sell BTC.
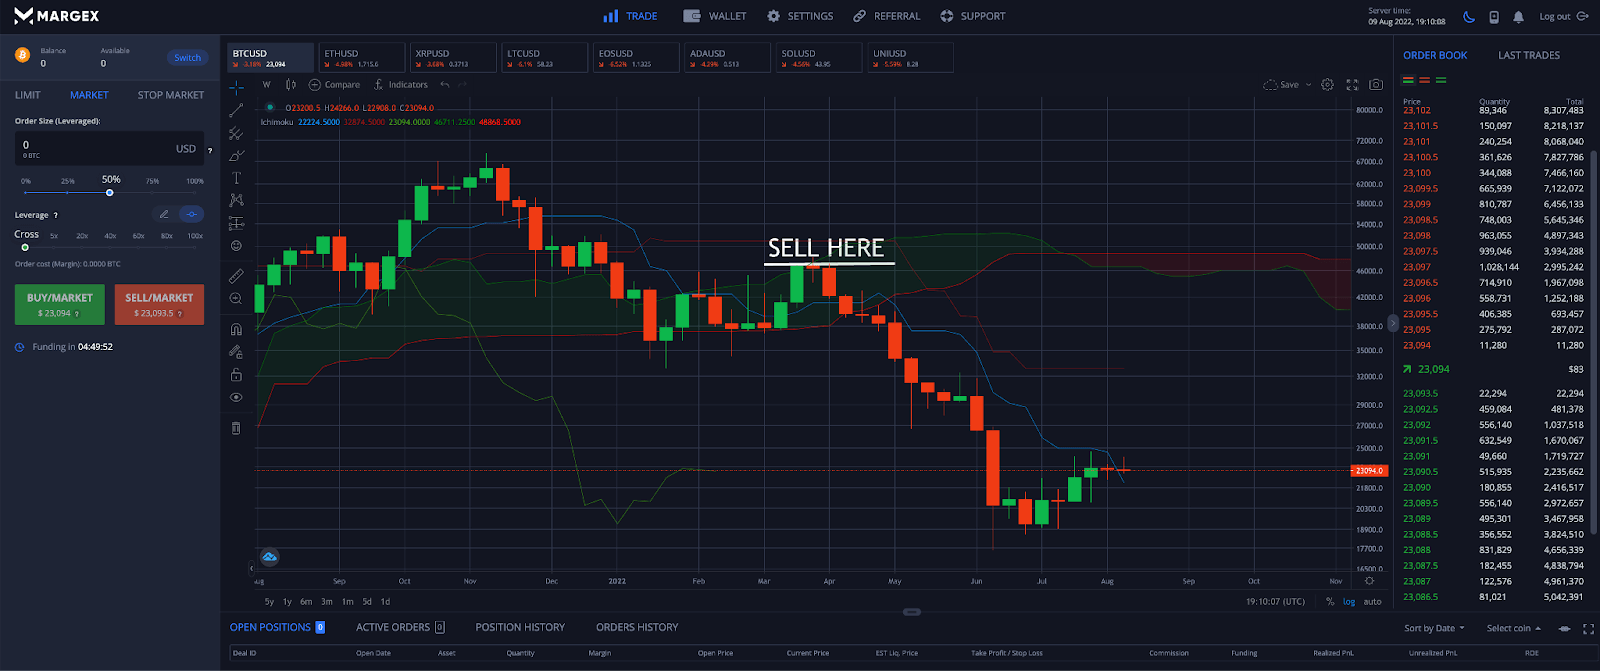
Step 3 – Next, a trader would want to place a stop loss order ideally above the cloud resistance and rising Kijun-sen.
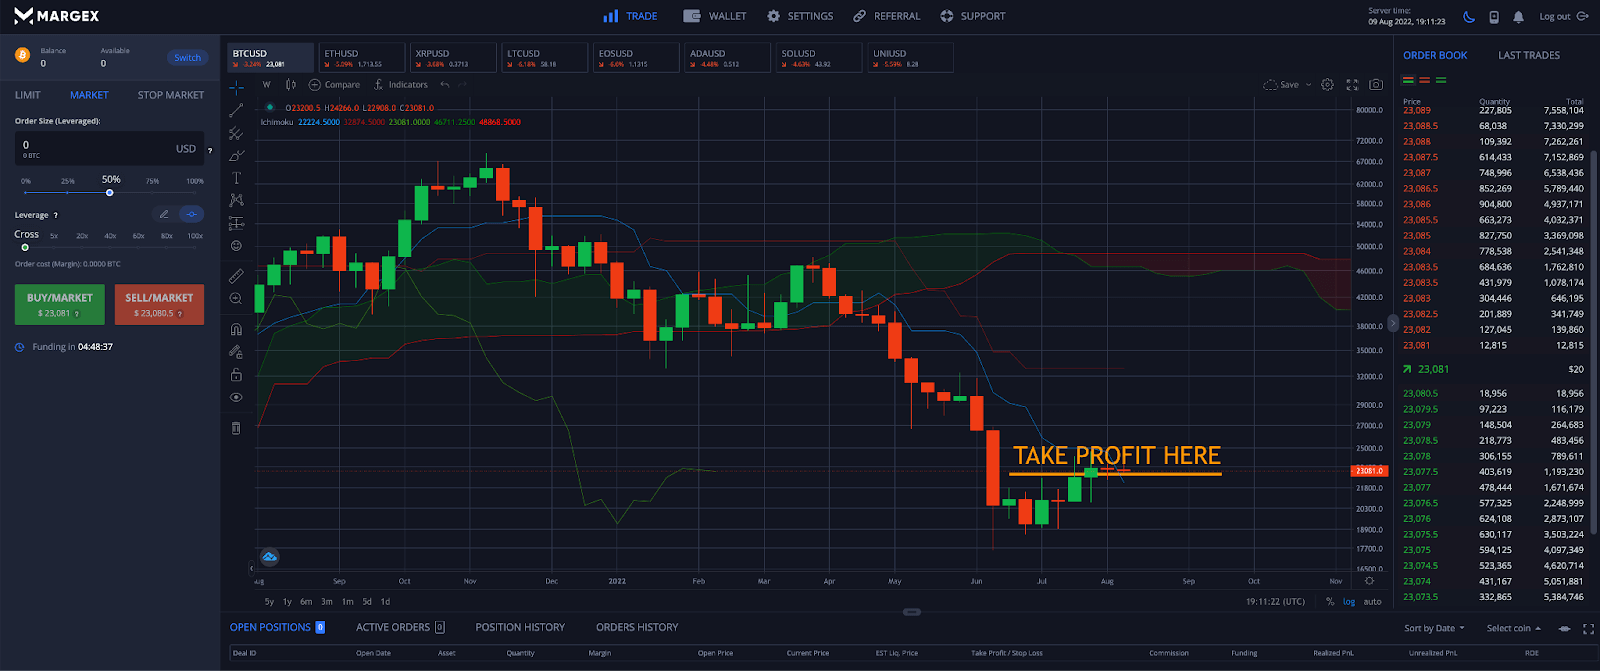
Step 4 – The trader would want to plan to take profit now that market price has climbed back above the Tenken-sen, which could be an indication the market is turning bullish.
FAQ
By far, because there are so many different possible trading signals based on a variety of spans, Ichimoku can be one of the most confusing tools. It is also one of the most reliable and powerful tools for crypto trading.
Here is a list of commonly asked questions to clear up any remaining confusion related to the Ichimoku Cloud indicator.
What is the Ichimoku Cloud indicator?
The Ichimoku Kinko Hyo is the one glance equilibrium chart developed by Japanese journalist Goichi Hosoda in the 1930s, earning him the nickname “Ichimoku Sanjin,” which translates to “what the man in the mountain sees.”
Is Ichimoku Cloud strategy good?
The Ichimoku Cloud strategy is one of the most effective and profitable trading strategies when applied to crypto. But it takes time, practice, and a strong understanding of how the Ichimoku indicator works.
How accurate is Ichimoku Cloud?
The Ichimoku Cloud can be incredibly accurate and rarely gives a false signal. It is worth experimenting with custom crypto settings and various timeframes to get a better read on the market and overall trend conditions, and possibly avoid lag. The tool can provide different signals on unique timeframes.
What is the best time frame for Ichimoku Cloud?
The best timeframe for the Ichimoku Cloud is the daily chart, weekly chart, or monthly chart. Any high timeframe price charts that many traders are looking at will price the best possible signals.
How do you use Ichimoku in crypto?
The Ichimoku Cloud can be used in crypto to find support and resistance, spot possible trend changes, tell when the market is bullish or bearish, and much more.
What is the best setting for Ichimoku?
The default settings for the Ichimoku Cloud indicator are the best settings for traditional markets that close on the weekends. Common Ichimoku crypto settings are (10, 30, 60, 30). To analyze longer-term trends, the settings can also be set to (20, 30, 120, 60), doubling the length of some of the shorter timeframe crypto Ichimoku settings.
Does Ichimoku Cloud predict the future?
The Ichimoku Cloud indicator can predict where future support and resistance may lie and essentially predict the future. Changes in the color of the cloud from red to green and vice versa can also predict future trend changes.
Which indicator works best with Ichimoku trading?
The Ichimoku Cloud works great with momentum indicators like the MACD and the Relative Strength Index, as well as tools like the Bollinger Bands and Parabolic SAR. When combined with chart patterns and Japanese candlestick patterns, these tools can be even more effective and provide an ever higher probability of results.


