
The professional trading community keeps this information close to their chest, and not even persons who advertise themselves as professional educators know about it. Here’s a comprehensive guide on how to utilize an order flow trading strategy.
Order flow analysis is the practice of examining order flow and attempting to forecast how it will affect the price of an instrument. It enables you to monitor how other market players are interacting with the market. Consider it a microscopic examination of candlestick patterns.
The order flow provides a vivid picture of the market forces. For example, if there are more sellers than buyers, the sellers may have to offer a lower price to sell their product. Similarly, more buyers would raise prices since it gives the few suppliers greater leeway in determining the price.
Each trader interprets the order flow in their manner. The kind of order (buy/sell), order volume, and price trend are all critical factors in order flow analysis. Some traders are also interested in separating limit orders and market orders to better comprehend the price movement.
To properly understand the dynamics of order flow, it is critical to include stock-specific and macroeconomic events. Such developments may swiftly generate a spike in a specific order, which is a good indicator of where the asset’s price will likely go.
Order flow analysis is often used in spot and derivatives markets and across asset classes such as stock, futures, and foreign currency.
What is an order flow trading chart?
Order flow charts allow you to glimpse within the candles. This extra critical information allows precise and real-time analysis of previous and present market activities. The order flow chart may be presented in various time frames, although it is most often used in time frames ranging from one minute (M1) to five minutes (M5).
Volume order flow, bid x ask order flow, and delta order flow are the most prevalent types of order flow candles. Furthermore, these representations may be aesthetically personalized using filters that, depending on the approach, make associated characteristics more clearly identifiable.
Margex Trading Strategy: Taking Advantage Of Order Flow
In technical analysis, we seek trading zones or price levels. However, in order flow analysis, we search for hints on when and at what price to trade.
Trading with order flow may provide us with information about:
- Significant purchase and sell orders (it can drive the market price).
- Buying and selling on impulse.
- The flow of liquids and illiquid (how big are the buy and sell orders: small, medium, or big).
- Exhaustion of momentum (when the order flow is drying off, it may signal a price reversal).
- Stop looking.
- Buyers and sellers who are stranded.
- Following that, we’ll review the order flow trading tools we employ as part of our basic day trading strategy.
What Order Flow Trading Tools Are Adopted On Margex?
We use footprint charts as one of our order flow trading tools. Siera Charts is the finest order flow trading tool for creating footprint charts.
To see the footprint chart for the Siera Chart, please scroll down:
Buyer and seller activity is shown on a footprint chart. With this data, we can examine the location of the large order backlog and evaluate it against the market’s current trends. A market’s present condition is shown by the history of actual trades, not the transactions promoted (through limit orders) as being possible if we reach a specific price.
Order flow trading is based on adjusting trades in response to changes in market activity, as shown by the number of transactions executed daily. The market orders are what the footprint chart mainly displays (all filled orders). By contrasting the ask and bid volumes, we can determine which side of the market is more potent.
We’ll go through the specifics of our order flow trading approach and how to read the footprint chart.
Order Flow Trading Strategy
Before we go into detail about how to apply the order flow trading method, we’ll show you how the footprint chart works.
You’re probably wondering how to utilize the Footprint Charts by now. These charts might assist you in developing a more thorough understanding of the market.
Let’s get started with the footprint charts and go through some of the crucial ideas of trading order flow.
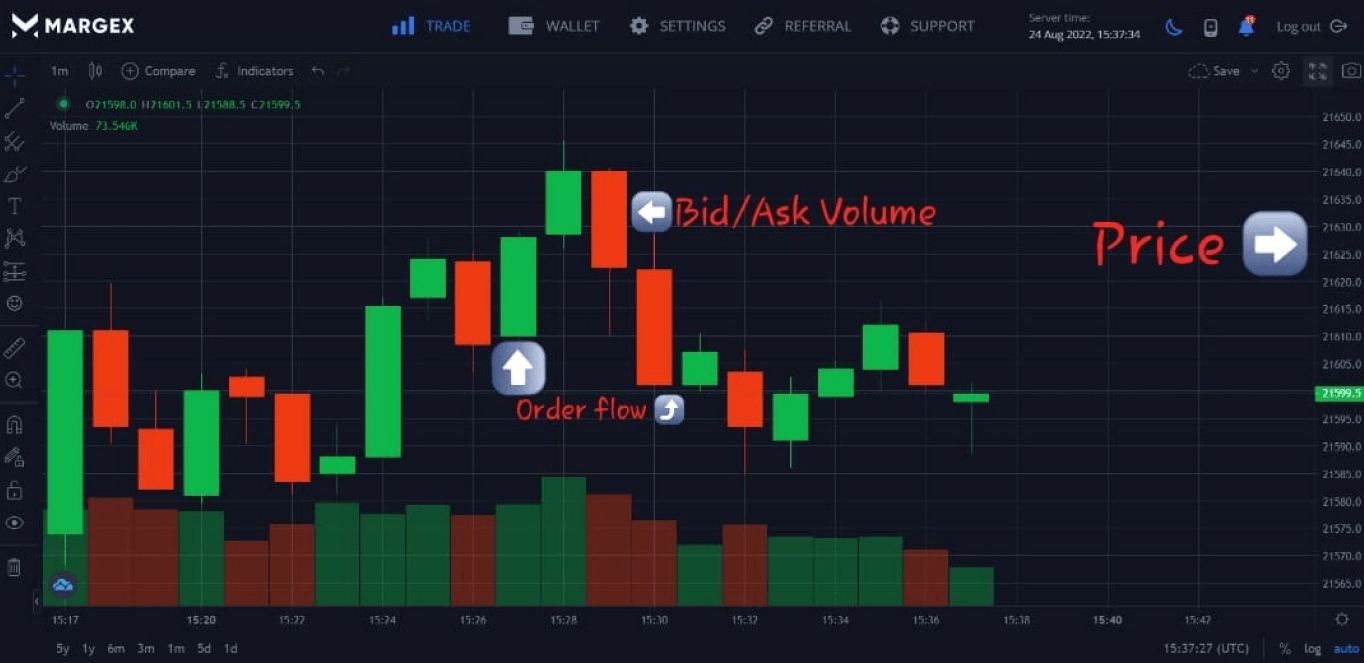
Each footprint chart contains three bits of information:
- First, each row on the footprint chart grows at a different price.
- In the cell, the bid-ask volume indication is shown.
- The flow of orders (green numbers show aggressively buying and red numbers show aggressive selling).
Take note that the price at which the most significant traded volume on each footprint happened is the point of control.
When we dissect the footprint chart, we find two things:
- Bids from the left
- Right-hand side offers
You may begin to get an image of the link between the bid and ask volume.
If you’re an ambitious seller looking to join the market, you’ll have to make a bid. Alternatively, if you’re an ambitious buyer who doesn’t want to wait for a limited order to be filled, you’ll hit the market order and raise your offer. The footprint chart will depict the whole procedure.
The number will become green as the buyers get more aggressive. This suggests that buyers outnumber sellers. When sellers get more aggressive, the number on the footprint becomes red. Remember to always consider using this forex buyers and sellers indicator.
When you observe stacks of these imbalances one after the other, it’s a sign that buyers (and sellers) are becoming more aggressive. Depending on where they occur, we may attempt to qualify deals based on these imbalances.
For example, if the footprint reveals an imbalance of purchasing activity near the low end of the range, this often indicates a possible level of support.
If you observe many purchasing imbalances appearing towards the top of the candle, this might suggest stranded longs and a likely reversal. Following that, we’ll go through how to trade order flow utilizing chart patterns.
Footprint patterns in order flow trading
In addition to the aggregated orders, we’ll include the horizontal volume profile, showing us the total number of buy and sell orders transacted at a special price.
The volume profile will be shown as a series of rectangles of varying lengths.
Please see the following:
The footprint chart now displays a 3D map of the market’s buyers and sellers. In this manner, we can observe what is happening behind the bitcoin candlestick charts and discover who is in power.
The P pattern is the first footprint pattern that can be traded utilizing order flow trading.
You could be thinking:
What exactly is the order flow “P” pattern?
A small volume profile defines the P pattern in the bottom half of the candlestick and an extensive volume profile in the top half.
Note that the P pattern should have tiny shadows and a bullish candlestick.
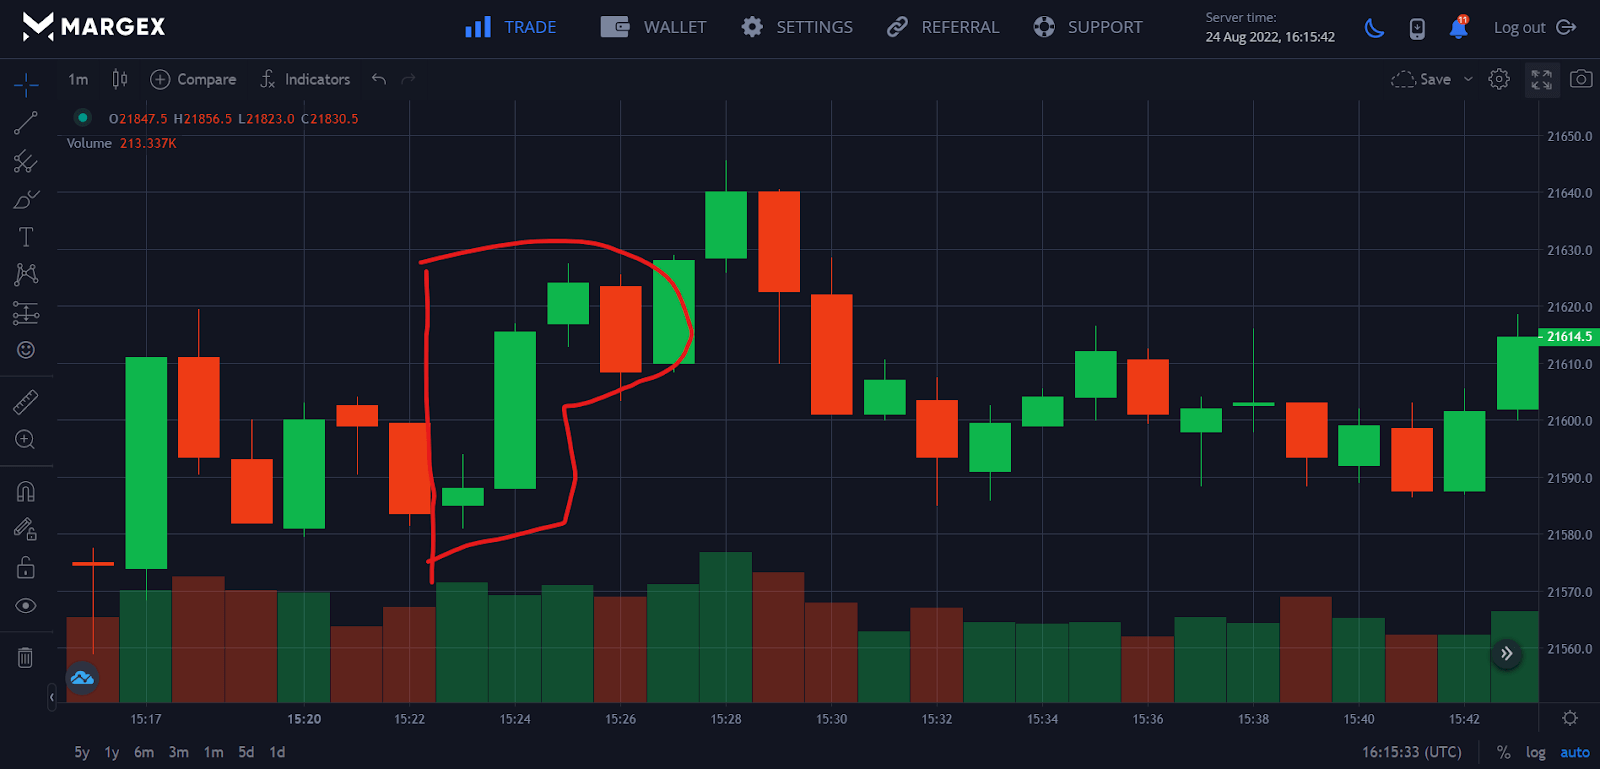
This order flow trading setting indicates that sellers are liquidating their holdings. When the current trend is bearish, this footprint pattern works well.
It is not recommended to trade this order flow trading pattern if it appears in a positive trending or range market.
The B pattern is the second sort of order flow trading setup we want you to master. This is the P pattern’s inverse form.
The B pattern features a small volume profile in the top half of the candlestick and a more extensive volume profile in the bottom half. This order flow pattern indicates that purchasers are leaving their holdings. When the current trend is bearish, this footprint pattern works well.
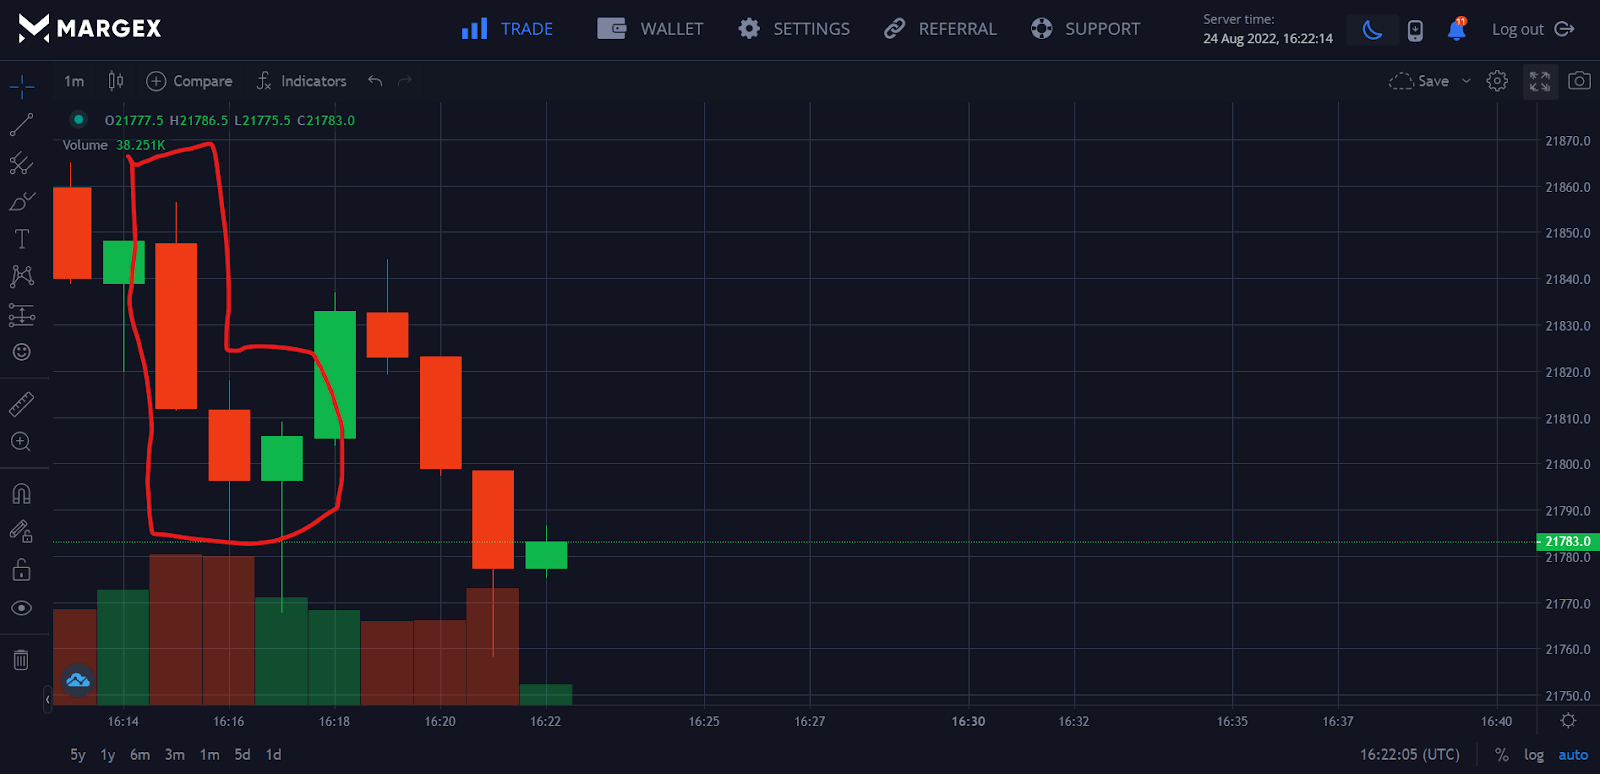
The B and P patterns are reversal trading setups using order flow analysis.
Look at how to trade order flow imbalances using footprint chart trading.
Imbalances in order flow trading
Order flow imbalances occur when the market takes an aggressive stance. When we witness excessive buy-side or sell-side aggressiveness, we call it an aggressive initiative. When this occurs, the market often tops out after a bold advance (bottom).
The valid key to an order flow imbalance is a significant increase in volume.
There are three trading rules that you must follow:
- We trade in the direction of the order flow imbalance, searching for continuation patterns.
- If it does not follow the trend, we seek a way to compensate for the imbalance.
- We may search for a reversal if we can go beyond the imbalance.
Remember, you only have a trade signal if you can properly access it in the correct area and period. And here is when the footprint comes in handy.
FAQ
Here are a few commonly asked questions on the order flow trading strategy.
Is order flow trading profitable?
Trading order flow is founded on three basic concepts; keep it simple, practical, and effective. That’s all. Many experienced traders at a prop trading business employ order flow trading in their daily routine. Order flow trading is the most nuanced approach for an investor to get a competitive edge in the market. Because the strategy is simple and effective, it is profitable when paired with price action.
The critical benefit of order flow trading is the quantity of information it can provide. (As you are aware, day trading is rife with information.) In addition, order flow trading will give you a better understanding of what is going on on your trading chart.
Why do brokers pay for order flow trading?
The simple explanation is that it is financially advantageous to do so. The bid-ask spread is critical to understanding how. The bid-ask spread is a bracket representing the maximum price at which buyers are ready to pay for a stock, the bid, and the lowest price at which sellers are willing to sell that stock, the ask. It depicts the price of a stock at any particular moment, based on supply and demand variations. Data comes from public exchanges and aggregates into a listing known as the NBBO, or National Best Bid and Offer, as deals are made. So, when investors see a stock price for a firm on their brokerage app, they’re viewing the NBBO price.
To demonstrate how this works, say Company XYZ’s bid is $99.00, and the ask is $100.00, resulting in a $1 spread. An investor wishes to acquire XYZ stock at the midpoint of $99.50. This order is sent from the investor to the brokerage and then to the market maker. The market maker may offer to sell for $99.50, but only after first acquiring those shares at $99.40 and pocketing the difference.10 cents. So, although the investor sees some price gain, they aren’t getting the most proper execution and are losing value overall.
In order flow trading, consider payment for order flow a transaction between a brokerage and a market maker.
A brokerage works with a clearing business to execute a stock market order. A clearing business is in charge of simplifying the deal and ensuring that everything runs smoothly between the brokerage, market maker, and exchange throughout the trading process.
The deal will be executed by market makers (or professionals looking to benefit from the bid-ask price of an asset). Meanwhile, the market maker provides the brokerage a fractional profit as a thank you for delivering the business.
What is the best order flow trading indicator?
Successful traders all have one thing in common: they can utilize charts to identify the finest trading opportunities at any given moment. The ability to see patterns that indicate where prices may move is priceless.
Price and timing are two crucial aspects of every chart. Although volume-based technical indicators are helpful, they are supposed to augment price and time-based indicators. The most successful traders understand that combining price, timing, and volume may be more profitable than using them alone.
Tick on the NYSE
This is a handy indicator if you trade US equities or index futures. It takes practice to become skilled, but once you do, you will improve your techniques by better timing your inputs and exits.
This indication is best suited for scalpers using short time frames.
Stocks on Upticks – Stocks on Downticks (downtrend) = NYSE TICK. It’s a live demonstration of buyer and seller hostility for the whole market.
VWAP, or Volume Weighted Average Price, is an indicator that every trader should employ regardless of trading style. Why?
VWAP works very effectively and is employed by every significant trader and the majority of institutional traders.
(Volume * Price) / Volume = VWAP
Is order flow important?
You can see exactly how the market is moving thanks to the order flow trading. For instance, if there are much more sellers than buyers, the former is likely to set a cheaper price in order to move their goods. Similar to how a greater number of buyers would cause prices to rise since it would offer the smaller pool of sellers more leverage over the selling price, fewer buyers would not affect pricing.
There is no universally accepted interpretation of the order flow since different traders may draw different conclusions. The order volume, the order type, and the price trend are the most important elements in order flow trading analysis. Limit orders and market orders are two types of trades that traders may be interested in splitting apart to predict the future direction of prices better.
How do you determine order flow?
There is a wealth of data contained inside each candlestick that may be gleaned by analyzing order flow. The order flow trading system may be compared to a volume-based trading system. The number of buying and selling market orders executed at each price point may be shown graphically in an order flow chart.


