
The act of forecasting prices of different cryptocurrency assets ranging from Bitcoin (BTC), Ethereum (ETH), and other altcoins is a skill that, when harnessed to a good degree, exposes traders, investors, and institutions to endless opportunities that abound in the crypto space.
For example, identifying the current crypto market trend gives traders the best opportunity to buy and sell their crypto assets. With the help of technical analysis tools such as indicators, oscillators, candlestick patterns, and chart patterns, a trader can predict the price actions and volatility associated with a particular crypto asset.
Trading with a comprehensive understanding of the next move in the market could give most traders and investors an edge and help reduce exposure to risk to a very minimal degree while maximizing profit potential.
In this article, we will see how we can identify shooting star candlestick patterns and bearish shooting star candlesticks and how we can use them for trading short positions to profit.
What Is A Shooting Star?
A shooting star candlestick is a bearish price reversal candlestick pattern that appears at the end of an uptrend signaling a potential price reversal from a bullish price trend to a bearish price trend. It comprises a long upper wick or shadow with little or no lower wick companying the body.
A shooting star pattern is more like the inverse of the hammer pattern; a crypto asset opens, and the price advances significantly, but the price eventually closes near the opening price.
The following characteristics or criteria must be met for a candlestick pattern to be considered a shooting star.
- The formation of the shooting star pattern must appear at the end of an uptrend.
- There should be little or no wick below the body, while there is a long wick at the upper part of the body.
- The gap between the day’s highest price and the opening price must be more than twice the size of the shooting star’s body.
The major difference between the inverted hammer and the shooting star pattern is that the inverted hammer appears at the end of a bearish trend signaling a change to an uptrend. In contrast, the shooting star is seen at the end of an uptrend signaling a potential bearish price reversal.
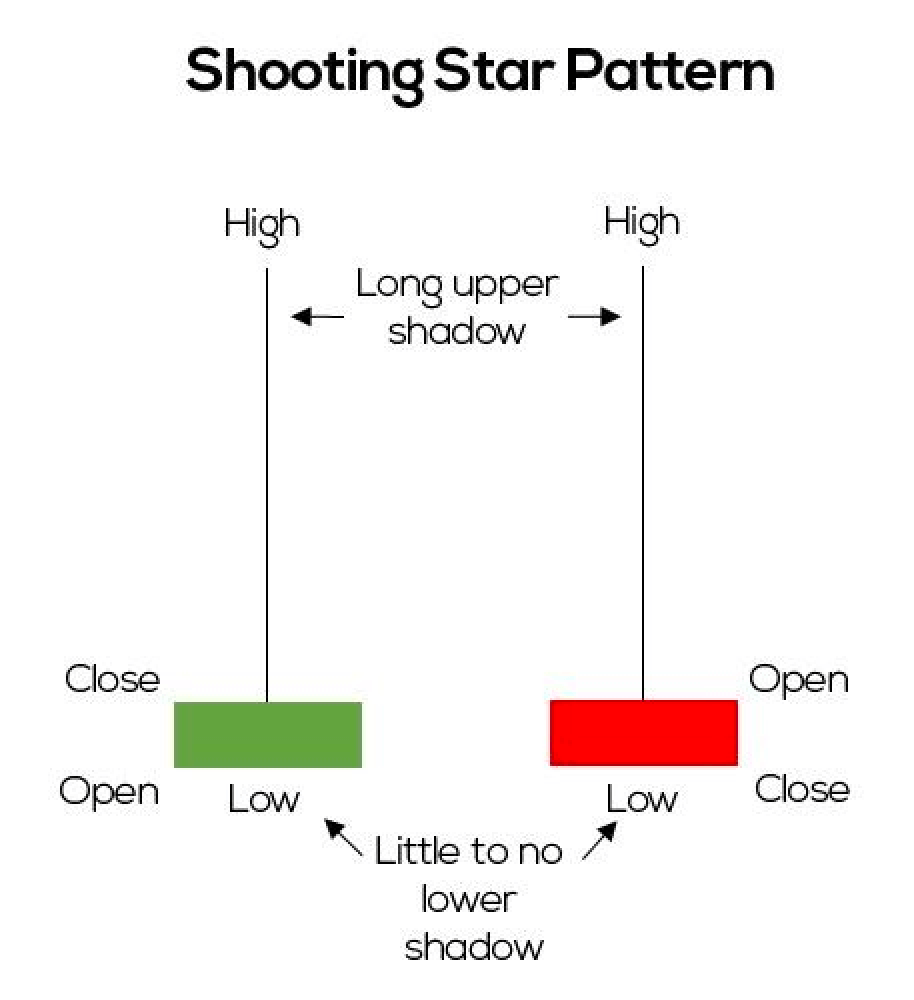
From the image, we can see an image representing a shooting star pattern with two different candlesticks, a green and red version of the shooting star candlesticks. Both are shooting star patterns, although the red candle is more powerful, indicating sellers exert more sell pressure at that point or timeframe compared to the green shooting star.
The shooting star has a long wick at the top of the body; usually, the longer the wick, the stronger the trend reversal since the wick indicates the bulls cannot close the price high. Most traders often use this pattern and wait for more price confirmation before entering a short position for a given crypto asset. The bottom line is the appearance of the shooting star at the top or end of an uptrend indicates a potential imminent price reversal to a downtrend.
What Does The Shooting Star Tell You?
A shooting star chart pattern appears at the end of an uptrend indicating a potential price reversal from a bullish trend to a bearish trend. The shooting star candlestick is most effective when the price is in an uptrend forming a series of higher highs (swing highs).
The shooting star candle tells us that in the course of an advancing price with the opening price of the shooting star looks strongest at a particular time of the day with the buying pressure looking good as buyers are in control of the market. As the day passes, the selling pressure buys sellers start coming in to overpower the buyers as the price picks up, pushing the higher price lower, indicating a shift of power from buyers to sellers wiping away all gain as sellers take full control of the market.
The shooting star candle, despite how effective it is, a trader needs to see the pattern completed or confirm this pattern before opening a short position. A bearish candle below the high of the shooting star candle confirms a bearish trend reversal, and a trader could look to open a short or sell position.
When trading the shooting star pattern, there may be resistance due to price range leading to a minor price consolidation. If a trader jumps into a trade after the formation of a shooting star without confirmation could be trapped if the price continues its uptrend as this candle formation is a consolidation for more uptrend, and a trader would best open a long or buy position.
Example Of How To Use The Shooting Star (Examples From Margex)
Margex is a Bitcoin-based cryptocurrency exchange that allows traders to trade up to 100X leverage size long and short positions with as little as $10. Margex has a unique trading feature on its platform that allows users and traders to stake and trade the same crypto assets with close to 13% APY.
You don’t need to be an experienced trader to access the Margex staking feature; Margex is designed in a way that the user interface makes trading easy for both beginners and advanced traders. There are no lockup periods for staking, and staking rewards are sent daily to your staking balance through the Margex automated system.
With the Margex platform, you have free access to trading tools that would improve your trading results immensely and help build a more profitable portfolio. Let us examine some examples of the shooting star candlestick patterns discussed above and how to trade them.
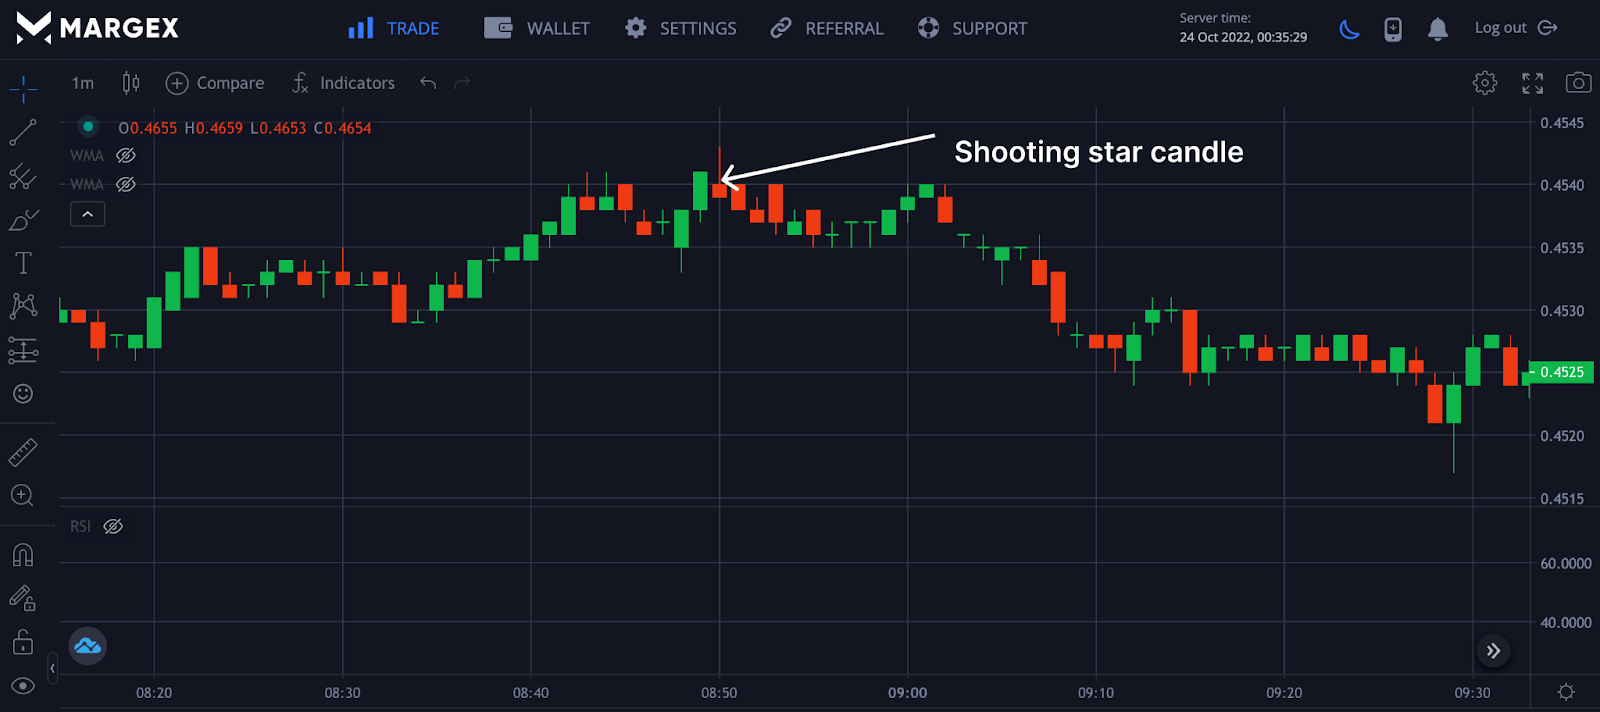
The chart above shows XRPUSD forming a shooting star candle after the price formed an uptrend, with the uptrend coming to a potential end with the emergence of the shooting star candle. After retesting and breaking the candlesticks below the shooting star candlestick, a trader could open a short position with stop loss in place to minimize risk.
With your knowledge about shooting star candlesticks, let us see how you can trade them on the Margex platform with the following steps below.
Step 1: Identify Shooting Star Candlesticks
- Identify a bullish trend made up of swing highs or higher highs.
- Identify the shooting star candlestick at the end of the trend with a small body and a big upper candlewick.
- Wait for a bearish candlestick to break the low shooting star body to confirm the formation of this pattern and a potential price reversal if you are looking to open a short position.
- Confirm significant supply with an increased sell volume; this will further confirm the formation of the shooting star candlestick.
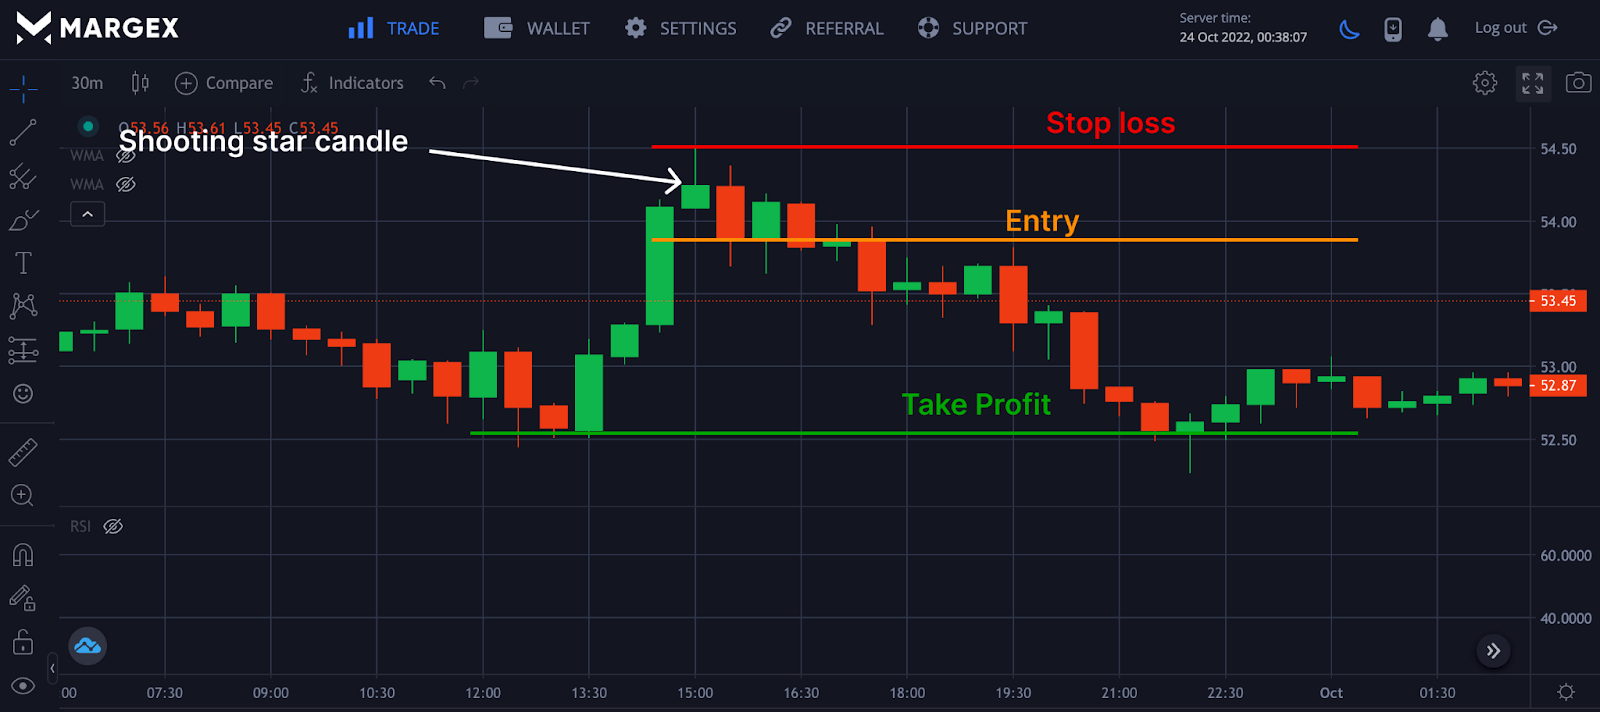
Step 2: Stop Loss
It would be best to use stop loss when trading strategies like shooting star candlestick, as they are not always 100% sure to work. Sometimes the volatility and price actions of the market can make these patterns produce false signals and could lead to losses of funds. Stop loss should be used just above the shooting star candle pattern above the upper wick of the pattern, giving enough room to be stop-hunted.
Step 3: Take Profit
Setting take profit for every trading strategy is the best way to go, as this will help you to maximize your profit returns and track your expected return on investment.
A Resistance And Exit Strategy Indicator
The shooting star candlestick pattern is a good tool used by traders to visually identify where potential support and resistance are situated on the chart. This pattern signals to traders a potential end to an uptrend with a downtrend on the horizon and could be imminent with the traders looking to close their potential long signals.
Using The Shooting Star To Spot Sell Signals

Aggressive traders would look to open a short position on spotting the shooting star candlestick with hopes of a potential downtrend. From the image of the XRPUSD pair after the formation of the shooting star, the price decided to retest the highs of the shooting star candle with a potential price breakout below the body.
A trader could look for more confirmation and confluence before opening a short trade to avoid being trapped in an open short position.
Difference Between Shooting Star And Inverted Hammer
The inverted hammer candle and shooting star candlestick look almost similar; the difference is the location and the type of trend that comes before their formation.
The shooting star candlestick pattern is formed at the end of an uptrend signaling to the trader a potential price change from a bullish trend to a bearish trend.
The inverted hammer occurs at the end of a downtrend signaling the trader price change from a bearish trend to a bullish one.
Frequently Asked Questions (FAQ) About Shooting Star Candlestick Pattern
Here are the frequently asked questions that have troubled many traders about what a shooting star candle is, how to trade this pattern, and is the pattern the same as an inverted hammer.
How Do I Identify A Shooting Star Candlestick?
A shooting star is a bearish candlestick formation that appears and forms during an uptrend or in a bull market.
A shooting star candlestick can be spotted and identified when a long wick appears at the upper part above the small body of a candlestick with little or no wick below the candlestick body.
Traders looking to open short positions may also be patient enough to wait for yet another bearish candlestick to break the shooting star candlestick body’s low to confirm a potential bearish price reversal.
It is important to note that this type of candlestick formation must appear during an uptrend to validate a shooting star candlestick pattern and its bearish reversal significance.
What Does An Inverted Shooting Star Candlestick Show?
An inverted shooting star candlestick formation, also known as the inverted hammer, is the opposite of the shooting star candlestick formation.
Its occurrence and formation are usually seen and spotted at the peak of a downtrend or bearish market, unlike shooting star candlesticks, which can be spotted in uptrends and bull markets.
The inverted shooting star candlestick formation indicates a potential bullish price reversal and an end to a bearish cycle in the financial and cryptocurrency markets.
Like every other candlestick formation signal, traders do well to make further confirmations from strategies and multiple technical indicators to confirm the validity of candlestick signals.
When Do I Use A Shooting Star Candlestick?
A vast majority of traders pay attention to candlestick formations, such as the shooting star, to get trade information on possible price reversals.
A shooting star is a candlestick pattern formation that communicates a potential downtrend and bearish reversal outlook in the cryptocurrency markets.
Traders leverage and utilize shooting star candlesticks formations to determine short position entries and maximize opportunities from trend reversals.
However, traders may look to multiple technical indicators and trading tools to further verify the validity of shooting star candlestick formations.
How Accurate And Reliable Are Shooting Star Candlesticks?
A shooting star candlestick formation may be a helpful guide to traders looking to spot trends and bearish price reversals.
In determining bearish reversals, shooting star candlestick pattern formations are only as accurate when combined with multiple bearish reversal technical indicators.
Traders looking to be consistent at winning and profitable trades may employ other technical indicators and bearish reversal strategies to validate shooting star candlestick signals.
Making trade decisions based only on a shooting star candlestick formation may sometimes not go to plan, as numerous factors contribute to a bearish price reversal.
Are Shooting Star Candlesticks Bearish Or Bullish Candlestick Patterns?
A shooting star candlestick formation is generally a bearish indicator of a potential downtrend or possible bearish price and trend reversal.
It is usually spotted during episodes of bullish momentum and uptrends in a bullish cycle or bull market. Good knowledge of spotting and identifying shooting star candlestick patterns and other strategies and technical indicators can place a trader at an edge leveraging bearish reversals. Shooting star candlesticks formations are bearish candlestick indicators, while inverted shooting star candlesticks formations indicate bullish reversals.
Are Shooting Star Candlesticks And Inverted Hammer Candlesticks The Same?
The shooting star candlestick formation and the inverted hammer candlestick formation differ from what they indicate in an uptrend and downtrend.
The shooting star candlestick is an indicator candlestick pattern that shows a possible and potential bearish reversal from an ongoing uptrend.
On the other hand, the inverted hammer candlestick formation is used as an indicator for bullish price reversals when spotted in a steep downtrend or bearish market.
When combined with other technical tools and indicators for trade entry confirmations, both candlestick patterns and trend shift indicators can be successfully leveraged by traders.


