
The gravestone doji candlestick pattern is a bearish reversal pattern that is characterised by a single candlestick with a very small body with a long upper shadow. Often, this small body exists merely as a dashed line when both the opening and closing prices are the same.
The gravestone doji candlestick pattern is especially bearish when it appears after a prolonged uptrend near, or at a strong resistance zone. Often, this could also mean that the market is overbought. That said, there could be rare occasions that its appearance could be bullish or neutral – this happens when the gravestone doji appears after a prolonged downtrend near, or at a strong support level.
Hence, it is important to note the prevailing trend of the asset when determining if the appearance of a gravestone doji candlestick pattern is bearish, bullish, or even neutral.
What Does a Gravestone Doji Look Like?
Before we can decide if a gravestone doji candlestick is bearish or bullish, we need to first know how it looks so we can recognise it when we see one.
Simply put, the gravestone doji looks like an inverted capital letter “T”. This is created when its open price and close price, as well as its lowest price of the day, are at the same, or at very near to the same price. The most distinct part of a gravestone doji candle is that its highest price of the day is significantly higher than the other prices, which gives the gravestone doji a long upper shadow. This is the most important part of the gravestone pattern that shows the bearishness of the candle.
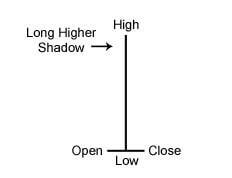
Why Is The Long Upper Shadow Important?
The long upper shadow is viewed in technical analysis to mean that the market has tested the demand and supply areas to the point where supply is found to exceed demand. This causes the overwhelming selling pressure to push prices back down to the opening price.
The gravestone Doji forms when the bulls initially push price upward in the midst of a strong uptrend. However, an area of resistance is found at the high of the day where sellers push prices back down to the opening price. Therefore, this indicates that the bullish advance has been rejected by the bears. The presence of such selling pressure may thus increase the chance of a price reversal as the bears overcome the bulls.
How to Interpret the Gravestone Doji
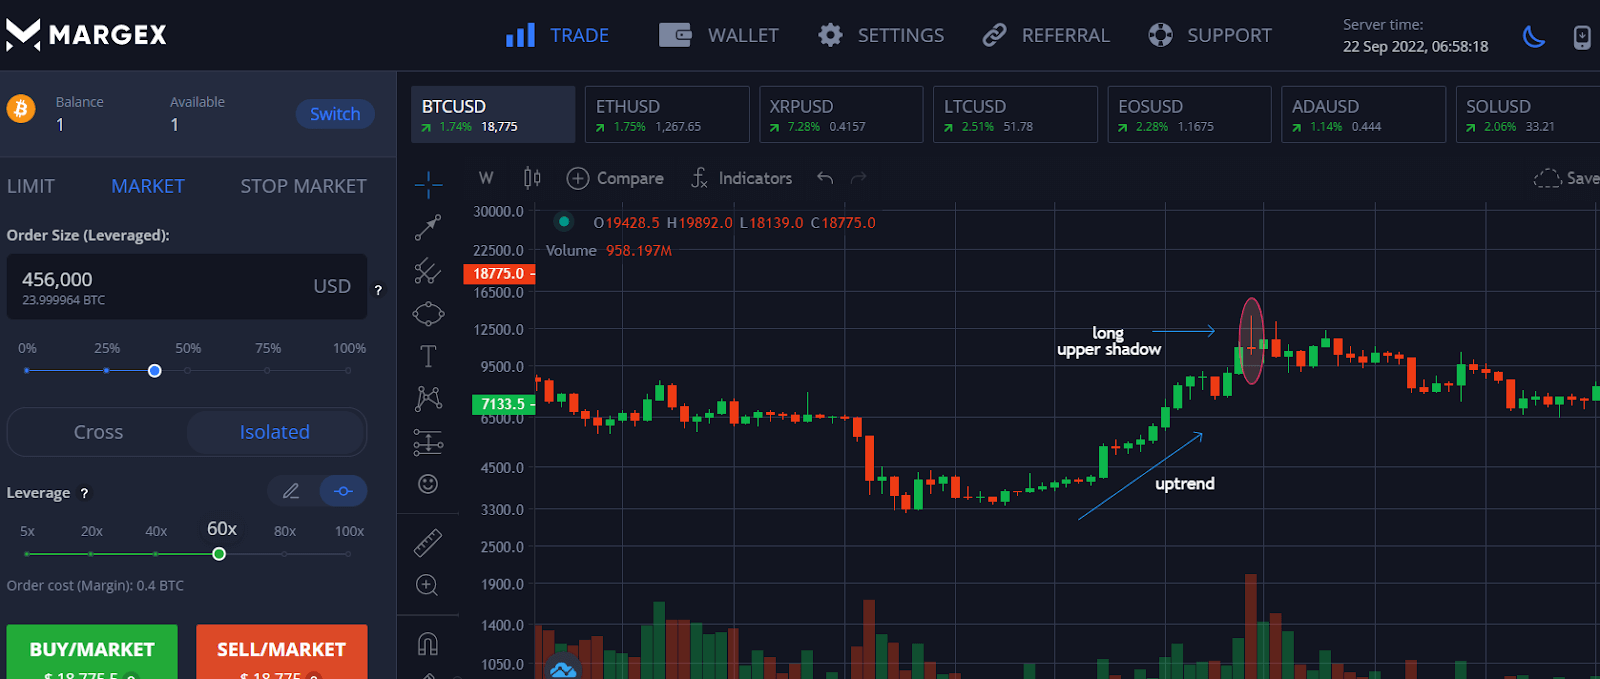
Let us now take a look at an actual gravestone doji candlestick to help with our visualization. The below diagram is a weekly chart of BTCUSD taken off the Margex trading platform which shows a gravestone doji.
First, to determine if the appearance of a gravestone doji would be bearish or bullish, we need to look at the prevailing trend. In this case, there was a prevailing strong uptrend in the price of BTCUSD, which was a sign that should a gravestone doji pattern appear at this stage, it would likely be a bearish candle that could mark a possible trend reversal.
As it turned out in this example, after a bullish rally, a gravestone doji formed at the end of June 2019. The bulls tried to take the price higher by sending the candle higher within the week, but was met with selling pressure which took the price back down with a long shadow until the low point of the week, which also corresponded with its weekly opening price, as well as closing price. This was a bearish move which signalled that this area had a strong resistance. Indeed, the price of BTCUSD started to decline and never touched the high of the bearish candlestick again.
The lack of a lower shadow and the tiny body of the gravestone doji candlestick further confirmed the bearish pattern.
In summary, below are the things to lookout for in order to spot a bearish gravestone doji.
- prevailing uptrend
- long upper shadow
- lowest price of the day, opening price and closing price are the same, or are in very close proximity with one another, causing candle to have a tiny body.
- very small, or the total lack of a lower shadow.
What Does a Dragonfly Doji Mean?
A dragonfly doji is the polar opposite of the gravestone doji and usually signals a possible reversal from bearish to bullish. It typically appears after a prolonged downtrend when prices could be oversold or near a support level.
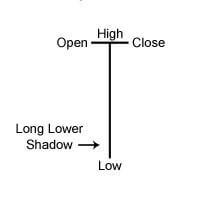
The dragonfly doji is very easy to identify because it looks exactly like the capital letter “T”, with a long lower shadow, a tiny body, with a very small or no upper shadow.
Gravestone Doji vs Dragonfly Doji
Both the gravestone and dragonfly candlestick patterns are trend reversal signals. However, while the gravestone doji is usually a bearish signal which occurs at the top of an uptrend, the dragonfly doji is a bullish pattern which occurs at the bottom of a downtrend.
This explains why the dragonfly doji candlestick looks like the upside-down version of the gravestone doji candlestick.
The bullish dragonfly doji has the following characteristics:
- prevailing downtrend
- long lower shadow
- highest price of the day, opening price and closing price are the same, or are in very close proximity with each other, resulting in a candle with a tiny body
- very small or completely no upper shadow
How to Trade With the Gravestone Doji on Margex?
As we are about to see below, the Margex platform equips its users with state of the art charting tools to help them do a gravestone doji trade, or any other crypto trade, effectively.
Margex is a crypto trading platform that has been nominated by Finance Magnates as having one of the friendliest to use UI in the industry. It has enough tools for the experienced trader, yet is easy enough to use for the beginner trader. Traders can execute both long and short positions on Margex to take advantage of all market conditions to earn profits. Furthermore, the availability of up to 100x leverage allows traders to magnify their earnings. Margex also has Unique MP Shield™, an AI-based system to protect users from unfair liquidations and wicks.
Now, let us go through the steps on how to set up an account and trade the gravestone doji at Margex.
Please note that this illustration does not constitute professional financial advice. Readers should take into account their own financial situation before beginning to trade, and should never trade more than what they can comfortably afford to lose.
Readers should also be aware that trading in financial instruments involves significant risks, and are advised to seek professional financial advice if they are unsure if they should trade.
Step 1: Open a trading account at Margex by going to its website at https://margex.com/.
Click the top right-hand corner to register for an account. After your account has been successfully opened, which takes only about 30 seconds, you may log in to your account to start trading.
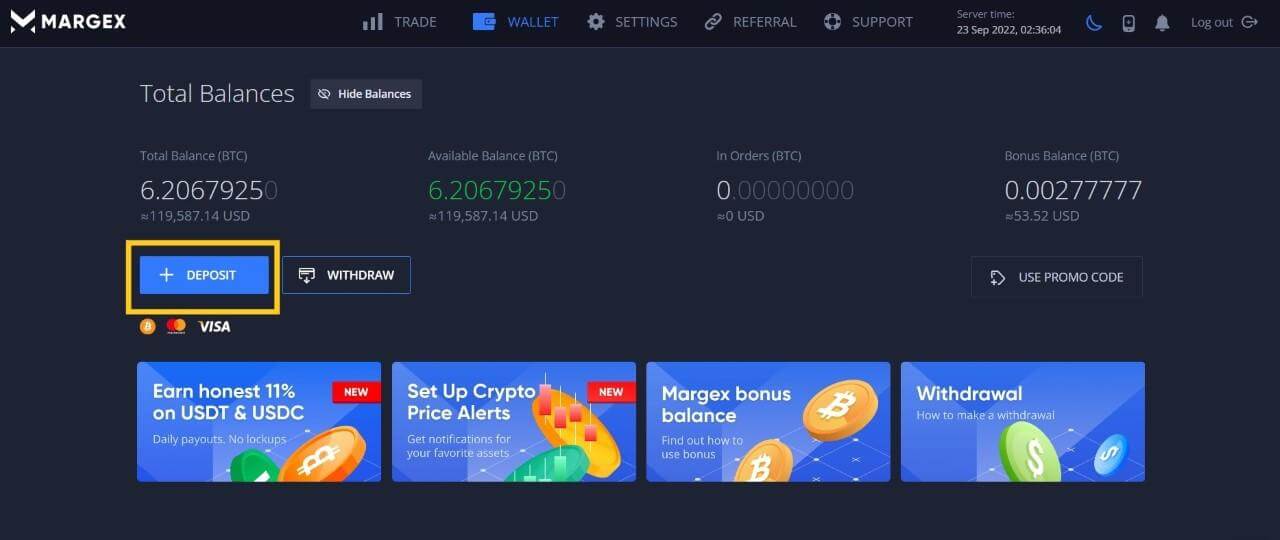
Step 2: Fund your account by clicking on the “Deposit” button under the “Wallet” tab located on the top navigation bar (yellow box as shown below). You may deposit in a variety of ways like Visa, Mastercard, or even in Bitcoin!
Step 3: On the Margex trading screen, you may freely access all the technical tools available to analyse any crypto trading pair you like. Click on the “Trade” tab on the top navigation bar and you will be able to see and use Margex’s technical chart to help you spot a gravestone doji. A gravestone doji is very easy to spot, just find an inverted letter “T” on the candlestick chart, which is the default charting module at Margex – you need not have to set any parameter.
Now, back to our BTCUSD example, we can see the gravestone doji appear on the week of 24 June 2019 after a prolonged uptrend as its price closed and open very closely to each other.
The entry area for this trade is upon the breaking of the lowest point of the gravestone doji, as indicated by the blue line in the diagram below. We need to be patient and may have to wait for a few more candles to form before entering the trade as the price may not necessarily break the lowest point at the first candle. Please only enter a short position after price breaks below the blue line.

In trading, we must always remember to place stop losses to protect our capital. In this case, the stop loss should be placed above the high of the upper shadow, as shown by the red line in the diagram above. This is because when the price breaks the highest point of the gravestone doji candlestick, the pattern is negated and traders will need to exit the position as quickly as possible so as not to get caught on the wrong side. The price breaking the highest point of the gravestone doji would mean that the uptrend has resumed and bears have failed to stage a bearish reversal. However, in our example, this did not happen and the price of BTCUSD started a period of decline, albeit after consolidating for a period of time.
Where should we take profit then? For a gravestone doji trade, the profit target should be at the nearest level of horizontal support that you can see on the chart.
Gravestone Doji Candlestick FAQ
Is a Doji Bullish or Bearish?
A doji is neutral, it is neither bullish or bearish and usually indicates indecision amongst market participants.
Can a Gravestone Doji Be Bullish?
It is possible for a gravestone doji to be bullish. This may be the case if the gravestone doji candlestick appeared after a prolonged downtrend at a strong support zone, or at very oversold conditions. The presence of a strong support after a period of decline gives further credence for this to be a bullish gravestone doji. However, a bullish gravestone doji is not as common as the bearish gravestone doji.
What Does a Doji Indicate?
A doji indicates indecision amongst market participants where the demand and supply are in balance.
What Does a Long-legged Doji Mean?
A long-legged doji appears when market participants are undecided as to the direction of an asset’s price. It means the forces of demand and supply are reaching equilibrium and the price no longer has the momentum to push in the direction it once was trending in. Thus, the appearance of a long-legged doji after a strong uptrend or downtrend is more significant as it could indicate a possible trend reversal.
However, long-legged dojis may also mark the start of a consolidation period, where the price forms more long-legged dojis or other candlestick patterns, before continuing on its prevailing trend, or breaks out into a new trend, according to the market conditions post the stage of consolidation. It is thus important to not jump into a conclusion too soon when you see a long legged doji and rashly put up a trade. Always use the help of other indicators or wait until the next candle closes to confirm the move before you execute a trade. Technical indicators like the RSI and OBV may also be useful to help determine a divergence, which often precedes a reversal.


