
The heikin ashi is a Japanese candlestick-based charting tool that is a more modulated version of the traditional candlestick charting technique. Similar to the regular candlestick charts, heikin ashi charts represent and visualize market price data. They are used to identify market trends and forecast price movements.
However, instead of showing the daily open-high-low-close (OHLC) like the standard candlestick chart, the heikin ashi chart depicts average price information that filters out unnecessary market noise to reduce their impact on price. This modulation of intraday price swings can smoothen the volatility of a price move, which helps a chartist see the underlying trend better.
Heikin Ashi Formula and Calculation
The heikin ashi chart uses different values from the traditional candle chart to depict the opening and closing prices of the period in question. The averaging of the day’s high and low prices is the main way that the heikin ashi chart differs from the standard candlestick chart.
Heikin ashi candlesticks are based on price data from the current period close-open-high-low, the current heikin ashi values, and the prior heikin ashi values.
OCHL values are derived using the heikin ashi formula below.
Calculating Heikin Ashi Candle Open Value
The formula for calculating the heikin ashi open is:
HA Open = (HA Open -1 + HA Close -1) / 2
Calculating Heikin Ashi Candle Close Value
The formula for calculating the heikin ashi close is:
HA Close = (Open0 + High0 + Low0 + Close0) / 4
Calculating Heikin Ashi Candle High Value
The formula for calculating the heikin ashi high is:
HA High = Max (High0, HA Open0, HA Close0)
Calculating Heikin Ashi Candle Low Value
The formula for calculating the heikin ashi low is:
HA Low =- Min (Low0, HA Open0, HA Close0)
Where:
HA = Heikin Ashi
-1 = Prior period figures
0 = Current period figures

Note that the heikin ashi technique can be used to depict different time frames, i.e. daily, weekly or monthly, similar to the regular candlestick. However, the other parts about the HA candle differ quite significantly from the normal candlestick.
The HA open is always the price at the midpoint of the previous bar, while the HA close is always the average price of the current bar. The HA high is the highest price amongst the current period’s high, HA open, and HA close. The HA low is the lowest price amongst the current period’s low, HA open and HA close.
Constructing the Heikin Ashi Chart
The heikin ashi chart usually uses a red candlestick to show a downtrend and a green candlestick to show an uptrend, even though some platforms may use different colors or different ways to show rise and fall in prices. Down days may be represented by filled candlesticks, while up days may be represented by empty or hollow candles, or vice versa. It is thus important to check the colors your charting platform is using.
The heikin ashi chart shows smoother directional moves with more successive bars of the same color as compared with the regular candlestick chart, which gives a trader a clearer perspective of price movements. The traditional candlestick chart changes colors too often, making it difficult for traders to identify trends and interpret where the price is going. The HA candle removes these noises and shows the same colored bars consecutively when price is trending, making it much clearer to the reader.
Heikin Ashi Indicator Signals
Heikin ashi charts reflect the prevailing trend of the market through indicator signals. There are two main variants of the heikin ashi indicator signals, namely, trend strength and trend reversal.
Trend Strength
The first major use of the heikin ashi chart is for measuring the strength of a trend. When a heikin ashi chart is showing a strong trend, a trader should stay in his trade as much as possible to maximize his profit. However, since small price corrections are not visible in the heikin ashi chart due to their smoothing effect, a trader is advised to use a trailing stop to minimize his potential losses when trading within the trend. Heikin ashi charts are particularly good for analysing the following trends in technical analysis:
Bullish trend: the presence of a lot of consecutive green candles without lower shadows is a signal for a strong uptrend.
Bearish trend: the presence of a lot of consecutive red candles without upper shadows is a signal for a strong downtrend.
Triangles: There are three types of heikin ashi triangles. These are, ascending, descending, and symmetrical.
Generally, when heikin ashi candles break above the upper boundary of a symmetrical or ascending triangle, it is a sign that the uptrend will continue.
When heikin ashi candles drop below the bottom line of a descending triangle, it is a sign the bearish trend will continue, and may even strengthen.
Trend Reversal
A trend reversal signal helps a trader determine the time to exit an already executed trend-following position and enter into a fresh new trend-following trade. By letting a trader identify a reversal signal, the heikin ashi technique is able to help traders minimize losses by getting out of a decaying trade early, as well as by profiting from a new trade. When seen with the heikin ashi technical indicator, certain chart formations are especially relevant and traders should bear them in mind. These are:
Doji candlestick: A doji is a candlestick with a small body and long wicks. Its appearance always signals a market filled with uncertainty and indecision. Hence, when it appears in the midst of a series of heikin ashi candles, it could signal a trend reversal.
Wedges: Wedges come in two forms, rising and falling. A rising wedge seen in conjunction with a heikin ashi candlestick breaking below the wedge’s lower boundary would indicate a breakdown on a bearish trend, while a falling wedge seen with a heikin ashi candlestick breaking above the wedge’s upper boundary would indicate a bullish breakout.
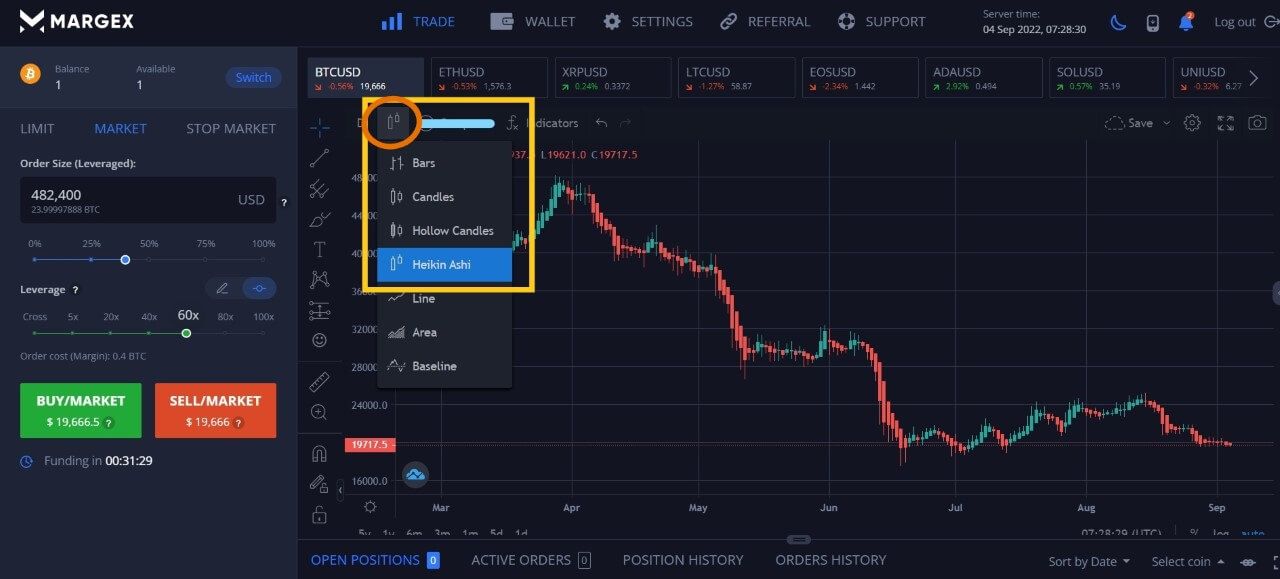
How To Trade on Heiken Ashi Candles on Margex?
Margex is an easy to use crypto trading platform that offers traders an array of useful technical charting tools, and has high leverage trading options of up to 100x to help traders maximize the potential of their trades. Users can easily utilize the free to use heikin ashi candlestick function on the technical chart provided by Margex by selecting “Heikin Ashi” on the dropdown menu on the price chart as shown below.
Heikin Ashi Strategies
After learning how to set your chart to the heikin ashi candlestick mode, now let us learn some heikin ashi trading strategies so that you can start using this new tool to help you profit from market moves.
1. The Emergence of a Strong Bullish or Bearish Trend
The most common heikin ashi strategy is to trade the trend. As we are aware by now, heikin ashi charts are very good at showing the prevailing trend, hence, using the HA indicator to spot the beginning of a strong uptrend or downtrend is a reliable strategy with a high success rate.
In this trading technique, the heikin ashi datum may even help a trader recognize a wrong trade and cut losses early. For instance, when the heikin ashi candles show a strong bullish trend, it means buying pressure is very strong. Traders that are in short positions could take it as a cue to cut their losses and even add long trades to ride the trend, while traders with long positions could increase or solidify their positions further.
2. Identify Candlesticks with No Shadows
Identifying candlesticks with no shadows is one of the most popular heikin ashi trading strategies because of its high credibility and win rate. This strategy works by identifying a high sequence of candlesticks with no wicks. The higher the number of such candles, the stronger the prevailing trend is.
Another variation of this strategy is to spot candlesticks with no shadow on one side. ie, when trying to spot a bearish trend, heikin ashi candles should have no upper shadows, while ha candles with no lower shadow would signify a bullish trend.
3. Candlesticks with Small Bodies Indicate Trend Pauses or Reversals
Lastly, the appearance of heikin ashi candles with small bodies show indecision in the market. Such short candles usually appear when market participants are indecisive and often foreshadows a trend pause or a trend reversal. Traders could open a new position in response to an ending trend when such candles appear. However, the likelihood of the trend only pausing is there; hence, a trader should wait for a confirmation sign before entering the trade, or put a stop-loss to minimize his losses in case the trade turns out to be wrong.
Benefits and Limitations of the Heikin Ashi Technique
As with any other technical indicator, the heikin ashi technique has its benefits and limitations. Let us look at them below.
Benefits
- Accessibility: The heikin ashi chart is one of the most readily available indicators that does not require any software installation and can be found on most trading platforms.
- High Chart Readability: The heikin ashi chart is easy to interpret as most traders already know how to read the candlestick classic chart. The trends on a heikin ashi chart are shown with higher visual clarity than a traditional candlestick chart, which makes HA charts much easier to read.
- Reliability: The heikin ashi chart is a very reliable indicator that provides accurate results as it is based on historical data, which has high consistency.
- Filtering of Market Noise: The heikin ashi chart filters out market noise, thus making its signals more revealing. The smoothing effect makes it easier for trend identification, allowing traders to plan their entry and exit points more efficiently.
- Ability to Combine with Other Indicators: The HA indicator can be combined with other technical indicators to give trading signals with even higher accuracy.
- Time Frame Tolerant: The heikin ashi technique works on any time frame, from hourly, daily, weekly, monthly, etc. However, the signals seen on higher time frame charts are more reliable.
Limitations
- Time Gap: The use of historical prices could cause a time lag in showing price movements.
- Lack of Price Gaps: Some traders like to use gaps to analyze the momentum of a price move to place trigger orders or stop-loss orders. The heikin ashi chart cannot show price gaps since these are being smoothed out. Traders can counter this by switching between a standard candlestick chart and a heikin ashi chart.
- No Full Price Information: The heikin ashi is an averaged version of the regular candlestick. It does not show the actual open price and close price of the asset. Hence, it may not work well for day traders or scalpers that need to see more precise price actions.
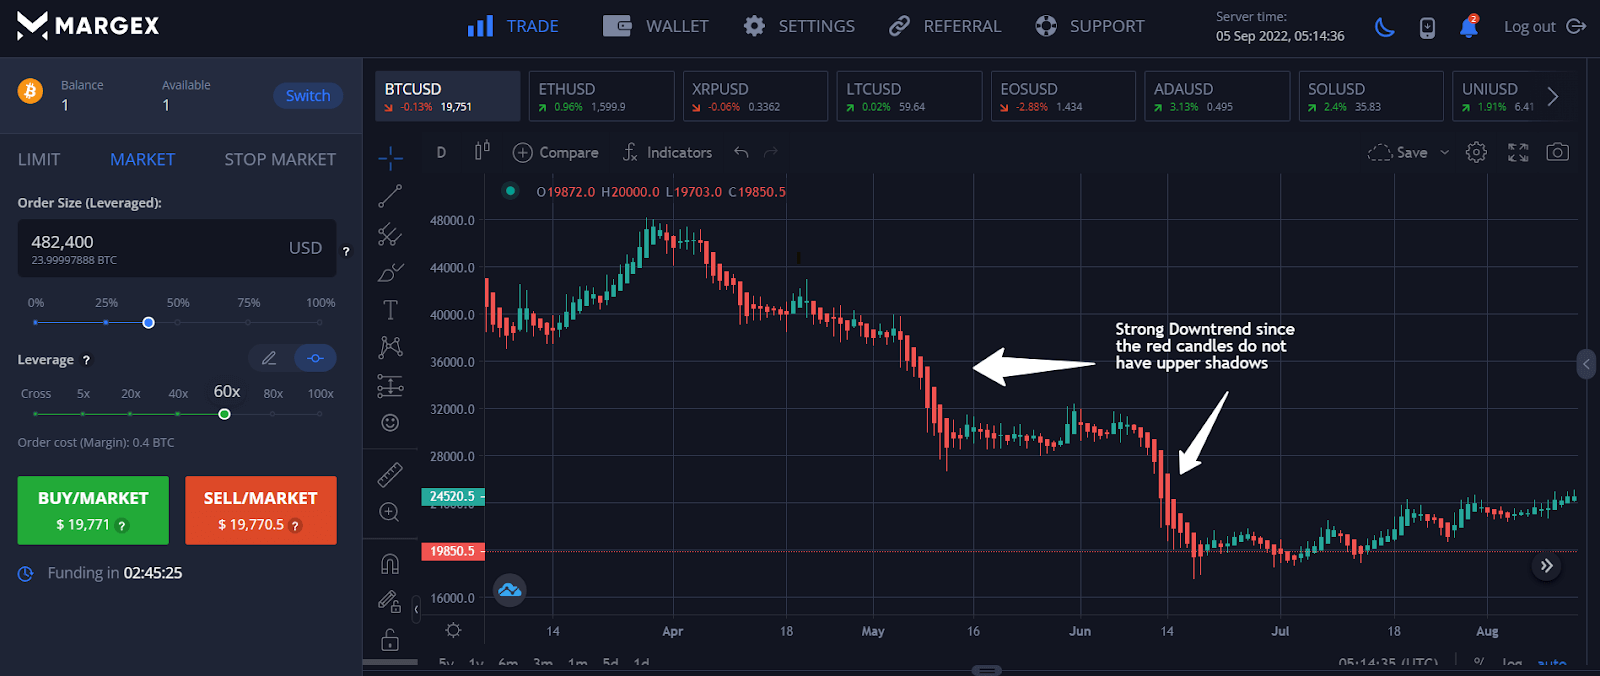
Example Using Heikin Ashi Candlesticks
Now let us see how clear heikin ashi candles show a trend by looking at an example.
In the BTCUSD example below, we can clearly see the bearish trend of BTCUSD in May and June 2022. Not only are there many successive red candles, the red candles also do not have upper shadows, implying that the bear trend is very strong. A trader could have easily shorted BTCUSD and earned a good profit using the heikin ashi indicator.
FAQ
Are Heikin Ashi Candles Better?
While heikin ashi charts are not necessarily better than regular candlestick charts, they are visually better at showing trends as their mode of deriving the ohlc prices ensures that unnecessary market noises are being filtered out.
How Do You Read Heiken Ashi Candles?
Simply open your trading platform and apply Heikin Ashi Candlesticks to your chart.
Spot a clear uptrend or a clear downtrend by watching if there is a series of successive candles in the same color and trade the trend.
Do test out your trading platform’s way of showing positive and negative HA candles when you use it for the first time as different platforms may have different ways of showing up and down days using the heikin ashi candlestick.
Are Heikin Ashi Candles Good for Day Trading?
While you can day trade using heikin ashi candlesticks, they are better suited for higher time frame trading like swing trading or trend trading. Their accuracy for day trading is reduced since they do not show precise price action like the opening and closing prices of the prior period that a day trader may need to analyse.
What Time Frame is Best for Heiken Ashi?
While heikin ashi charts work for most time frames, their signals are more accurate in higher time frame charts than on lower time frame charts.
Is Heikin Ashi Good for Scalping?
The removal of short term noises and corrections in market prices may make the heikin ashi technique not that suitable for scalping. Please refer to our strategies above to know how best to use heikin ashi charts for trading.


