
Traders who have been around from the last crypto winter of 2017 and the present winter of 2022 that has lasted for over two years and six months, respectively, in the crypto space understand how important and useful it is to acquire the skills of a technical analyst coupled with the use of technical indicators to look for opportunities that would provide good profitability when it comes to trading.
Whether you are a scalper, intra-day trader, long-term trader, or just an investor harnessing the technical skills of the financial market is a goldmine and would save you from the volatility that comes with trading in this space; above all, you will be able to preserve your capital while looking for the best trading opportunity to maximize profit.
For example, the price of Bitcoin (BTC) drop ped from a high of 69,500 in November 2021, and the price has seen a constant decline over the months with minor relief bounces, with the current value down by over 50% from its all-time high (ATH).
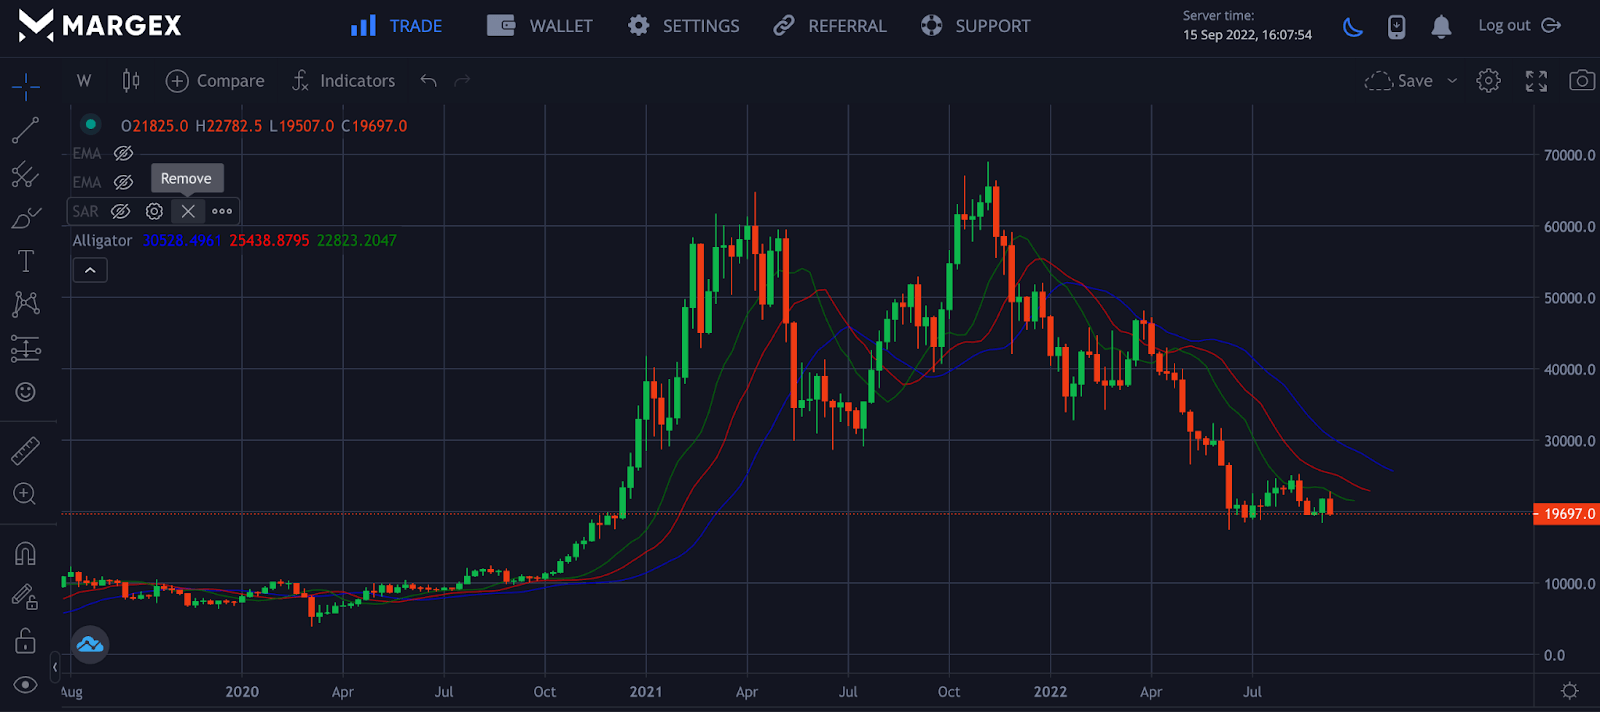
The chart shows the BTCUSD pair with a drop of over 70% from its all-time high, highlighting the need to learn how to analyze the financial market with indicators and technical analysis skills to predict the volatility and price action that comes with trading these crypto assets for a better return on investment (ROI).
With the use of the indicator William indicator above, a trader would have still profited from trading the downside of these markets when the price broke below the William alligator indicator after a crossover of the moving averages. The price retested the William Alligator for confirmation before a downtrend.
Apart from the use of technical analysis strategies like chart patterns, indicators such as the Relative Strength Index (RSI), simple moving averages (SMA), Moving average convergence divergence (MACD), and of course, the William Alligator indicator contributes to the huge success and profitability of a trader.
Most traders in the crypto, forex, and stock markets use the William Alligator indicator to time their entries, exits, and trend directions, as well as to use dynamic support and resistance levels based on timeframe and trader type.
This guide focuses on the William Alligator indicator, how to use it as a strategy for short-term and long-term trends, how to time your entries and exits, and how to use dynamic support and resistance to increase your chances of profit success.
What Is The Williams Alligator Indicator?
The William Alligator indicator is a trending indicator made up of three smooth moving average lines; jaw, lip, and teeth, making up what is called the mouth of the William Alligator for identifying and trading trends by crypto or stock traders. Due to the simplicity of this indicator focused on the trending market, even beginner traders can trade and make a considerable amount of profit in the market using this indicator.
Only professional traders can trade in a sideways or choppy market and still be profitable as the direction of market movement is challenging to predict, but this is not always the case as the volatility and price actions of a ranging market make trading even more difficult with the best technical tools and strategies.
Forex trader Bill William birthed the William Alligator indicator to help retail traders to make consistent profits from a trend of 15-30% of the time while 70-85% of the market is in a ranging mode or sideways.
This indicator is made up of three moving averages. Based on the three simple moving averages, they are the jaw (blue line), teeth (red line), and lips (green line). When these three moving averages of the William Alligator indicator are close to each other, the indicator is “Asleep,” as the price tends to range at the point, and there is no defined trend.
When the three moving averages are far away from each other or are apart, it is said that the William Alligator indicator is “Awake,” signaling a trend is in place. A trader can go either long or short.
For better profitability of this trading strategy, it is best to trade this indicator in a trending market (When William Alligator is awake) and not in a sideways market ( William Alligator is asleep).
During a trend, the three moving averages for the William Alligator indicator will act as dynamic support and resistance for prices. When prices are above the three lines, the lines act as dynamic support whale the lines act as dynamic resistance when the price trades below the three moving averages.
What Inspired The “Alligator” Name?
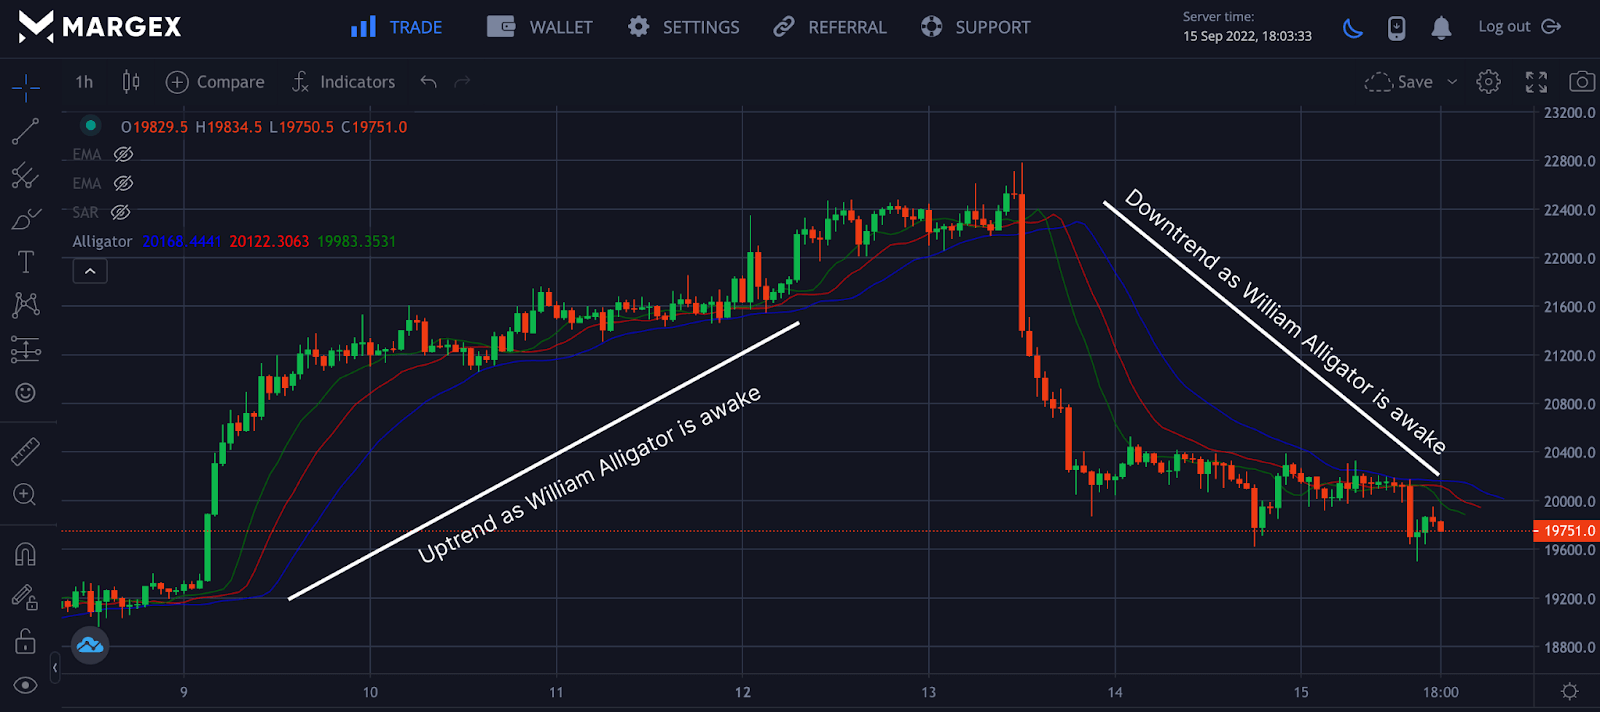
The Alligator indicator got its name due to the expansion and contraction of its mouth, also known as the three moving averages. In a trending market, the alligator opens its mouth to eat the candles; it is said that the market is in an uptrend or downtrend, leaving the Alligator awake. The mouth contracts in a sideways market, and the Alligator is said to be asleep.
A buy signal is generated in a trending market when there is a crossover, the lip (green line) is above the red and blue line, and a sell signal is generated when there is a crossover, and the jaw (blue line) is above the red and green line.
A visual representation of the buy and sell signal can be seen above in the chart.
Who Invented The Williams Alligator?
Bill Williams created the William Alligator Indicator to create more awareness for traders as regards trading in a trending market with ease of entry and exits for trades. Williams is also the creator of indicators like Williams Fractal, Accelerator/Decelerator Oscillators, and others. With vast experience trading in the forex market, he could come up with this indicator as they are trend-based indicators built on the psychology of humans.
What Is The Williams Alligator Formula?
The William Alligator formula is based on the simple moving averages distributed over a certain period using smoothening moves of 3-8 bars. The formula for a simple moving average is;
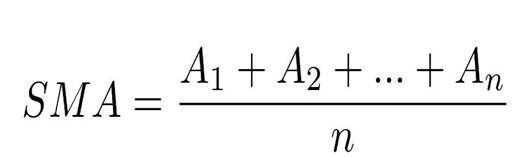
A = Sum of all closed prices over a period
n = Number of closed prices
Jaw (Blue Line): 13-bar SMMA with 8-bar smoothing
Teeth (Red Line): 8-bar SMNA with 5-bar smoothing
Lip (Green Line): 5-bar SMNA with 3-bar smoothing
The subsequent smoothening for future predictions is based on this formula:
SMA = SMAA (i – 1) x N
SMAA (i) = (Previous sum – SMAA (i-1) + Closing Average (i) ) / n.
How The Williams Alligator Indicator Works
As a trend-following indicator, the William Alligator indicator is made up of three lines: the lip, teeth, and jaw. The lip is the short and fastest moving average among the three, so it reacts better and faster to price changes than the other two.
The jaw, lip, and teeth play a key role in the Alligator indicator to determine trends. When the three moving averages are close to or intertwined, the Alligator Indicator has closed its mouth with prices ranging. Suppose the three moving averages are far apart with a crossover confirmation. In that case, the Alligator Indicator is said to awake, and the mouth is opened as a trend is about to start.
How To Read Williams Alligator?
The William Alligator indicator is one of the simplest tools employed by traders to trade a trending market. The Indicator works based on two strategies; in a ranging market, the Alligator indicator sleeps or closes its mouth, but in a trending market, the Alligator opens its mouth and is also said to be awake to feed.
- Sleeping: William Alligator closes its mouth in a sideways market and the three moving averages are seen close to each other.
- Awake: William Alligator opens its mouth in a trending market be it uptrend or downtrend.
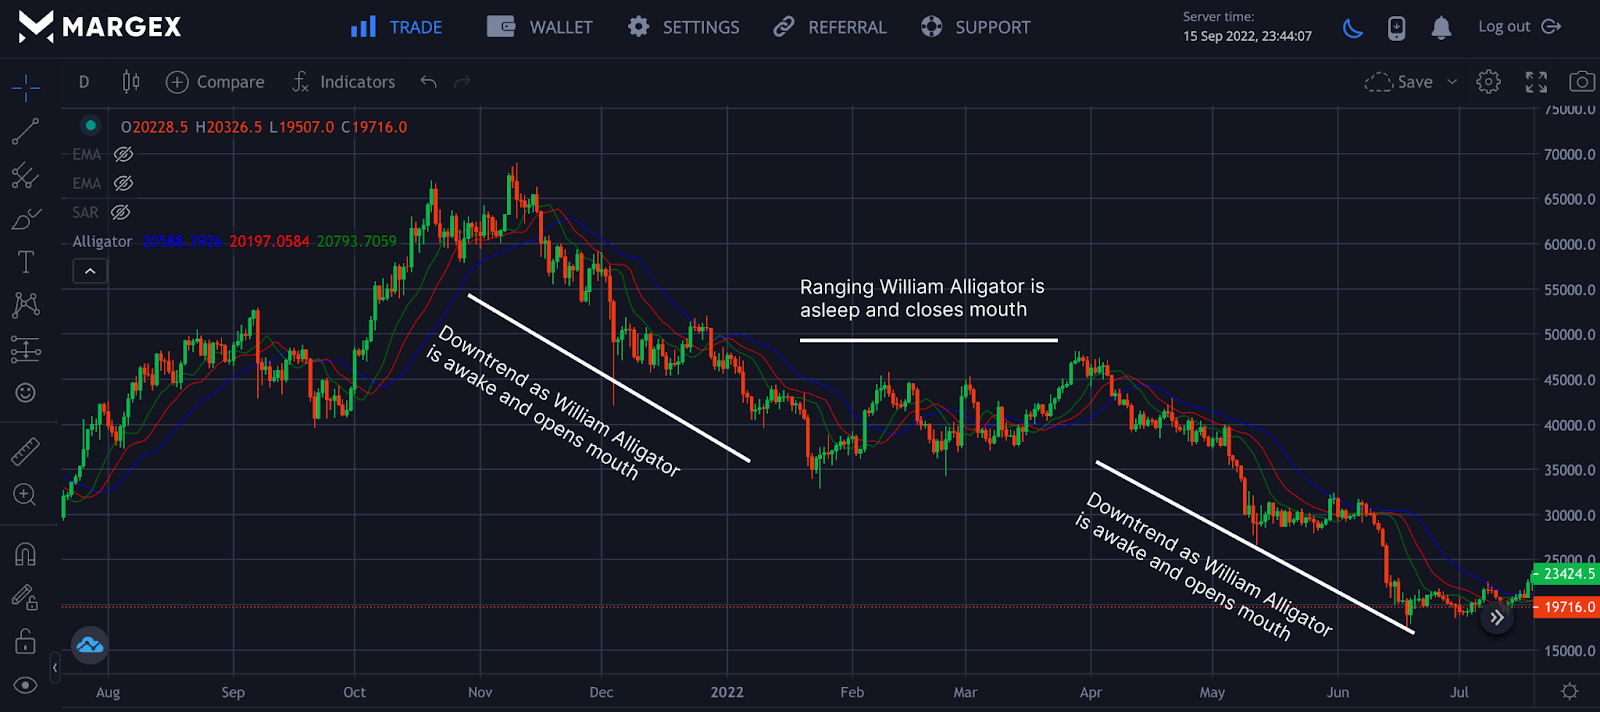
Important Visualisation
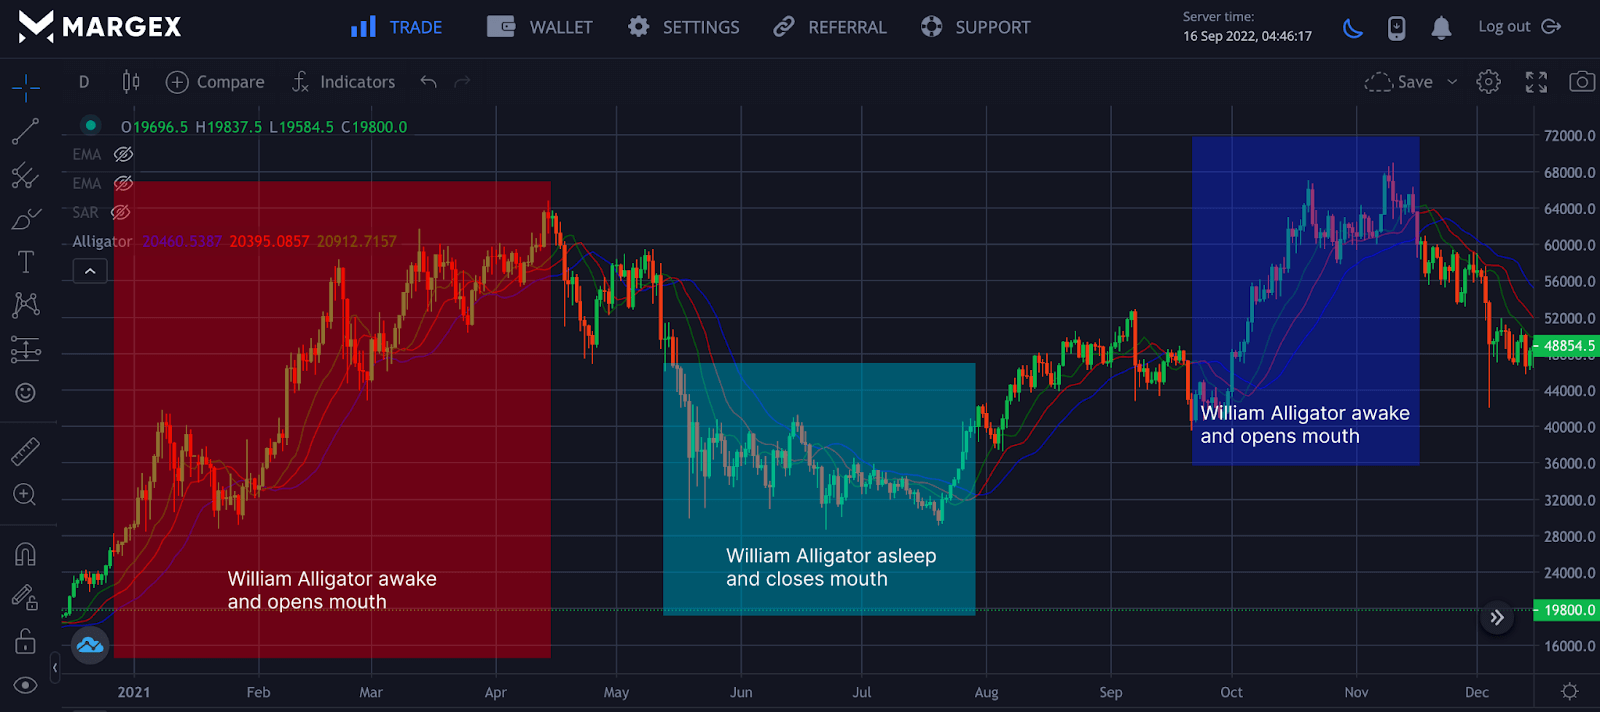
The image at the top visually represents how the William Alligator indicator works. The red and blues regions show the Alligator awake as the moving averages are far apart with an uptrend.
The green region shows the Alligator indicator asleep as the moving averages a close to each other as the price continues to move in a range.
How To Trade Crypto Using The Alligator Indicator On Margex
Margex is a Bitcoin-based derivatives exchange that gives crypto traders the unique opportunity to trade various crypto assets with up to 100x leverage while simultaneously staking the traded token for up to 13% APY returns.
The Margex exchange is well-known for its excellent user interface, which makes trading simple even for novices. Some of its built-in features are intended to assist traders in becoming more profitable.
With a unique feature of trading and staking the same crypto assets, Margex helps traders and investors to become more profitable, allowing you to earn passive income despite how volatile trading can be. Margex uses an automated system to immediately credit daily rewards to your staking account.
To have complete access to the Margex platform as a trader, you must register as a new user or login to gain access to these features, including robust technical analysis tools built with real-time prices to help you make money trading.
Let us discuss using the William Alligator Indicator on the Margex platform.
Lack Of A Market Trend
Once you can access the Margex platform, head over to trade and indicators to add the William Alligator Indicator to your chart setup to enable its usage, the William Alligator indicator has a default value which still works perfectly while trading depending on the timeframe you wish to trade. We will use the daily (1D) timeframe and the BTCUSD pair.
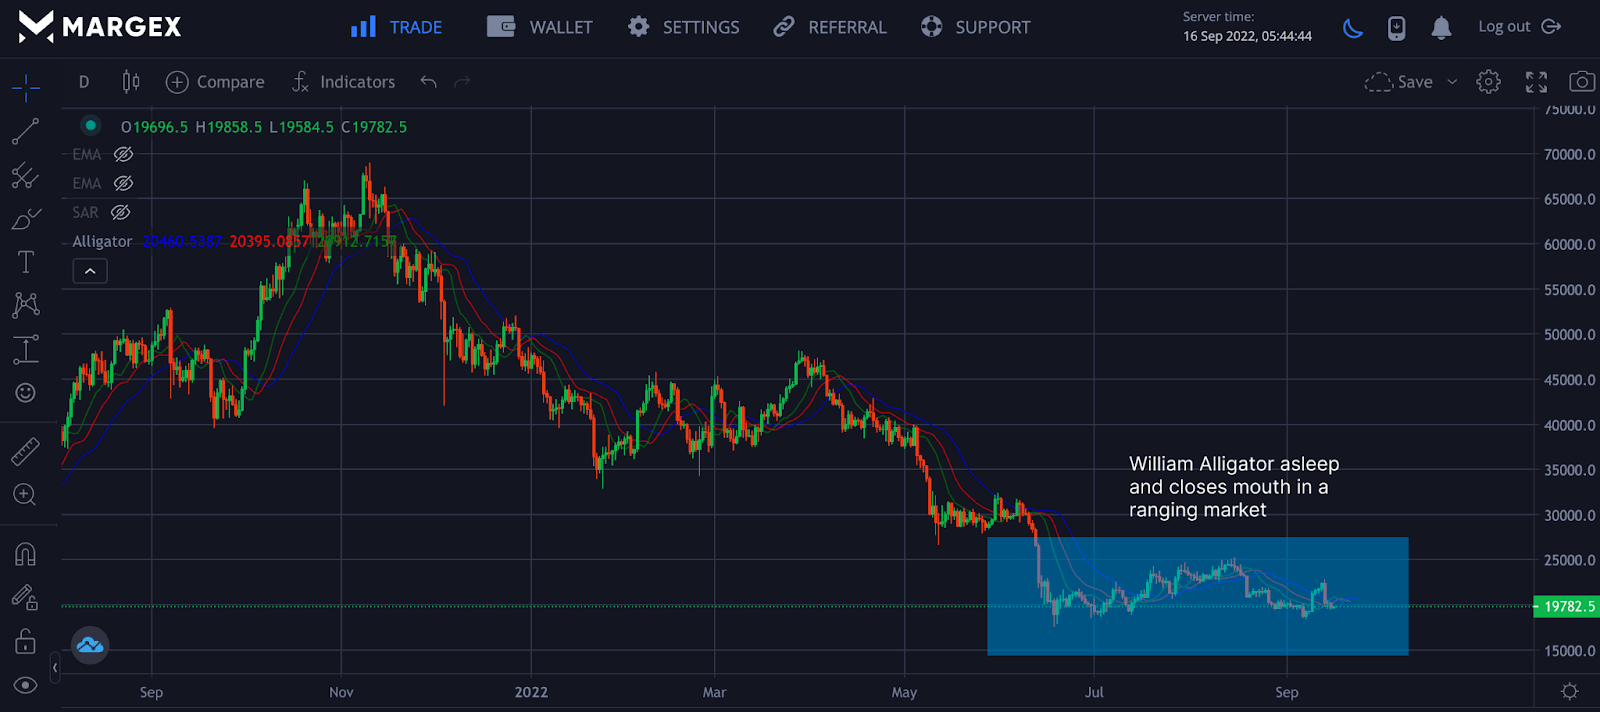
In a ranging market with no trend formation, as seen in the blue highlight, the William Alligator indicator is said to be asleep as the moving averages intertwined. The Indicator works best in a trending market; it would be wise for a trader to avoid trading in such a market as the Indicator would show false signals.
The Formation Of A Trend
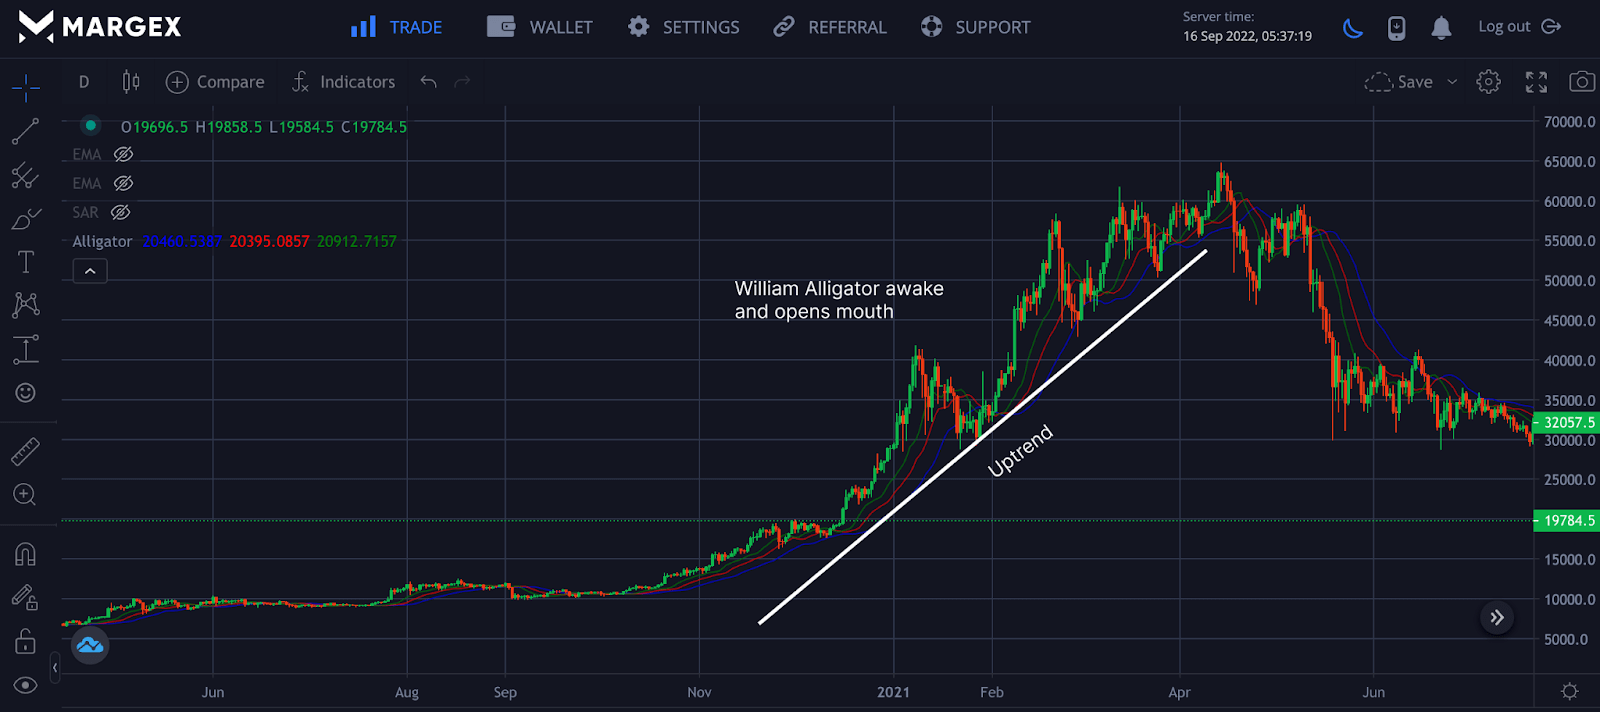
In an uptrend market, the William Alligator is said to be awake and opens its mouth. The three moving averages are far apart as a clear uptrend. A trader who spots this uptrend on a daily basis for a BTCUSD pair can open a long position while having the moving averages act as dynamic supports.
A crossover of the moving averages activates a sell position as this cross means a potential trend change.
Trend Direction
A trend is formed with the William Alligator Indicator when the three moving averages are parallel. For an uptrend, the green line would be above the blue and red lines, while for a downtrend, the blue line would be above the red and green lines.
It would be best if you always used stop losses while trading to minimize the risk of trading while maximizing profit.
Example Of The Williams Alligator Indicator In Crypto
The William Alligator indicator is used for trading crypto assets to increase the probability of making better-timed entries and profitability; using the Alligator indicator with other trading strategies is the best option so that the indicator is not traded in isolation.
For A Long Position
You need to pick your preferred trading pair you wish to trade on the Margex platform, then confirm with other strategies that there could be a reversal or uptrend formation. Check your Alligator indicator for three parallel moving averages sloping upwards. When prices close above the moving averages, you can open a long position with a stop-loss set of a few distances you have selected to minimize losses.
For A Short Position
Confirm with other strategies that there could be a reversal or downtrend formation. Check your Alligator indicator for three parallel moving averages sloping downwards. When prices close below the moving averages, you can open a short position with a stop-loss set a few distances.
Alligator Trading Strategy Summed Up
The William Alligator indicator is a trend-following indicator and works best during a trending market. It comprises three simple moving averages: lip, teeth, and jaw. When the moving averages are apart and parallel, this indicates a trend with an upward or downward trend, while there is no trend formation when the moving averages are intertwined.


