
Technical analysis of the financial market presents traders and investors so many opportunities as they seek to make money off the cryptocurrency, indices, forex, and stock markets. To be very profitable as a trader and investor in the financial market requires so much effort, dedication, and constant practice, and of course, psychological know-how is not exempt.
Newbies, advanced traders, and even investors are always looking for the most successful strategies, technical tools, and indicators to become profitable by maximizing profit and minimizing risk exposures or carrying out the best measures.
Selecting the best strategy that works sometimes might not be the case due to market volatility, and a particular strategy that works for a trader might not work for another. The trader needs to craft a working strategy, which involves a good knowledge of technical analysis, identifying chart patterns and trends, using indicators, and combining different tools and strategies. Knowing when to use a particular technical tool and pattern becomes an issue for many traders.
Even as skilled and advanced traders, we sometimes wish to know when an asset has topped out or bottomed out but is achieved with the application of bearish chart patterns.
The rounding top chart pattern is one of the many technical analysis chart patterns for determining a change in the trend we will focus on in this guide.
A rounding top chart pattern is an analytical tool that can be effective if properly utilized and applied as a strategy while trading on the financial markets.
What Is Technical Analysis And Why Is It Important To Learn This Skill
Chart patterns, price actions, oscillators, and others are what you have been hearing among traders, and some know these tools but have a vague idea of their usage.
Technical analysis is a tool employed to help forecast the price movement of particular assets while executing your strategies will improve your profitability and return on investment (ROI)
Crypto chart patterns and other trading tools are what technical analysts use to determine an asset’s current trend, strength, support, and resistance. With this information and ideas, traders and investors can strategically build a trading system that works based on their personality.
Sometimes, technical analysis can be downplayed by many as the idea of forecasting the assets of the financial market sounds unreal and not achievable. As the crypto space evolves, there have become more sophisticated and better ways of predicting the potential move of an asset, and it involves determining the market trend, either bullish or bearish.
Therefore, not only can technical analysis make you money, it can help you to keep more of your profits, too!
Market Cycles: Key To Maximum Return
Good knowledge of the crypto market is an arsenal that can never be written off, considering how volatile the crypto and other financial markets can be. One way to understand and position yourself as a trader or investor is to understand that financial markets experience market cycles.
The market cycles in the financial industry, including crypto, are divided into four phases: the accumulation phase, the distribution phase, the advancing phase, and the declining phase.
Most traders fail to acknowledge the phases in the market, thereby managing risk and getting the best results out of the market.
Accumulation Phase
This phase occurs when the market is at its low or has bottomed. This stage is sometimes referred to as the innovative or building stage; traders, investors, and major players in the crypto space seek to buy and figure out the best project to make a very attractive return on investment when the market becomes bullish again. Advanced traders in this stage look at the worst-case scenario; crypto assets are at a discount, and planning ahead of the market is the only way out.
This phase of trading is characterized by the following;
- It usually happens after prices have fallen for at least 6 months.
- It can last for months or even years.
- It appears to be a lengthy period of consolidation during a downtrend.
- Price is contained within a range because bulls and bears are in balance.
- The number of up days versus down days is roughly equal.
- Following a price decline, the 200-day moving average tends to flatten out.
- Volatility is typically low due to a lack of interest.
Distribution Phase
Sellers are more dominant in this market phase, thereby turning the market’s bullish sentiment into mixed signals as prices stay locked in a range for a few weeks or months.
When this phase ends, the market reverses direction; a classic example was the drop of Bitcoin (BTC) from $69,200 to the present value after a head and shoulder pattern. This phase could turn bullish or bearish, depending on the pattern at the end of this phase.
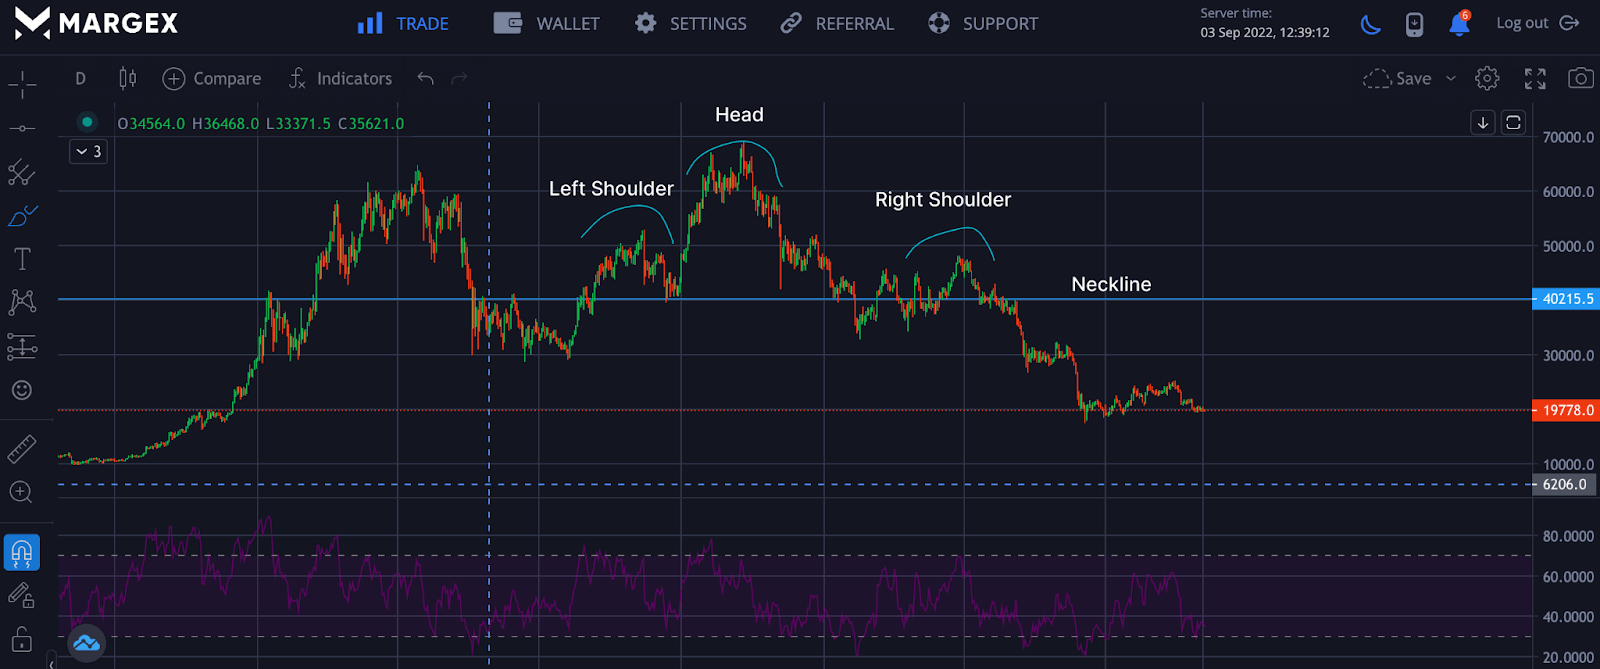
After formation completion of the right shoulder for the head and shoulder pattern, we saw a sharp decline as the neckline of the head and shoulder pattern was broken.
Here are the characteristics of the distribution phase;
- It usually happens after prices have risen for at least 6 months.
- It appears to be a lengthy period of consolidation during an uptrend.
- Price is contained within a range because bulls and bears are in balance.
- The number of up days versus down days is roughly equal.
- Price tends to oscillate around the 200-day moving average.
- Volatility is typically high because it has captured the attention of the majority of traders.
Advancing Phase Or Uptrend
This stage of the market is categorized with prices going higher and creating swing highs, many want to get involved and avoid the fear and greed of missing out, and they want to jump on the new trending thing; as a result, this changes the market sentiments to bullish or euphoria. This phase is characterized by;
- It usually happens after the price has broken out of the accumulation phase.
- It can last for months or even years.
- Price rises in a series of higher highs and lower lows.
- Over time, the price has risen.
- There are more good days than bad days.
- Long-term moving averages are higher than short-term moving averages (e.g. 50 above 200-day ma)
- Due to strong interest, volatility tends to be high at the late stage of the advancing phase.
Declining Phase Or Downtrend
The last phase is usually the most painful and not the best for most crypto traders and investors. Most assets lose value and fall way below their initial value, which could lead to capitulation due to massive sell-offs for prices. This market phase births legends and billions as assets are bought up at low prices.
Below is a pictorial demonstration of the various phases.
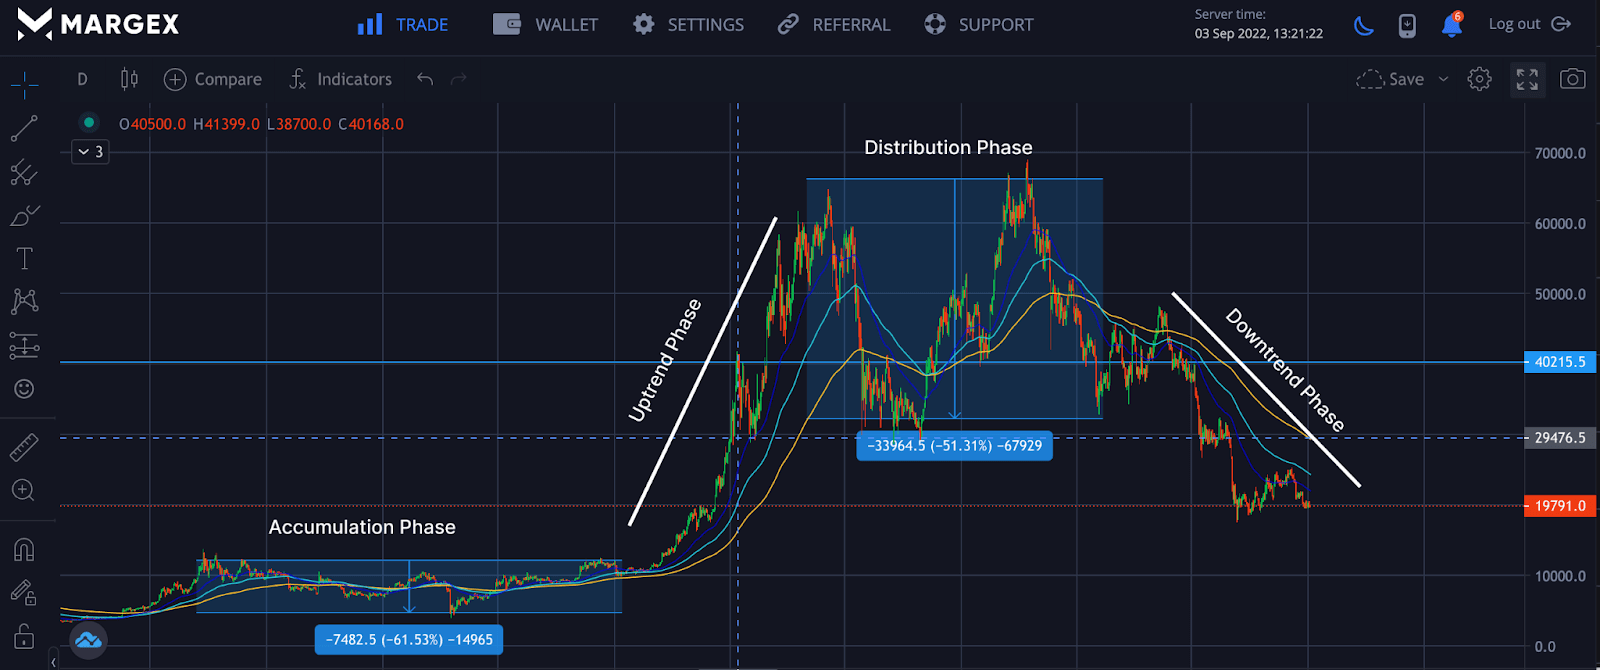
A good understanding of the market cycles would help you identify possible tools or technical analyses to adopt to get the most out of the market. We consider strong bearish pattern traders can look out for to maintain proper risk management and preserve their capital. One of that patterns is the rounding top bottom.
What Is A Rounding Top?
The rounding top is used in the technical analysis of assets to forecast a possible downtrend or an end of an uptrend that has lasted for some time. The rounding top consists of a round top that looks like an inverted “U” shape and a neckline that supports the price from falling below. A break in the neckline price confirmed a downtrend and considered this formation complete for a short position or to open a short leverage position.
Confirming the rounding top allows traders to execute a short position and for traders holding a long position to exercise extreme caution.
What Is Rounding Bottom Pattern?
The rounding top pattern is similar to the inverted rounded bottom pattern, also called the inverse saucer pattern. It has an inverted “U” shape and may sometimes occur with a double top pattern or triple top pattern, and all of these patterns are associated with a potential downtrend. Identifying these trends or patterns in the market helps the trader to make calculated decisions as they warn of a change in trend from an upward trending price to a potential downward price sentiment.
Identifying this change in pattern benefits the trader in the sense that they protect themselves from buying or going long in a downtrend or an unfavorable market and strategize to invest such money into selling short or managing risk according to a long position.
The rounding top pattern is made up of three main parts:
- A rounded shape in which prices trend higher, then taper off and trend lower.
- An inverted volume pattern (high on either end and low in the middle).
- The price level of support is discovered at the bottom of the pattern.

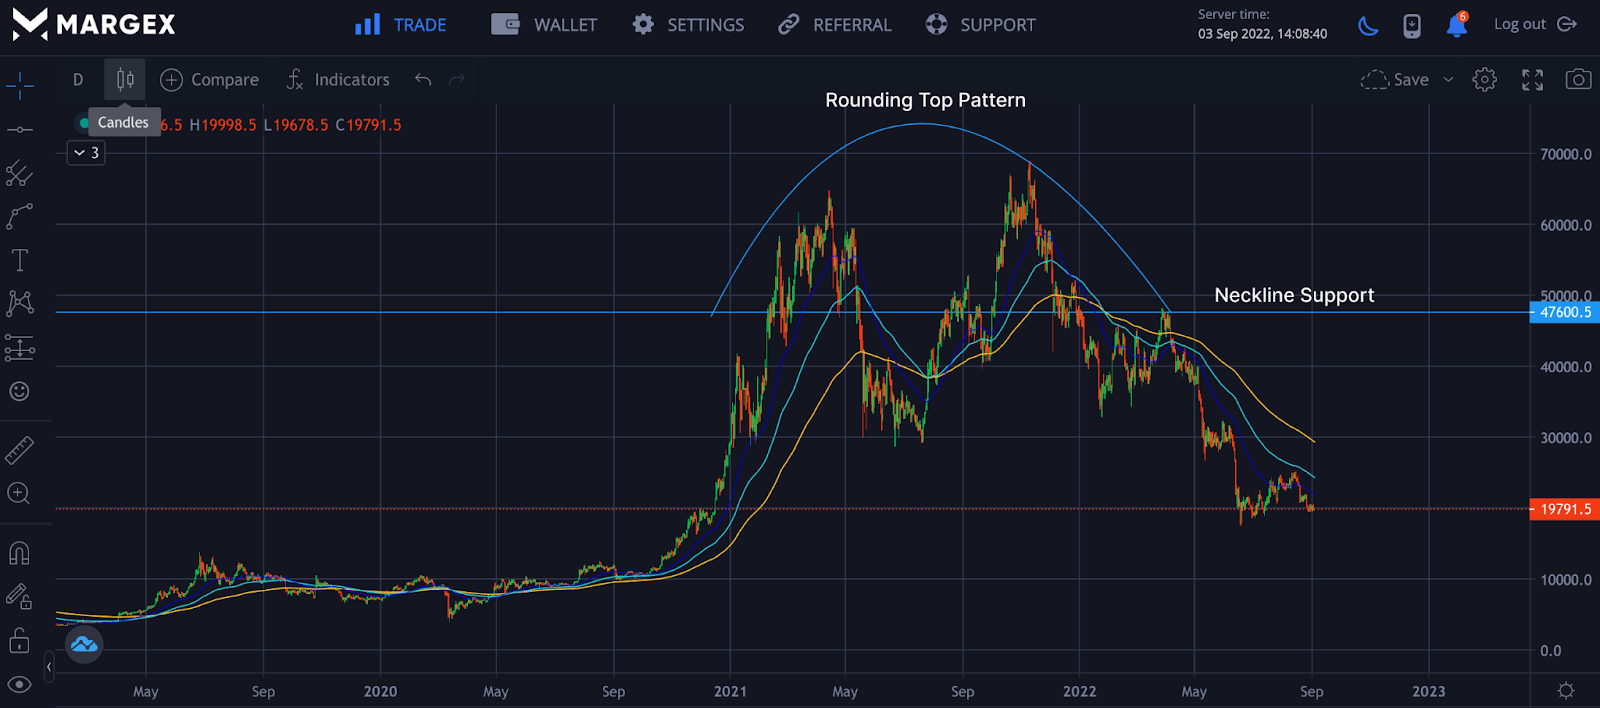
The image above shows a rounding top pattern with a double top pattern embedded inside the inverted “U” shape or inverted saucer. Another component is the neckline support, which confirms the rounding top pattern on a successful break.
Example Of A Rounding Top (Screens From Margex)
Margex, a Bitcoin-based derivatives exchange, allows cryptocurrency traders and investors to trade a wide range of crypto assets with up to 100x leverage.
The Margex exchange is well-known for its built-in features designed to assist traders in becoming more profitable.
- The most user-friendly user interface (UI) exchange available, with cross-margin trading functionality.
- Collateral deposits include BTC, USDT erc20, USDT trc20, ETH, USDC, DAI, USDP, Tron, and WBTC. Without exchanging coins, you can trade any trading pair against any collateral.
The most interesting part, Margex offers an innovative feature for traders and investors to trade while staking, which allows you to earn passive income despite how volatile trading can be. There are no lockups to assets and rewards are paid daily into your staking balance through an automated means.
If you own a Margex account, you can access these unique features and their technical analysis tools, which are designed with real-time prices to help you make money trading.
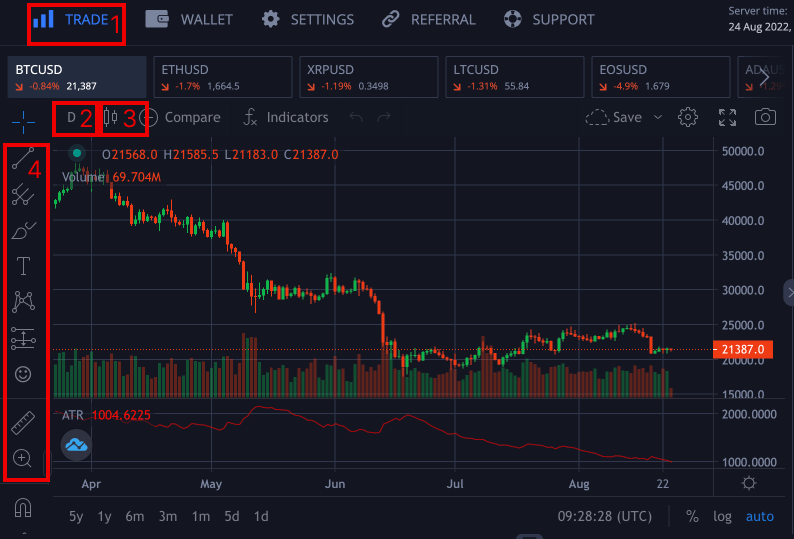
From the image above, basic information on using the Margex platform would help you jump on the main task of identifying the rounding top in no time.
- Trade: The trading interface on Margex gives you access to all technical analysis tools you want to use for your trade forecast. All you need do is click on the tool you wish to use.
- Timeframe: The timeframe helps traders adjust the market timing due to volatility and price actions. Trading on a high timeframe reduces the psychological stress in a low timeframe and results from the market’s volatility.
- Candlestick: Clicking on the labeled part 3 will help change the default settings of the line chart to the candlesticks chart for easy identification of chart patterns.
- Toolbar: The toolbar gives traders access to choose whichever tool they wish to use to analyze your chart.

Here is an example of rounding top patterns from the Margex platform using the free tools available to draw and identify these patterns. Trading on a daily timeframe enables traders to easily identify these patterns—a step-by-step guide on identifying rounding top.
- Identify a bullish trend: The first step is to identify an uptrend to assist you in determining the rounding top. An uptrend is a series of swing highs.
- Draw the rounding top: The rounding top pattern is easy to find as it is very glaring to the eyes. A rounding top pattern sometimes might be formed due to a double top or triple top pattern.
- Identify your neckline support: The neckline of a rounding top pattern is also likened to the support holding off prices from going lower. If the neckline is broken, it confirms the shift in trend from uptrend to downtrend, and traders could look to open a short position.
How To Trade The Rounding Top Pattern On Margex
Trading the rounding top pattern on Margex, it is assumed you have a good understanding of technical analysis as this will help you to identify this pattern and open a trade based on the trend you have perceived it will go.
Trading on higher timeframes, such as the daily timeframe, filters the market’s volatility and price actions, allowing traders to spot patterns that would increase their profitability.
It is essential to know that the rounding top could be made up of a double top like the image we have or a triple top pattern with the rounding top pattern also made up of the neckline support, which validates the pattern.
When the neckline support is broken for the rounding top pattern, it is key for a trader to wait for a retest of the neckline and enters the trade on a rejection from the neckline.
From the image, the price of BTCUSD was rejected from the neckline allowing the price to start a downward trend.
A trader can take a short or leverage short position on a successful retest and price breakdown.
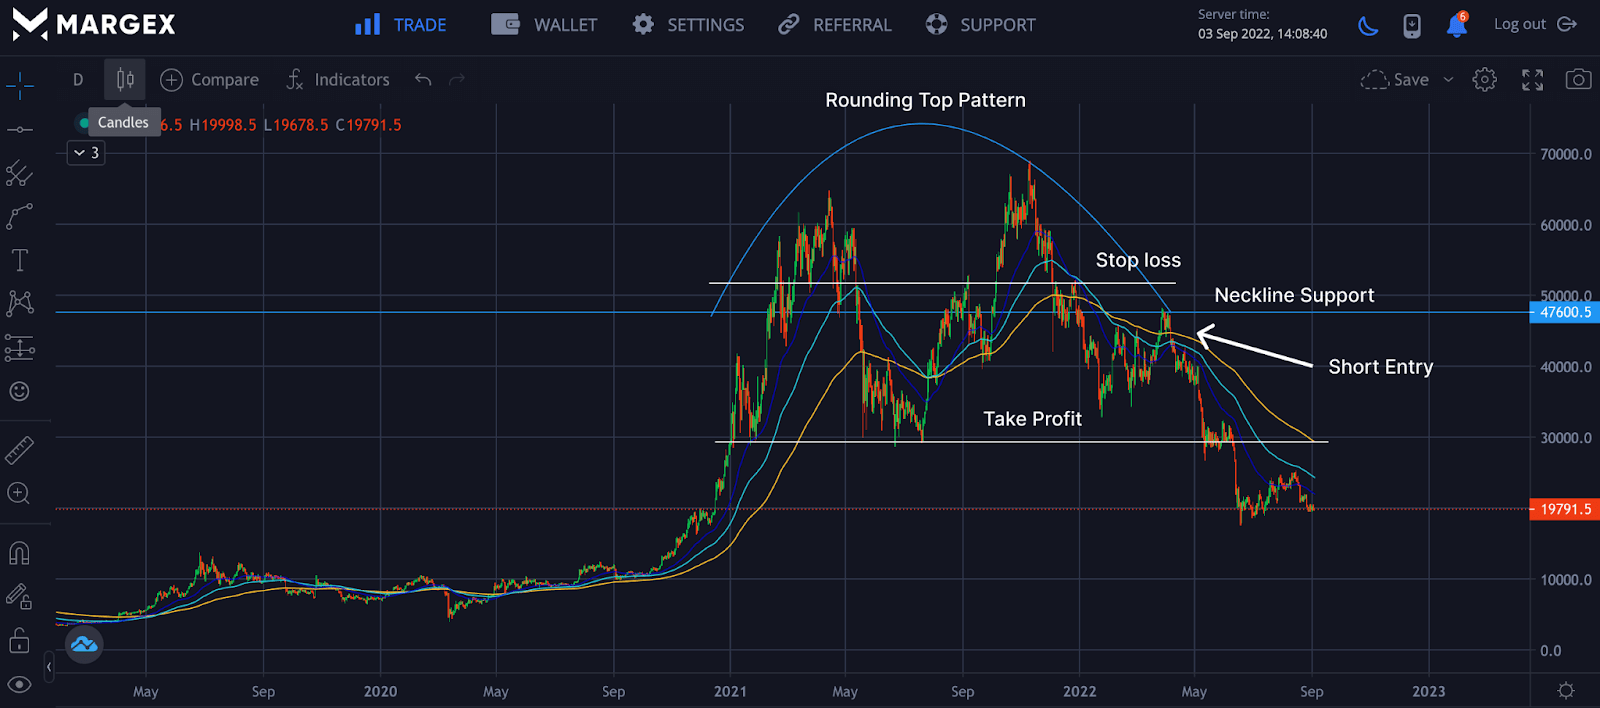
Stop loss is set a few distances from the neckline support, and profit taking should be based on the next support to avoid greed. Trading the rounding top pattern is intuitive and straightforward, so it is with all other bearish patterns. Here is how to trade rounding top pattern;
- Entry: Entering a trade when a rounding top has been identified is pretty easy; all you need to do as a trader is to identify the pattern, draw your neckline, and enter your short position on a neckline retest.
- Stop loss: Set your stop loss a few distances from the neckline to avoid being stop-hunted.
- Take profit: The pattern’s height could be the profit margin’s extent; this is measured from the neckline to the highs of the candlesticks. To be safe, your take profit could be on the next support region.
Price Forecast After A Rounding Top
Chart patterns in technical analysis are tested, and successful trading patterns have worked countlessly to predict the price of assets. The rounding top pattern gives traders the next move by an investor as a change in trend becomes more imminent. Sometimes the pattern is not completed as prices bounce from the neckline and begins to increase; as a trader, you need to wait for a break and retest the neckline to confirm this downtrend.
Relationship To The Double Top
A rounding top pattern would not always lead to a reversal, and in this case, we would expect the price to back to its previous highs where it was faced by resistance. There is a high chance it forms a double top that looks like a “U” shape. In this case, investors and traders would feel the price of assets would remain in this region of peak values.
This kind of pattern is highly bearish as buyers have tried twice and failed to break these regions to push prices to higher prices based on their expectations. Double top and rounding top patterns look similar in that investors hope to push price but fail to lead to a bearish change in trend.
FAQ
There are numerous unanswered questions regarding trading rounding top chart patterns and how to employ them. This section of the article is dedicated to answering the questions you have.
Is Rounding Top Pattern More Effective Than Double Top Pattern?
They both are used for the same purpose: identifying a potential price change from bullish to bearish, managing a long position, and entering a short position as soon as these patterns are validated.
Are Higher Timeframes Better For Trading Rounding Top Pattern?
Trading on a lower timeframe can be a challenge to find rounding top patterns and other bearish patterns; it is advisable to trade with a high timeframe of one day (1D). This will help you to spot these patterns with ease.


