
Many traders burn their fingers because they enter the crypto market without the necessary knowledge. What should one know before trading cryptocurrencies? Some people never ask themselves this question before they start. Unfortunately, due to the high levels of volatility in the crypto market, such traders lose their hard-earned money.
However, there are tools to help you identify and make the most of crypto market opportunities. These tools come in the form of indicators, and they are quite numerous. As the name suggests, indicators show future trends. How is this possible? We’ll get to that in a moment.
For one to know what is going to happen there must be analysis. There are different kinds of analysis, but this article looks at the use of technical analysis indicators. By closely monitoring historical price movement, these indicators could predict future price action. In this article, we shall have an extensive look into some of those tools. Now comes the big question, “What are the best indicators for crypto trading?
What are the Best Indicators for Crypto Trading?
So how does a trader figure out what indicator to use? This article provides a guide to the best indicators for cryptocurrency trading. Before we move on to these indicators, it is important to note one factor that influences their use. The trader’s trading habits have a huge impact on the effectiveness of the indicators. For example, a trader who trades during the day will mainly benefit from indicators that react quickly to market changes. On the other hand, a swing trader will need to use slower moving indicators.
Which are the best indicators for crypto trading? Moving Averages (MA), Moving Average Convergence / Divergence (MACD), Relative Strength Index (RSI), Stochastic Oscillator (SO), Bollinger Bands (BB), Average Directional Index (ADX), Parabolic Stop and Reverse (SAR) and On-Balance-Volume (OBV) are some of the best indicators.
What are Cryptocurrency Technical Indicators?
Simply put, cryptocurrency technical indicators are tools that help predict the price action of a digital currency. They mainly use mathematical formulas for past prices and create graphical representations on trading charts. This then becomes the basis for decision making by traders.
Technical indicators have basically three roles in the traders plan. To warn of a potential scenario change. To forecast the future direction of prices or to confirm the feedback of another indicator.
While still within the technical indicators, there are four main types of indicators. These consist of trend following indicators, momentum indicators, volatility indicators and volume indicators.
Trend following indicators indicate the price direction. Momentum indicators provide information on how fast the prices change in a specified direction. Volatility indicators on the other hand show the rate at which the prices change. Volatility indicators do not consider the direction. Finally, there are the volume indicators that measure strength. Each category of indicators has its usefulness, as we shall see soon. Let us now have a look at some of the best indicators for crypto trading.
Moving Averages (MA)
Moving average is arguably one of the most popular technical crypto indicators. It is a simple indicator, and it forms the foundation for many other indicators. The main use of the Moving Average is to create a clear picture of the trend direction by smoothing out price fluctuations. Normal price charts have price points that zigzag and make it difficult to tell the trend. To calculate the Moving Average, you take the average closing price of an asset recorded over a set number of periods.
As is the case for most indicators, Moving Averages assist in forecasting future prices. Of great importance is the ability to know the ideal number of periods to use for the moving average. Why is this important? Over small time periods, the Moving averages remain very close to the current price thus they’re not as useful. Similarly, if there are too many periods, the line representing MA becomes “too smooth”. To deal with this challenge, different types of Moving averages exist, but two are most distinct. The Simple Moving Average (SMA) and the Exponential Moving Average (EMA). The simple moving average is the sum of closing prices divided by the number of periods. On the other hand, Exponential Moving Average gives more weight to the most recent prices. This results in a more reliable indicator than the SMA.
How to Use the Moving Averages
Moving averages help determine the trend. If the moving average trend line remains above prices, then the market is bearish. If the moving average trend line remains below prices, then the market is bullish. As you can see, it’s very simple. MA indicators require support and confirmation from other indicators.
Examples
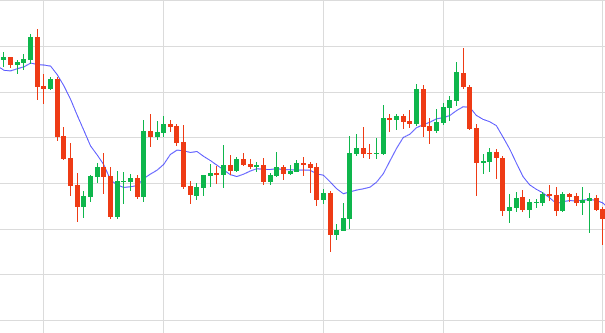
The moving average remains below the price for the uptrend and above it during the downtrend.
Moving Average Convergence / Divergence (MACD)
Moving Average Convergence / Divergence (MACD) is one of the most popular indicators for crypto trading. It is easy to use and gives highly reliable feedback to the trader. MACD is a momentum indicator. MACD is the difference after subtracting the 12-period EMA (Exponential Moving Average) from the 26-period EMA (Exponential Moving Average) at the closing prices. This shows how short-term price momentum compares to long-term price momentum.
How to Trade Using MACD
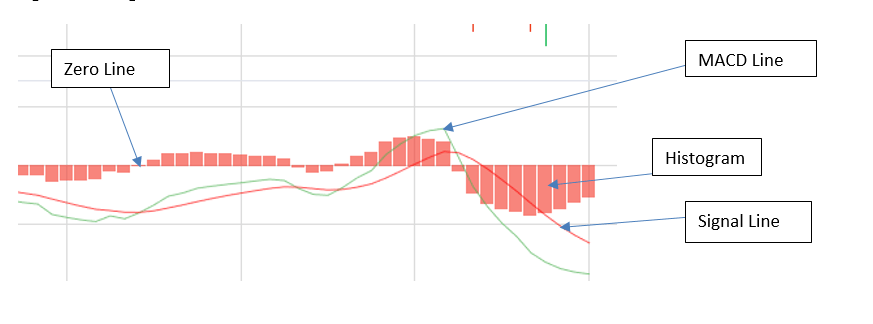
The MACD comprises four components: the MACD zero line, the MACD line (green), the MACD signal line (red), and the MACD histogram as shown below. When the signal line and the MACD line converge or diverge, they give a signal to the trader to either sell or buy. When the MACD line slopes downwards and crosses the signal line, it gives a bearish signal thus a good time to SELL. Likewise, when the MACD line slopes upwards and crosses the signal line, it gives a bullish signal thus a good time to BUY.
Examples
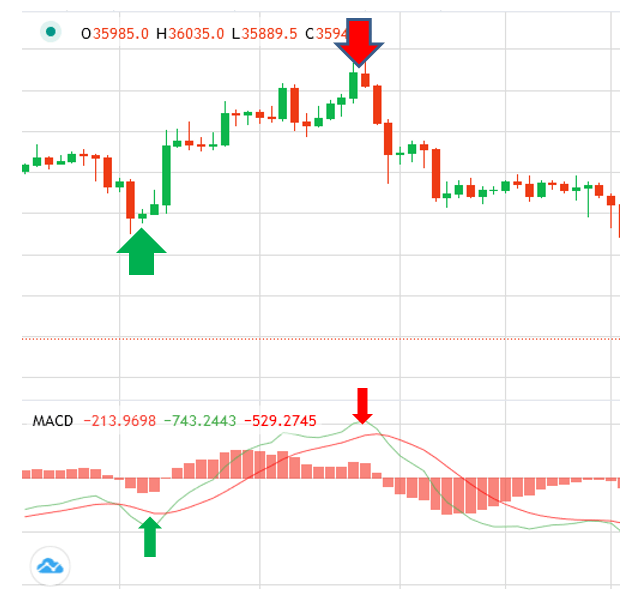
From the graph above, every time the MACD line crosses the signal line, the price changes direction. As indicated earlier, when the MACD line slopes upwards, the market becomes bullish.
Relative Strength Index (RSI)
Wells Wilder developed the Relative Strength Index (RSI) and over the years it has become one of the widely used crypto indicators. The RSI indicates the strength or weakness of an asset by comparing its upward movements against its downward movements over a given period.
RSI is a momentum indicator. It determines the underlying price momentum as well as its strength. RSI also indicates whether the asset is oversold or overbought. RSI determines the “current strength and state of the market.” The formula for calculating RSI is
RSI = 100 – 100 / (1 + RS);
Where RS = Average Value for Increasing Closing Prices / Moving averages’ value Decreasing Closing Prices for a certain period.
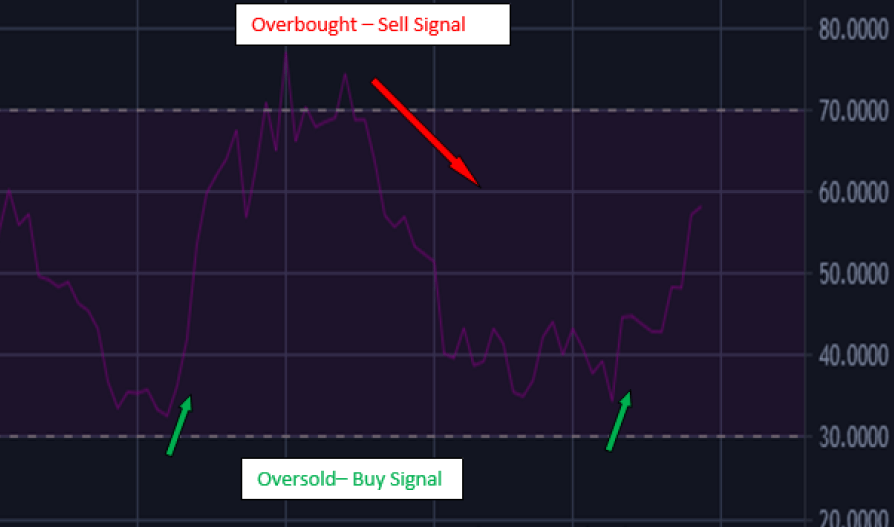
The standard index for the RSI is 14 periods and has three main lines namely 30, 50, and 70. Between these lines, three important zones result. Below 30 represents the oversold area, 30-70 represents Neutral, and above 70 represents the overbought area.
How to Use RSI
Anytime the reading approaches 30 or 70 on the RSI scale, there is a potential trend reversal. This is a good source for exit and entry points as it indicates the trend strength. If the RSI rises above 50, this is an indication of increased bullish momentum. If it exceeds 70 in the overbought zone and then starts to decline, SELL. If it drops to 30 and starts to rise, that’s a BUY signal.
Examples
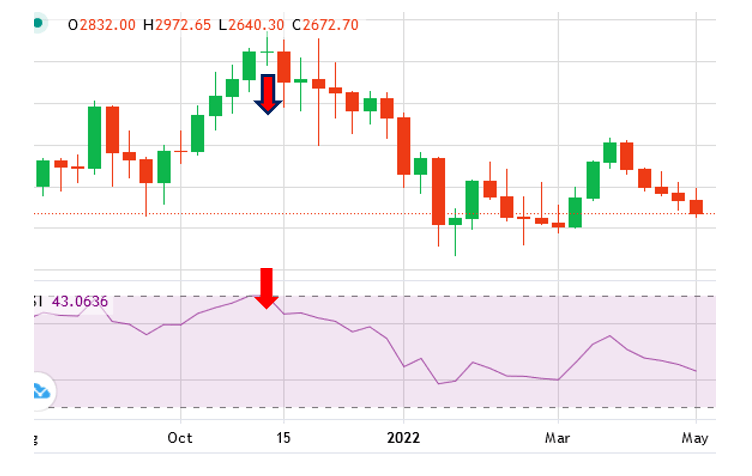
From the image below, the price falls sharply when the RSI hits the 70 mark. This is because the asset was already overbought and traders were selling.
Stochastic Oscillator (SO)
George Lane developed the Stochastic Oscillator in the 1950s. The Stochastic Oscillator is a crypto technical indicator that effectively shows trend momentum. It tells the trader whether a trend will continue or is coming to an end. What is the underlying concept for the Oscillator? Generally, during an uptrend, the closing prices keep increasing and vice versa for a downtrend. This means that in an uptrend the price of an asset will close at or above the previous price. Similarly, in a downtrend the price closes at or below the previous price. To measure momentum, the Stochastic Oscillator takes into account the rate of change of closing prices. This is equivalent to measuring the acceleration or deceleration of the trend, thus giving an idea of continuation or exhaustion.
How to Trade Using Stochastic Oscillator
The stochastic oscillator is depicted on a chart with oversold and overbought zones. The scale ranges from 0 to 100. When the stochastic lines exceed 80, the market is overbought and is likely to become bearish. For this reason, this is a SELL zone. If the stochastic lines fall below 20, the market is oversold and it is a good time to consider buying. If the lines cross while in the overbought or oversold areas, they signal a trend reversal. For example, if the lines cross above 80, it is a sell signal. If they cross below 20, it’s time to buy.
Examples
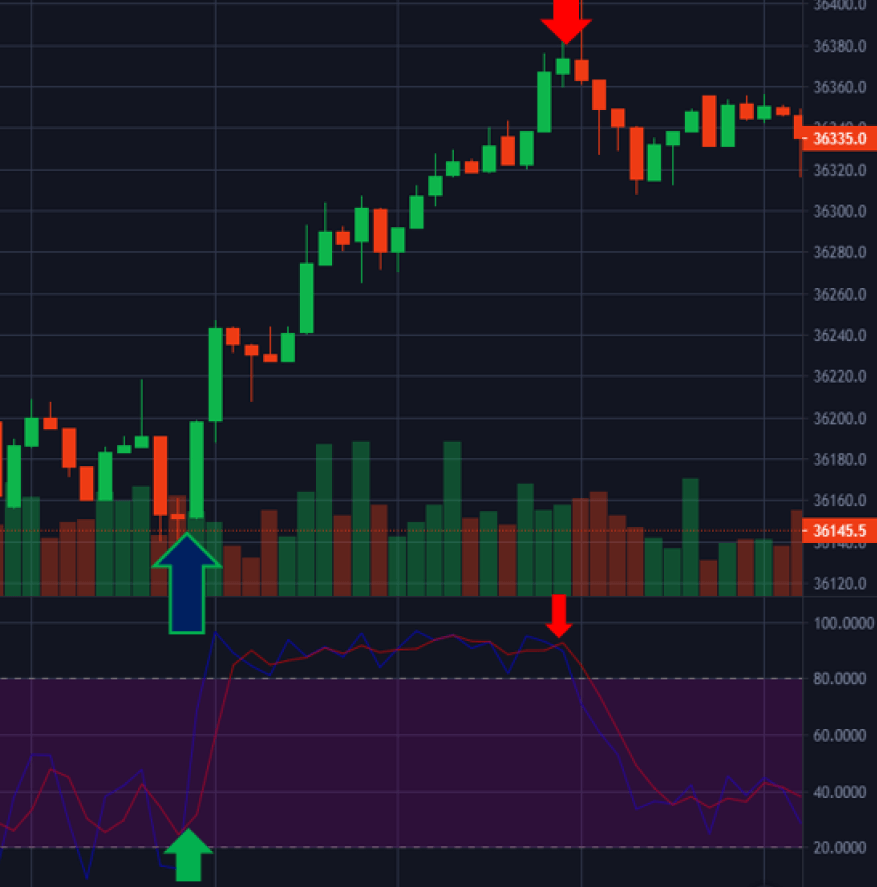
The market turns bullish as expected after SO reaches 20 on a downtrend. The opposite happens when SO rises above 80; the price falls.
Bollinger Bands (BB)
Financial analyst John Bollinger created the Bollinger bars in the 1980s. They have become widely accepted over the years as a reliable indicator of market volatility. The Bollinger Bands were a big breakthrough in the need for market volatility indicators. Just as the name suggests, Bollinger Bands is a band of moving averages. As the market volatility changes, the band widens or tightens to give a signal of action about to happen. When used alongside other indicators, Bollinger Bands are a powerful tool in price prediction. The Bollinger Bands are calculated and formed using Simple Moving Averages.
The Bollinger Bands, have 3 main brands; Upper, Middle, and Lower bands. The middle line represents a 20-day Simple Moving Average (SMA). The upper and lower bands are plotted on two standard deviations from the middle line.
How to Use Bollinger Bands
When a well-versed trader looks at the Bollinger bands, he can see several things. They can identify overbought and oversold areas. How can this be understood? Whenever the price approaches or exits the upper band, the asset is overbought. Similarly, whenever the price approaches the lower band, it means the asset is oversold.
Using the Bollinger bands, the trader can also set price targets by assessing the level of volatility exhibited. The bands diverge when there is high volatility. This indicates a possible end to the current trend. When volatility is reduced, the bands converge and indicate the start of a new trend.
Example
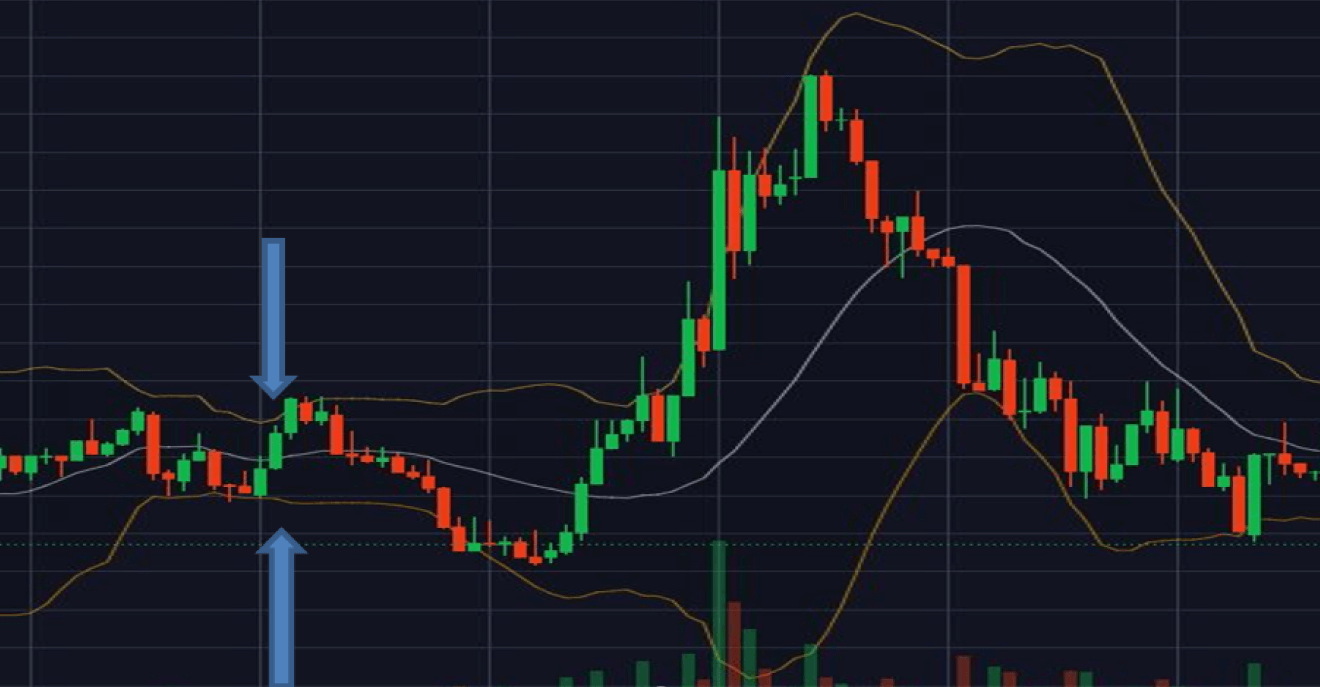
The Bollinger bands formed a squeeze in preparation for а big break.
Average Directional Index (ADX)
In order for a trader to make a profit, he must be able to determine the direction in which the price will move. This is important both before and after entering a position. Assuming one can correctly predict the trend, is there a way to determine its strength? Guess what, you got it correctly if your answer was the Average Directional Index (ADX). The ADX falls under the category of oscillators that comes in handy for this purpose. Whether it is an uptrend or a downtrend, ADX will give you an indication of the strength of the trend. It is important to know the strength of the trend as part of risk management. There is an opportunity to gain more by getting into a strong trend as opposed to a weak trend. However, this does not mean that you cannot trade in a weak trend.
Weak trends lead to range trading strategies being applicable during such periods. The trader who uses trend following strategies will be wide-eyed in search of a strong trend indicator. In order for ADX to achieve what it suggests, complex calculations, among other factors, that use moving averages are required.
How to Use ADX
Readings on the ADX scale range from zero to 100. If the ADX is below 20, it indicates a weak trend. Anything above 50 indicates a strong trend. When the ADX is below 20, the price usually moves sideways, in a range. Rising from the weak region to 50 and up signals increasing momentum.
Examples
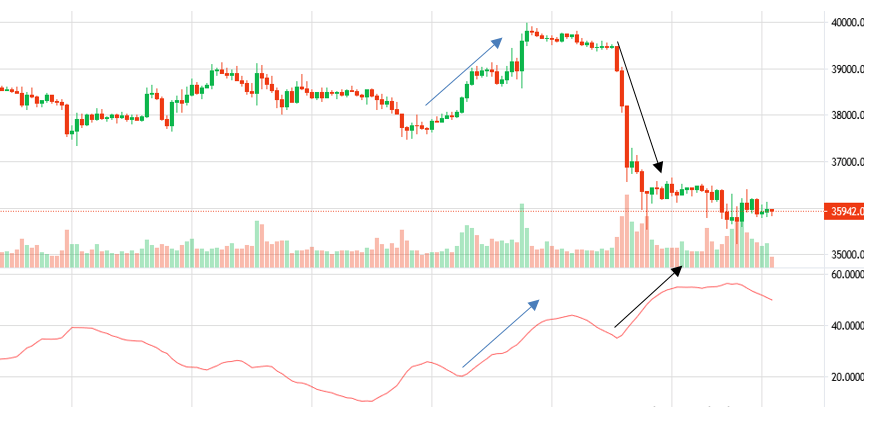
Each of the ADX increases above 40 corresponds to a strong trend. An increase from 20 to about 45 corresponds to a price increase from $37,600 to $40,000.
Parabolic Stop and Reverse (SAR)
The Parabolic Stop and Reverse (SAR) is a technical indicator designed to indicate momentum. Its main use is to identify the reversal of trends during periods of strong downtrend or uptrend. The Parabolic SAR bases its operation on the trailing level with respect to the trend. The indicator assumes that the trader is following the trend. This means that prices must change for this to happen and thus the trailing levels. In its design, Parabolic SAR has three main functions as an indicator.
- To highlight the prevailing trend
- To forecast potential trend reversal
- To provide the trader with clear potential exit and entry signals during a reversal
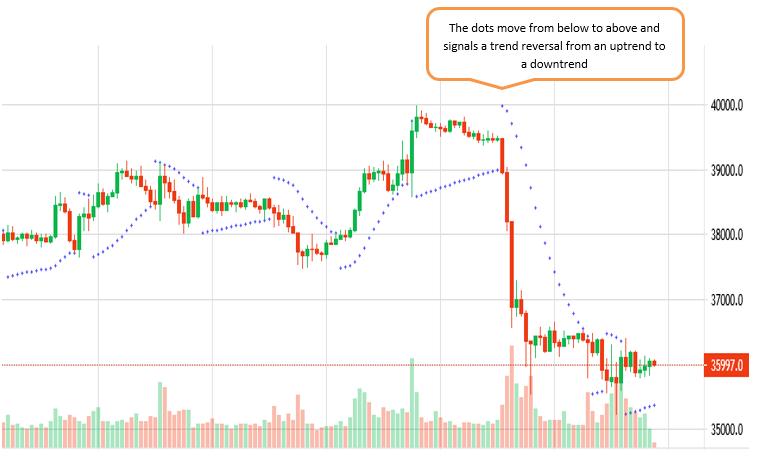
Just like most oscillators, the Parabolic SAR also shows when an asset is overbought or oversold. It shows this through the use of dots that appear above or below the prices. On a price chart, the dots appear alongside the respective asset prices. When a dot switches from below, to above or vice versa, this signals a potential reversal. When this happens, the trader can anticipate a reversal.
How to Use the Parabolic SAR
Now that we know what Parabolic SAR does, what should a trader look for? A trader can use Parabolic SAR in two ways. One way is as a momentum indicator and the other is as a trading system. When used as a momentum indicator, the dots tell whether the trend is bullish or bearish. If the dots remain below the prices, the trend is bullish. In such a scenario, a trader with a long position should hold on until a reversal signal develops. Similarly, if the dots remain above the prices, the trend is bearish. It indicates that the sellers are in total control of the market. For this reason, a trader with a short position should hold on until the dots flip their position.
As the name of the indicator suggests, the trader can use it to stop and reverse the trade at the moment of trend reversal. This also becomes a trading strategy in the second use of the Parabolic SAR. Remember that the dots are the stop levels and therefore this strategy will keep you in the market. Before moving on to the next indicator, there is something worth noting. The Parabolic SAR is a lagging indicator and therefore works best during a strong trend.
Example
From the image below, the dots flipped from below the candles at around $39,500 on the BTC chart to signal a trend reversal.
On-Balance-Volume (OBV)
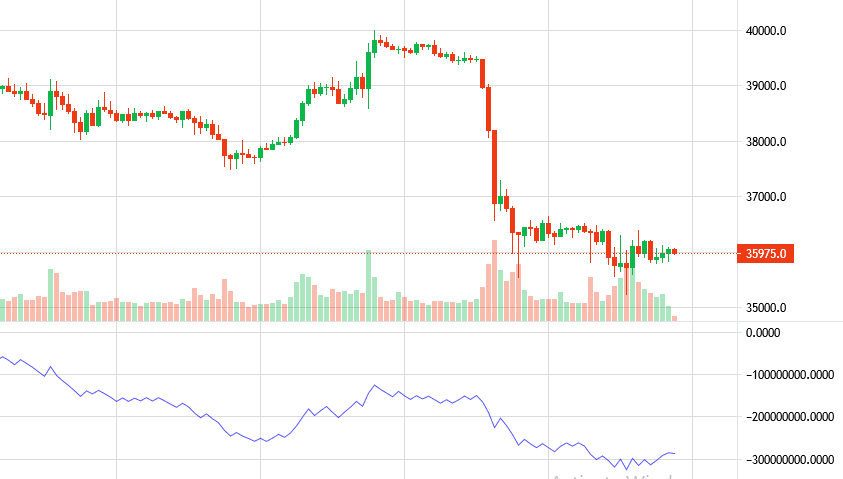
On Balance Volume (OBV) is a volume-based momentum indicator. OBV measures the buying or selling pressure of an asset using the cumulative value of the traded volumes over a specific period. One may wonder why there is a need to know the buying or selling pressure. The need to know is premised on the fact that pressure precedes price. Simply put, buying or selling pressure has a significant influence on price direction.
To calculate the Current OBV, one needs to add or subtract the day’s trading volume from the previous OBV. If the Current Closing Price is higher than the Previous Closing Price, the current OBV will be the sum of the Previous OBV and the Current Volume. If the Current Closing Price is lower than the Previous Closing Price, the Current OBV will be the difference between the Previous OBV and the Current Volume. In a scenario where the Closing Price is the same, then the Current OBV is equal to the Previous OBV.
Concisely, an increasing OBV indicates increasing buying pressure and vice versa. A decreasing OBV is an indication that more traders are willing to sell. When this occurs at the peak of an uptrend then it is time to consider selling.
How to Use OBV
Due to the close relationship between buying or selling pressure and the prices, OBV tends to mirror the candle formations. For this reason, a sustained increase in OBV indicates a potential price breakout. However, this does not always happen for various reasons. When the OBV and the price diverge, this signals a potential trend reversal.
Examples
Fibonacci Retracement (FR)
Fibonacci Retracement (FR) as an indicator originates from the well-known Fibonacci sequence. Fibonacci observed that there are natural ratios that exist and tend to influence how things occur. The crypto market is no exception thus the adoption of the Fibonacci Retracement levels. 0.236, 0.382, 0.618, and 0.764 are the four Fibonacci Retracement levels. It is clear from charts that prices retrace after a big breakout. Due to this fact, Fibonacci Retracement tries to predict how far the price will pull back before resuming its rise or fall. These points are the retracement levels, which then form support and resistance areas. In an uptrend, the prices pull back to a support level before rising again. Similarly, in a downtrend, the prices climb back to a resistance level before resuming the fall. Fibonacci predicts that the price will retrace to one or all the four levels before resuming the trend.
How to Use Fibonacci Retracement
One important thing to note is that Fibonacci Retracement works best in a trending market. The Fibonacci retracement levels form ideal entry points for traders. In an uptrend, a trader plans to BUY at the support level. In a downtrend, the trader plans to sell at the resistance level. To plot the Fibonacci levels, two key points are necessary. A Swing High and a Swing Low.
Examples
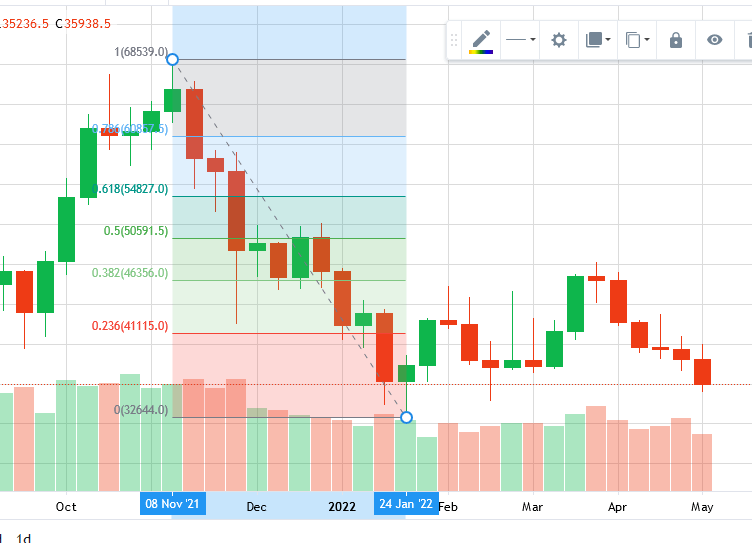
While on a downtrend, the price retraced to the 0.382 level and then resumed the downtrend as predicted by the Fibonacci Retracement tool. At this point, a trader using this tool would place a short position and follow the trend.
Standard Deviation
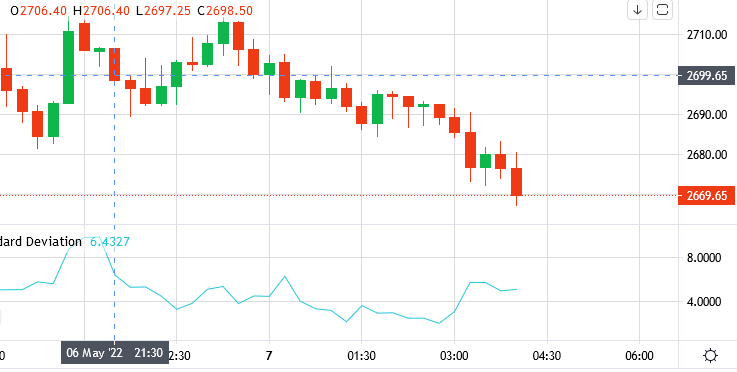
Sometimes we look at the complex indicators and overlook the simple ones. Standard Deviation is an indicator of price volatility. It measures how far the prices are from the average price. During periods of low volatility, the value of the standard deviation is low and vice versa. Interestingly, Standard Deviation takes part in other indicators. The most notable being the Bollinger Bands. Standard deviation is a good indicator of expected risk.
How to use Standard Deviation
When the value of SD goes up or down, there is a hidden reason for it. Sometimes there is no explicit explanation for the changes, and in most cases it shows the indecisiveness of the traders. For instance, if the SD rises at the trend top, then there could be indecision or panic selling.
Below is an image of how the SD compares with the price action. High values of SD correspond with large changes in the prices.
Conclusion
Becoming a successful trader does not happen overnight. It takes a lot of perseverance and hard work. Therefore, it is important to keep seeking more knowledge. Many other indicators would work well with the ones discussed above. However, it is important not to overanalyze as it might lead to confusion.
However, with Margex, you can rest assured that best-in-class technology will help you in your crypto trading journey. Furthermore, the cryptocurrency industry has been dubbed the future of decentralized finance.
“Margex has created a quality platform for trading cryptocurrency derivatives. We were most impressed by the exchange’s design and overall user experience, which is truly first-class,” noted Emma Avon from coincodex.com.


